![]()
Corporate Webpages Target Corporation
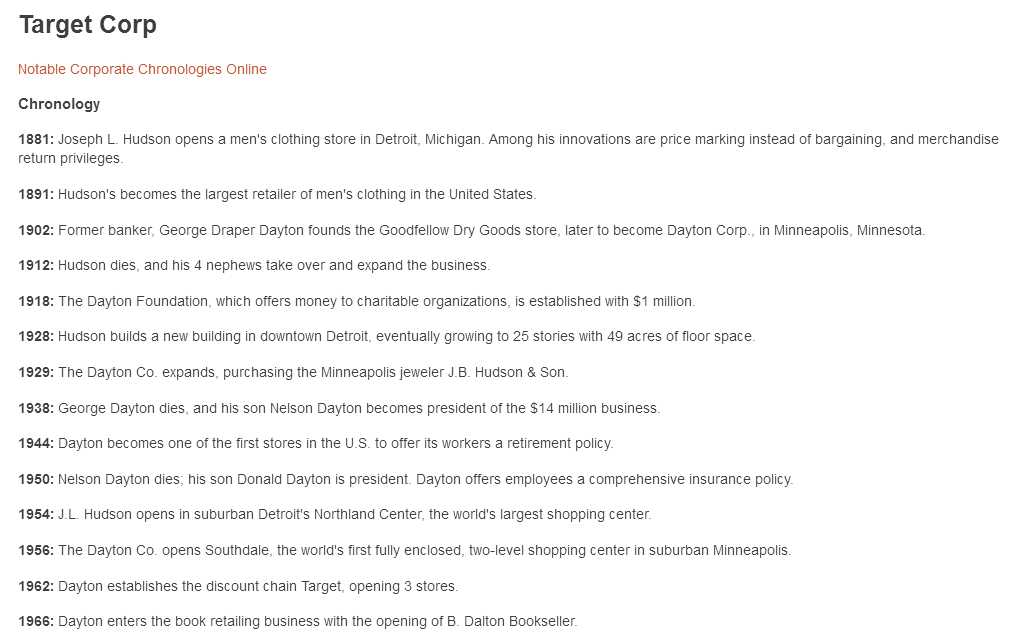
Target Corporation (TGT) is associated with former Dayton-Hudson
department stores. The history of that company goes back over a
century. In 2000, Dayton-Hudson renamed itself Target
Corporation and in 2004 divested itself of its department
stores, selling them to May Co. May Co. itself was acquired
later by Federated Department Stores. Target is more in the
class of "discount" department stores along with the likes of
one of its main competitors, Wal-Mart. Target has been steadily
taking market share away from stores like Kohl's in the clothing
business.
For a while, Target also owned the Mervyns chain which but
divested itself of that. Mervyns may soon close its doors.
The on-going replacement of larger more expensive department
stores by discount stores slowly drove some larger chains out of
business, but now the discount stores face a new challenge from
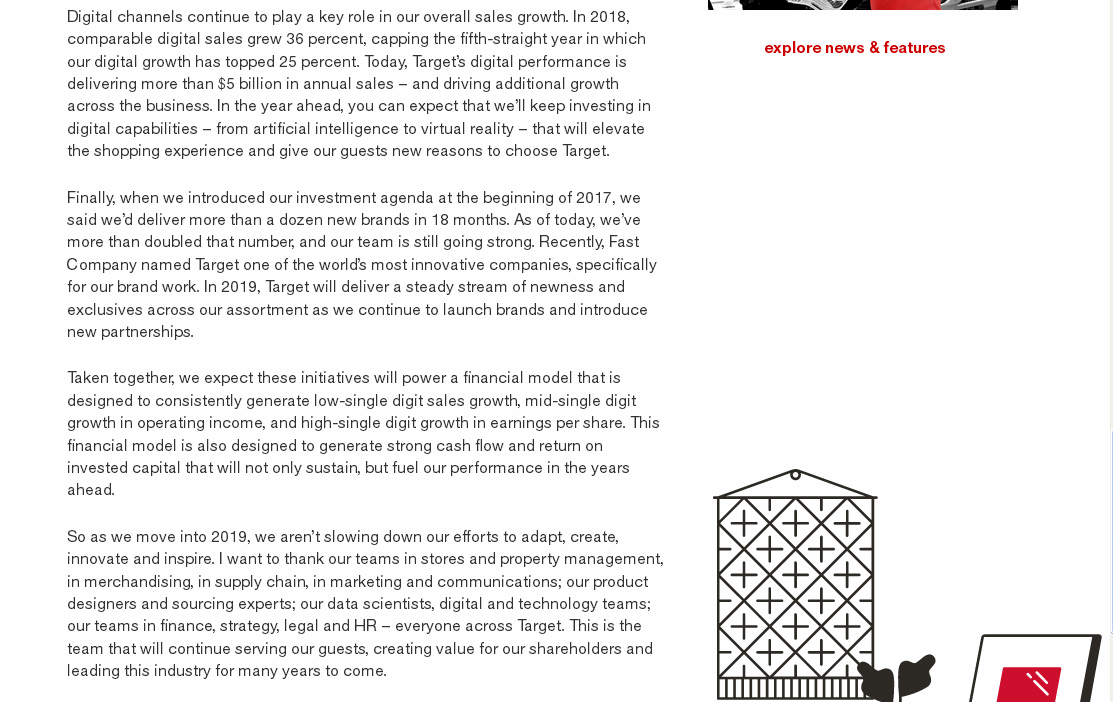
the likes of Amazon, and have begun to shift to on-line sales.
The problem with on-line sales is that the customer cannot feel,
touch the items he buys, but our experience with Target is that
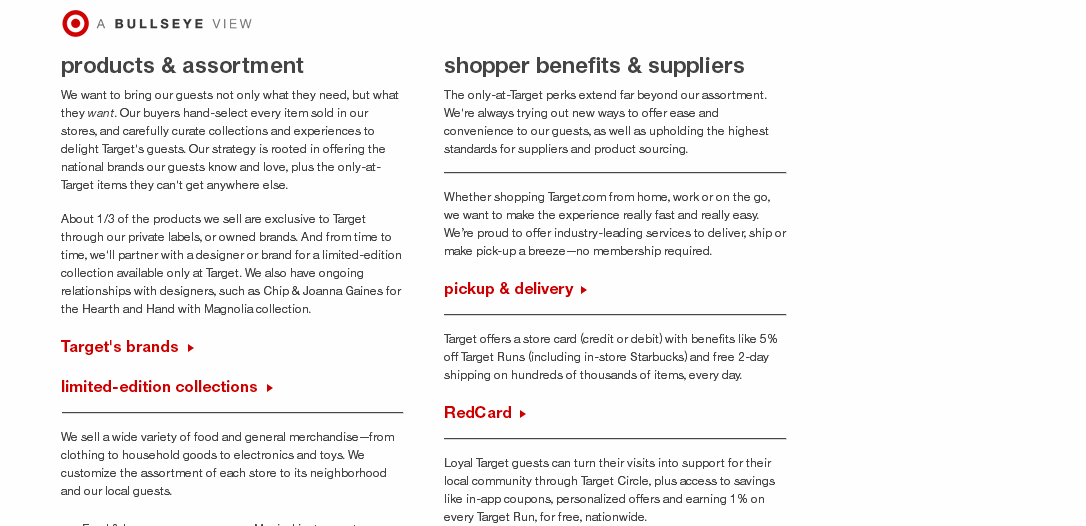
these items can be delivered to a local store for pickup free of
shipping charges, and easily returned if not as expected. So
Target continually is ramping up its on-line sales.
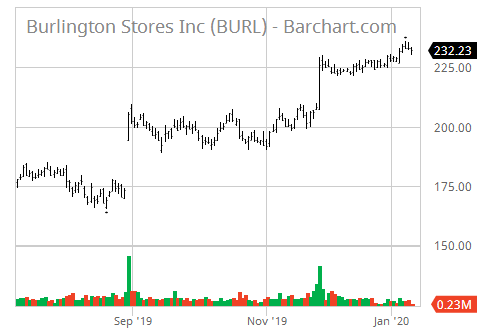
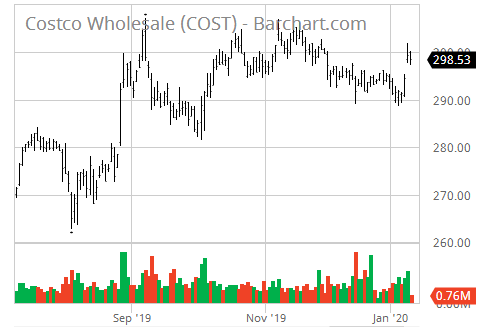
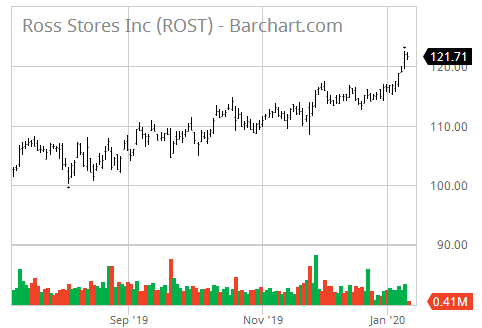
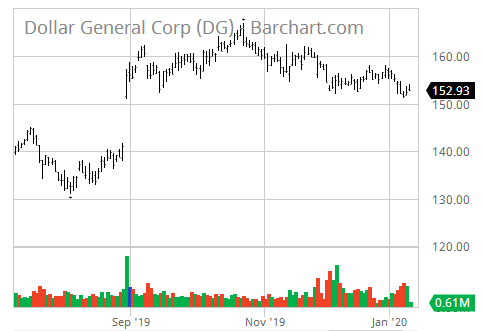
Target stock leads its competitors in advancing over the last
few years. It appears to be a "buy and hold" stock. It pays
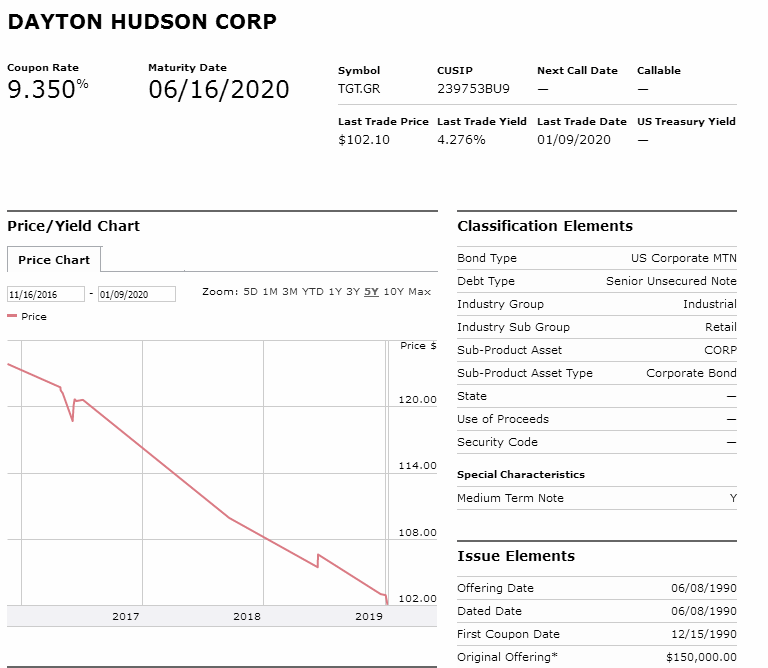
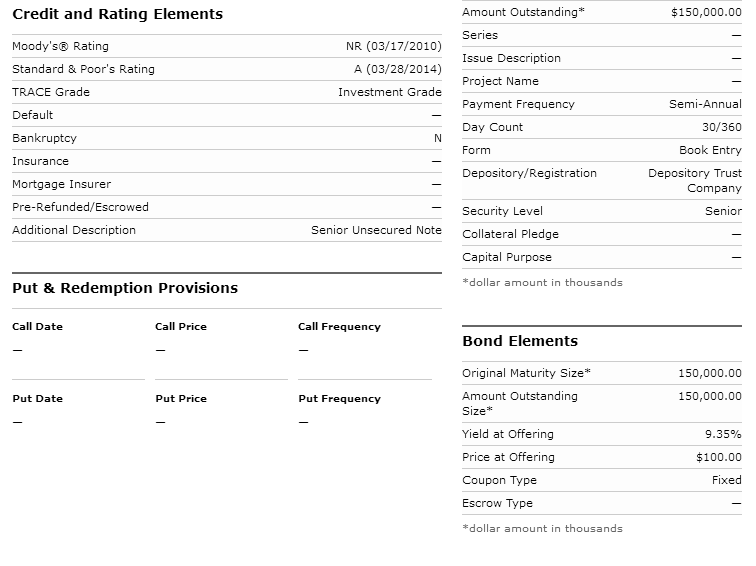
slightly more than a 2% dividend. Dayton-Hudson bonds are rated
"A" investment grade and surprisingly are paying north of 4%
interest if one can obtain them.
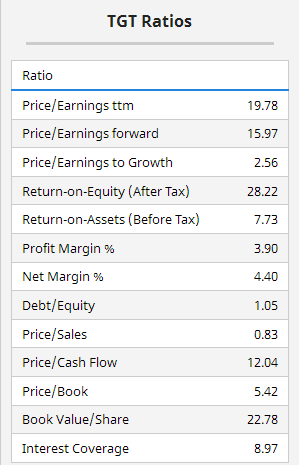
Target has an acceptable Zenith Index and financial ratios,
indicating good management and shareholder concern. It has a
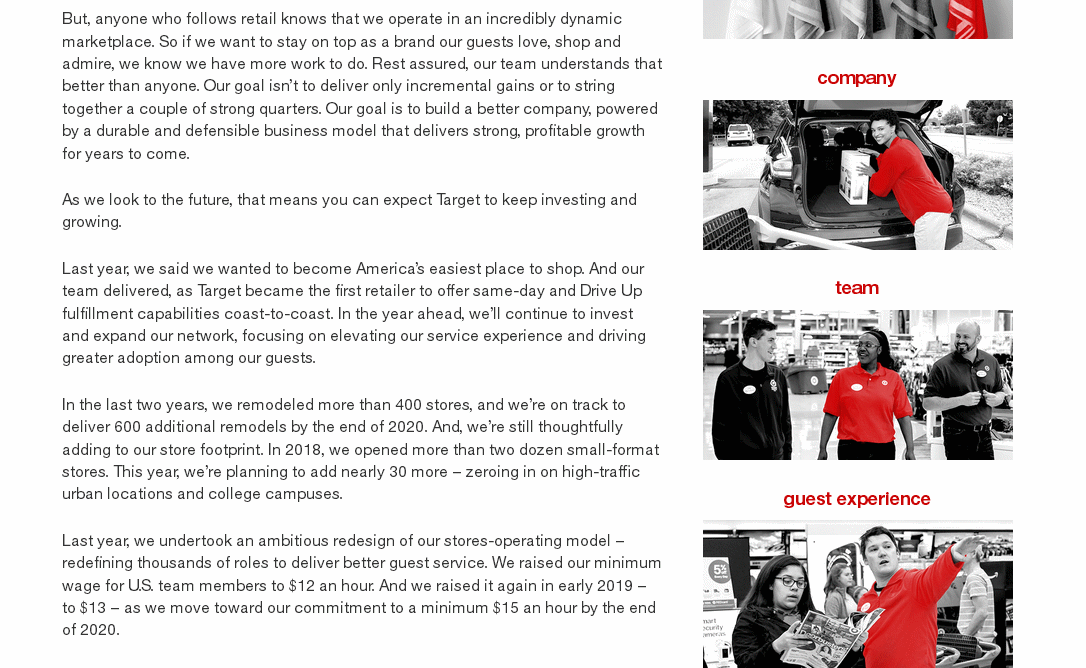
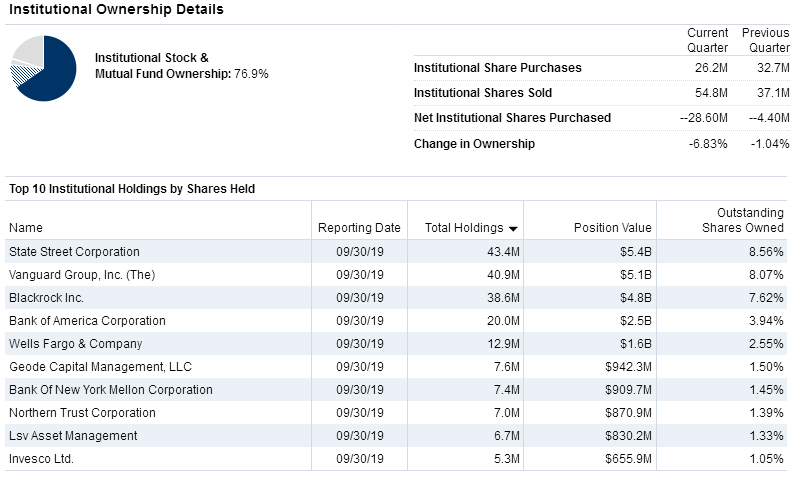
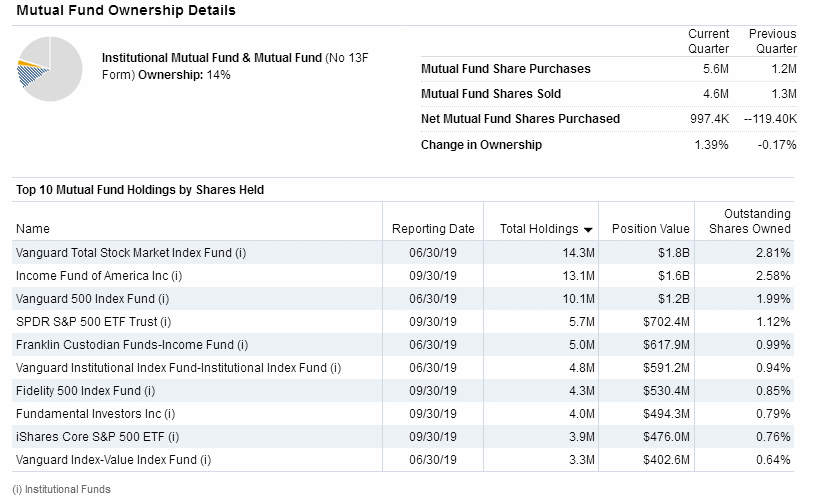
CEO Letter to shareholders. Institutions however are net
sellers because Target stock has reached great heights over the
years without many corrections and now looks a bit "toppy."
Risks include the shift to on-line shopping producing a
competitive landscape where margins are strained by increasing
selling, general, and administrative expenses. Macroeconomic
sentiment is another risk as customers consider things like fuel
costs, credit availability, employment levels and household debt
levels.
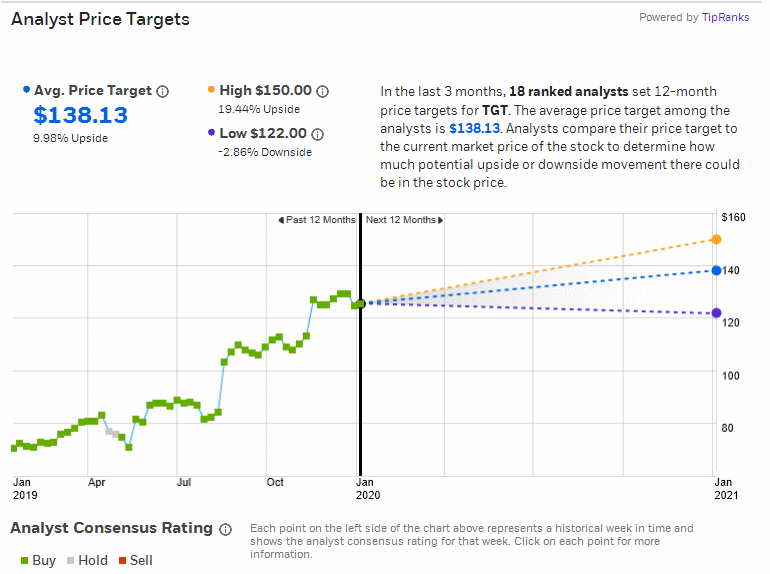
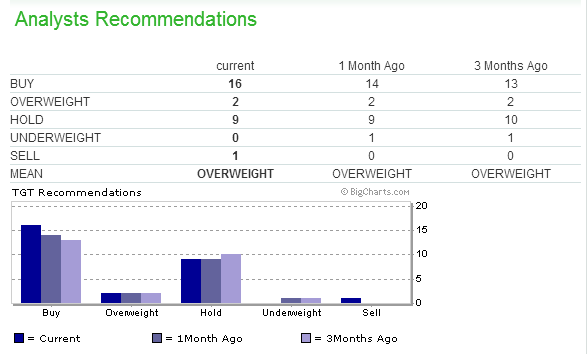
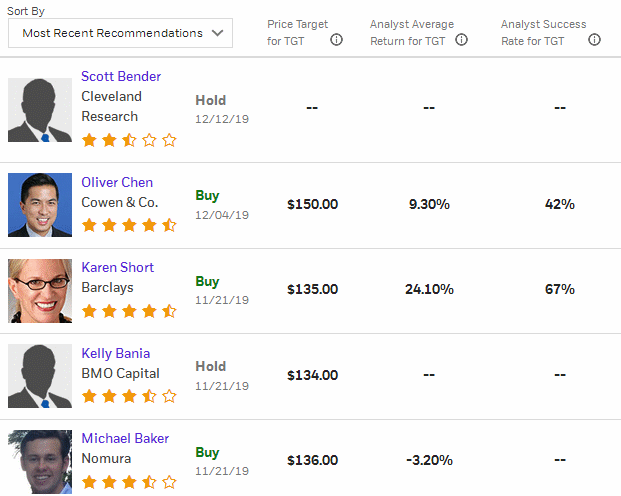
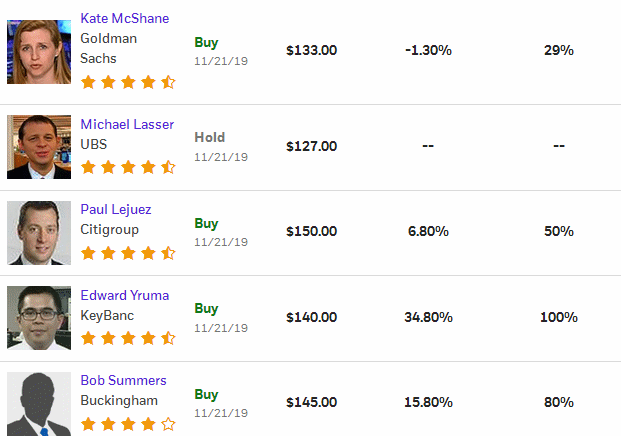
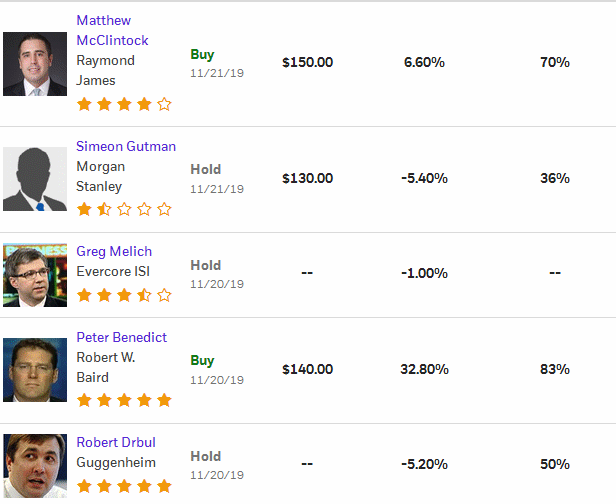
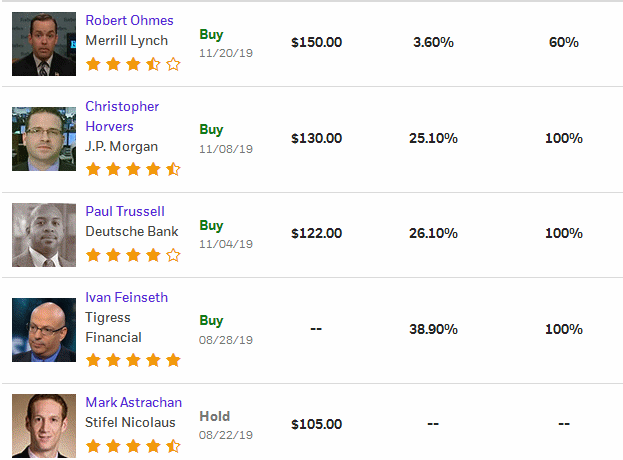
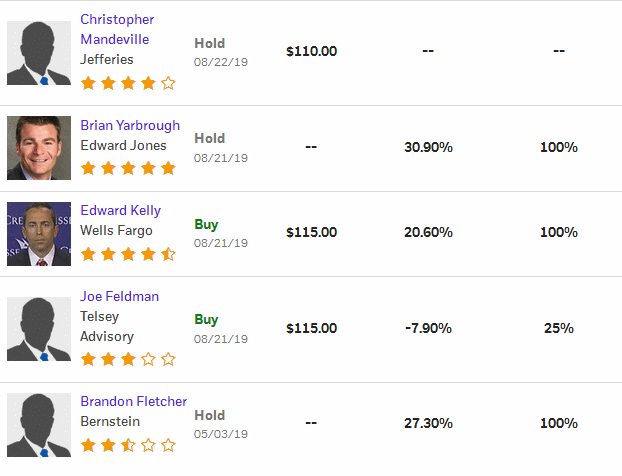
Most researchers are very positive on the stock which has been
rising steadily, but some of the big ones are showing surprising
reluctance or neutrality, such as Standard & Poor's, Jefferson,
or Value Engine.
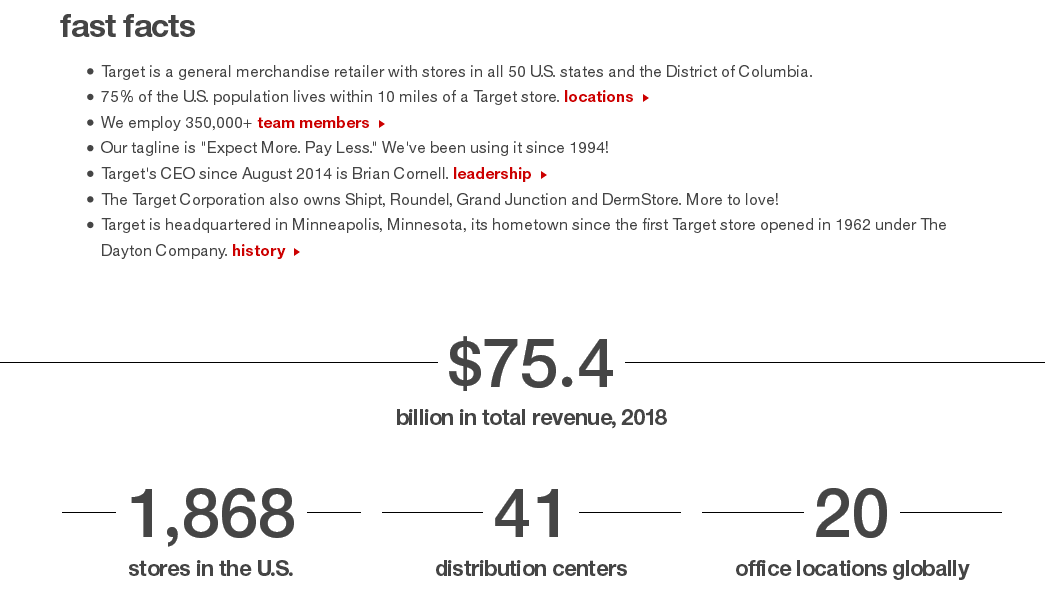
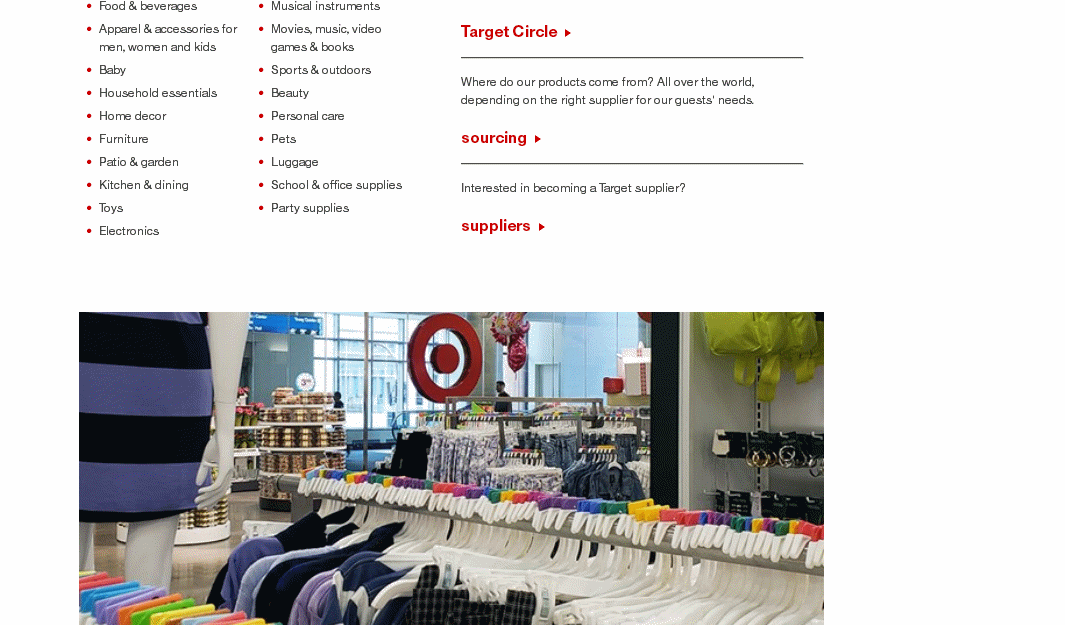
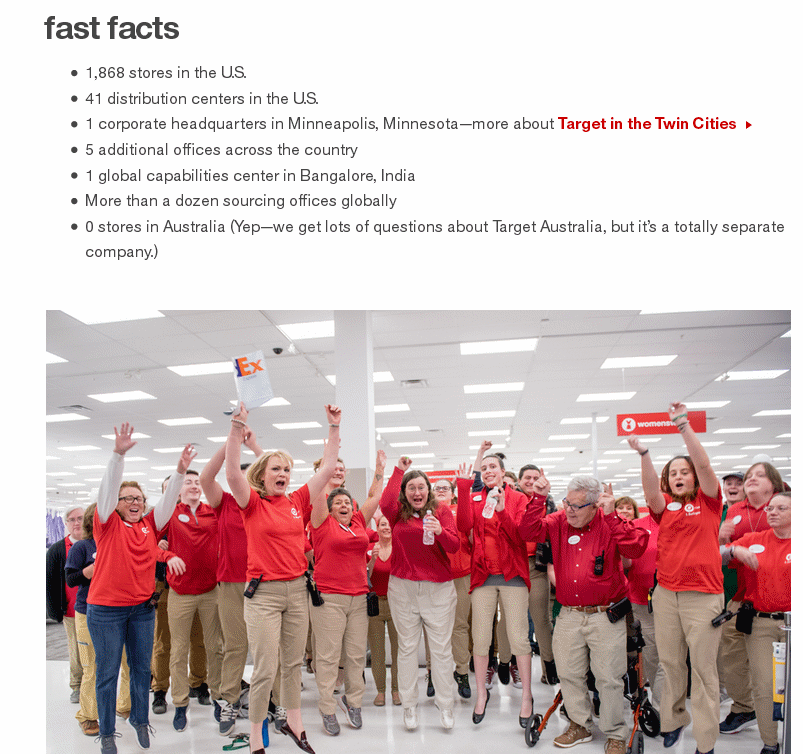
Target is huge with $77 billion in annual sales. It has stores
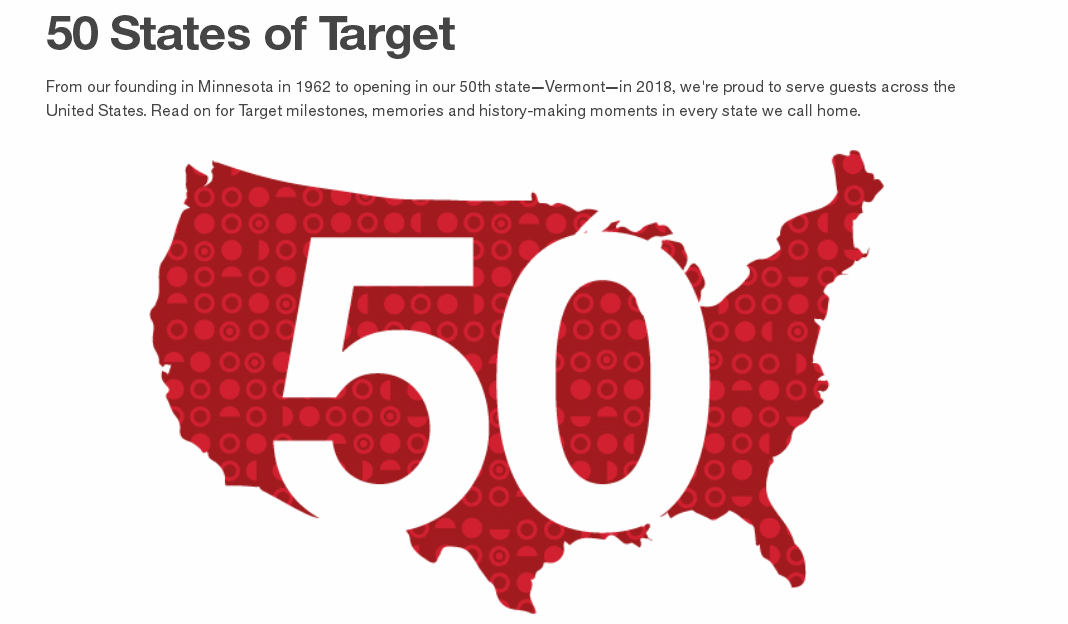
in every state. A company this large is expected to have solid
financials and low risk. One risk is trade relations that could
impact suppliers and competitive prices, as well as availability
of certain merchandise originating from outside the U.S.
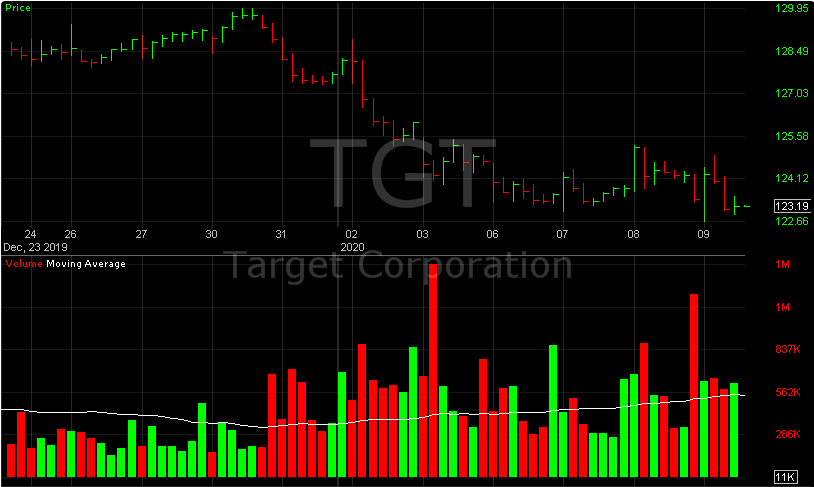
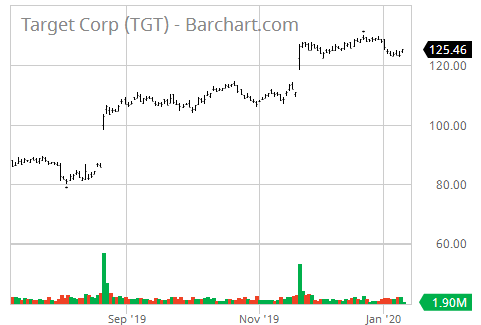
The way we view the Target stock chart is sort of like a series
of "Darvas boxes" where the stock occasionally makes quantum
jumps on high volume without much warning, then consolidates
before moving higher to the next box, currently around
$120-$130/share. These jumps seem to coincide with 3-month
patterns of earnings reports. The next one is not due until
March 3, 2020. Meanwhile, it might be wise to wait to see which
way the stock breaks from its current "box." Holiday sales were
reported in various ways by retailers, some grim, others optimistic.
(WAIT FOR PAGE TO LOAD COMPLETELY BEFORE LINKS WORK.)
Company Profile
Company History
News
Comparison with Peers
Bond Issue
Zenith Index
Financial Statements
Avg. P/E to Current P/E
Financial Ratios
Intrinsic Value (Disc. CashFlow)
Fair Value Estimator
Projected Earnings
Research Reports
Analysts' Opinions
Insider Activity
Institutional Activity
Sentiment
Short Interest
Standard & Poor's
Management's Discussion
Channel Potential
MACD Histogram
Intraday Chart
Val Idea
Stock Consultant
Point & Figure Chart
Wall Street Analyzer
Marketspace Chart
Time Series Forecast
Neural Network Prediction
Stock Options
Ultimate Trading Systems
Recommendation






Company Profile |

Company History |
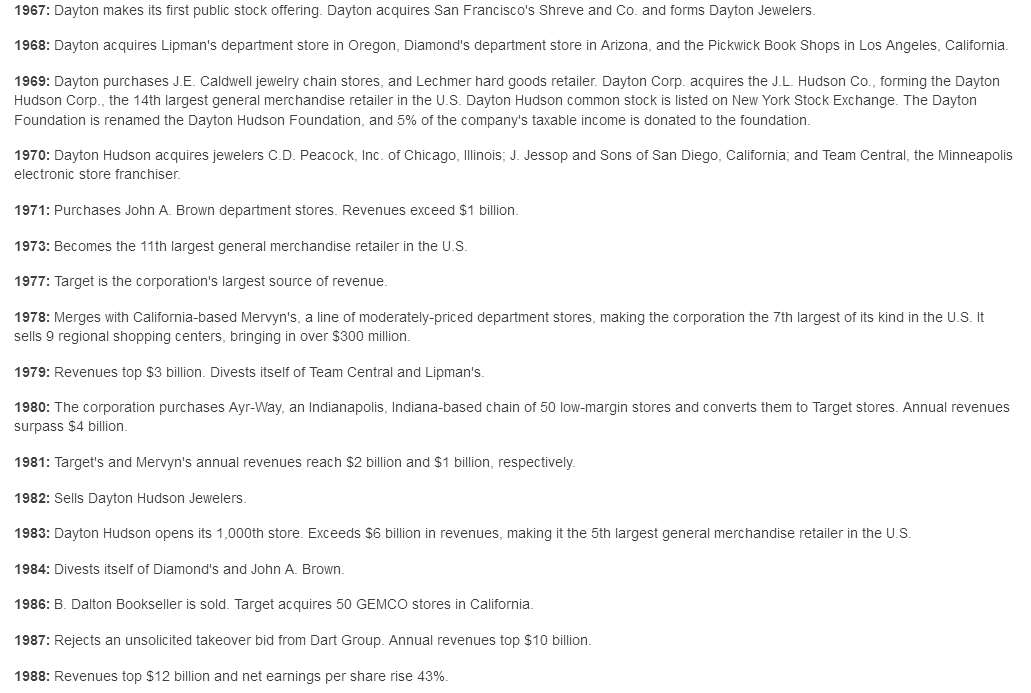
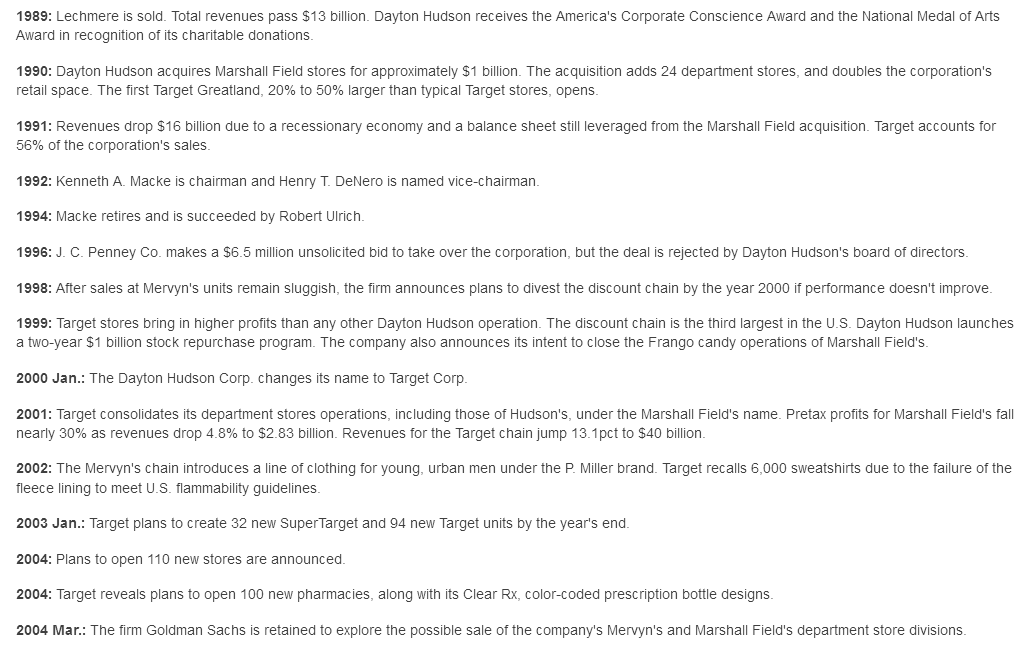
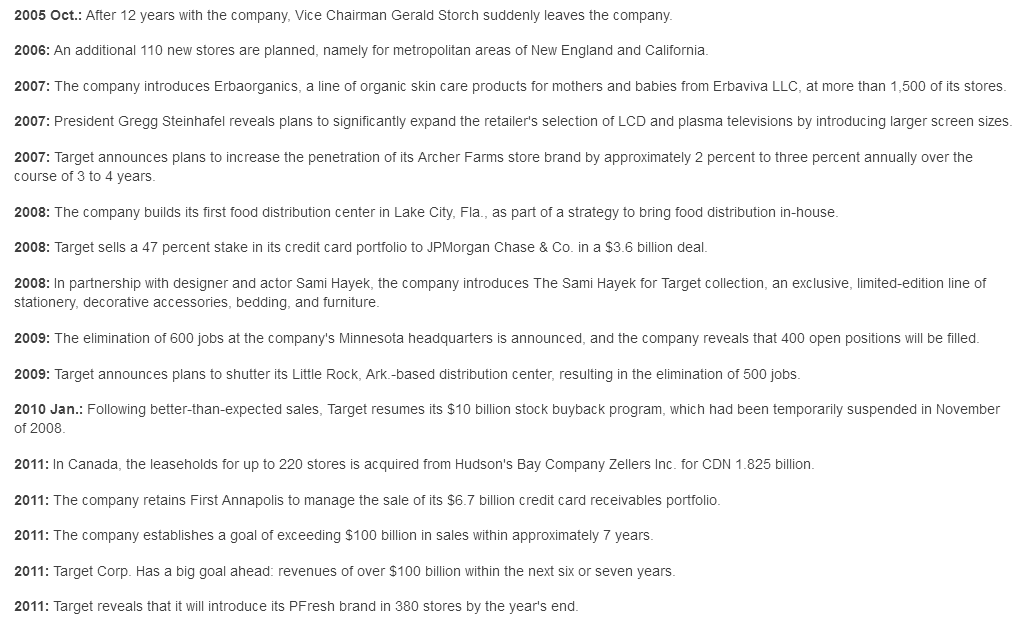
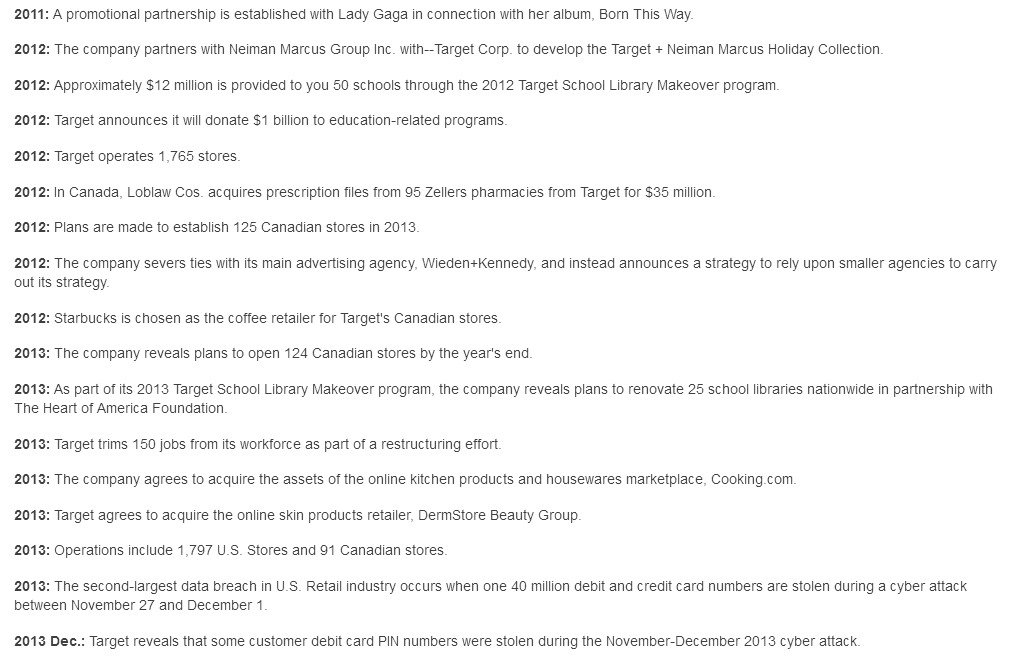
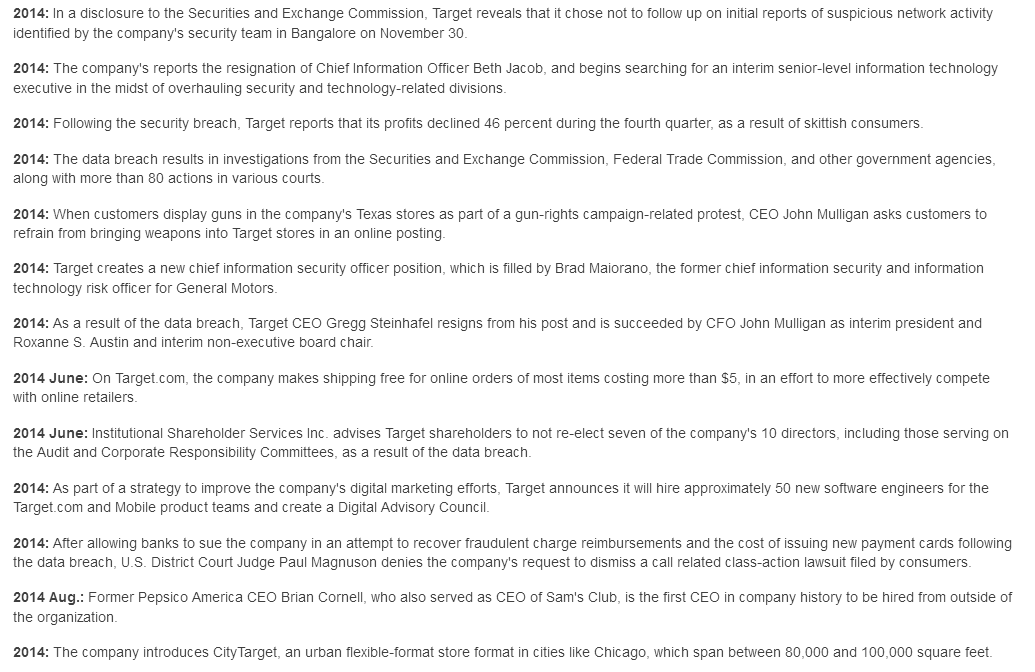
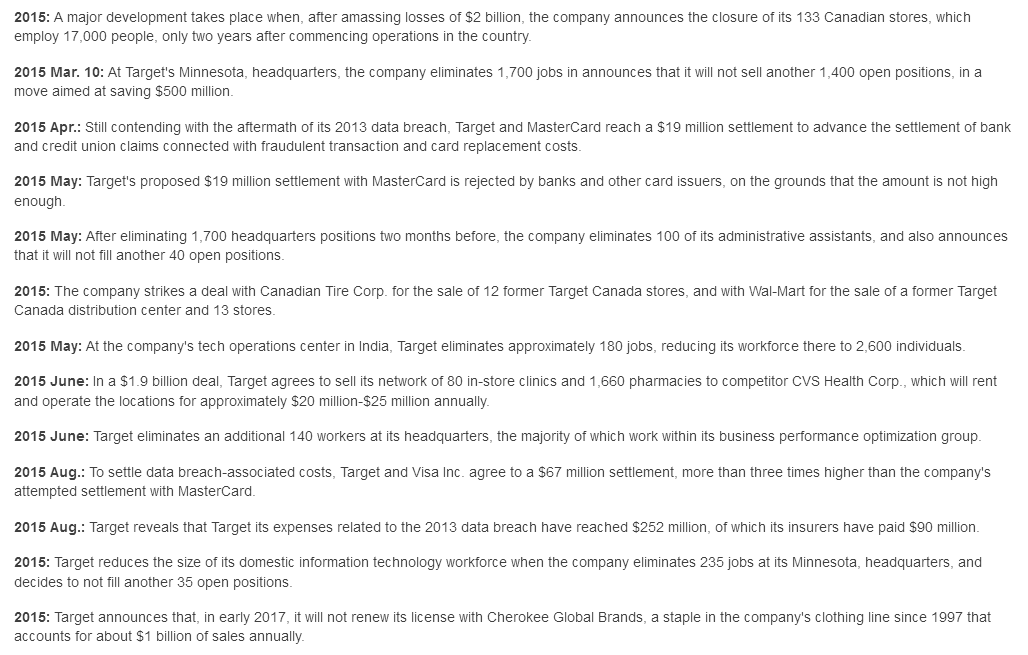
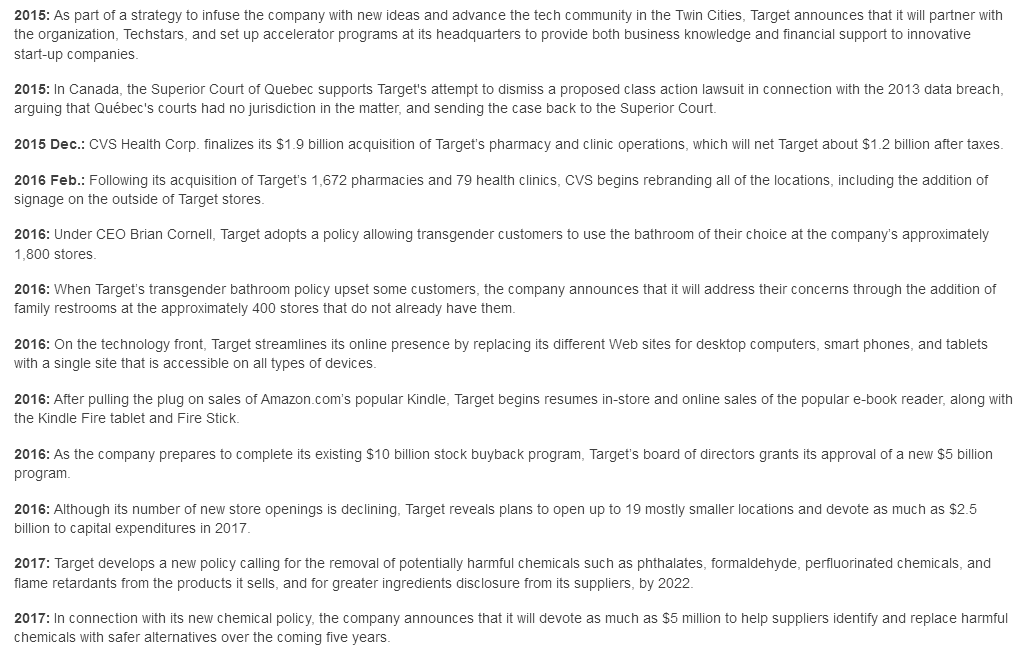
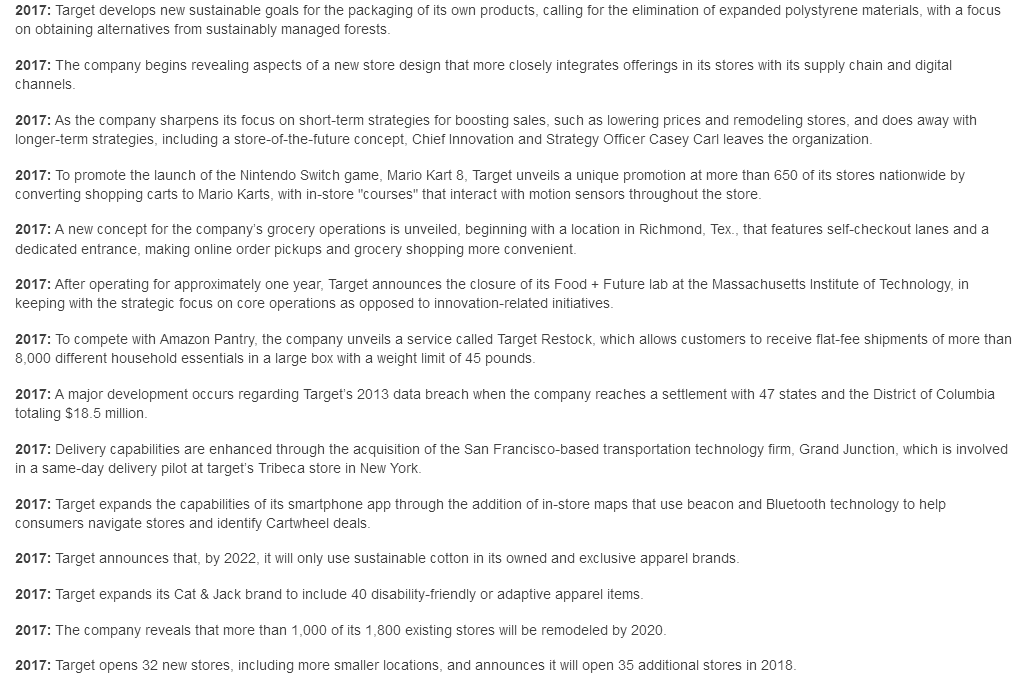
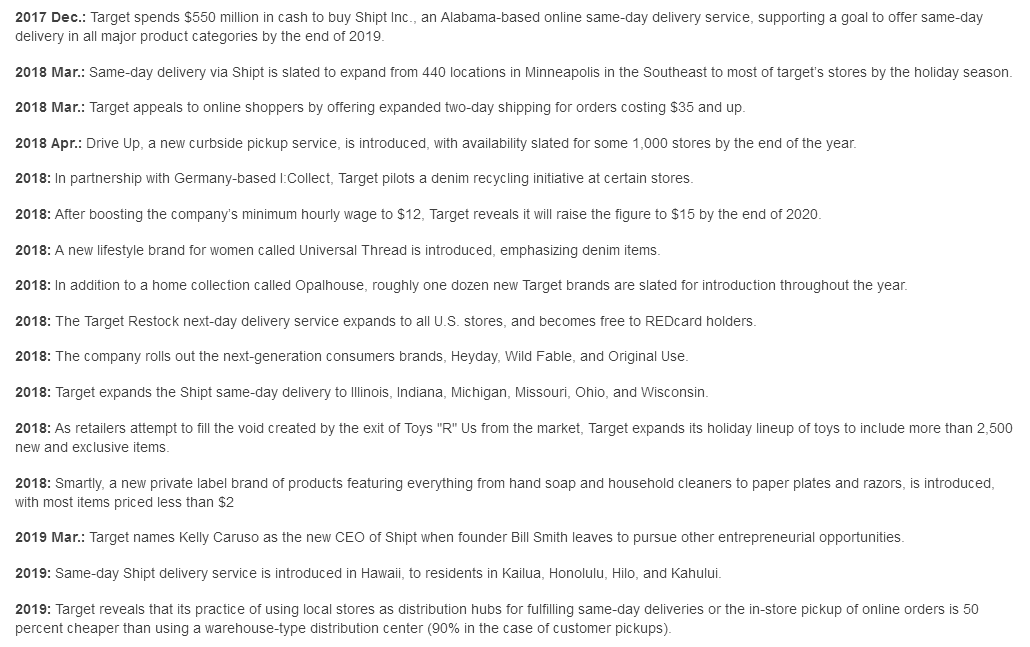
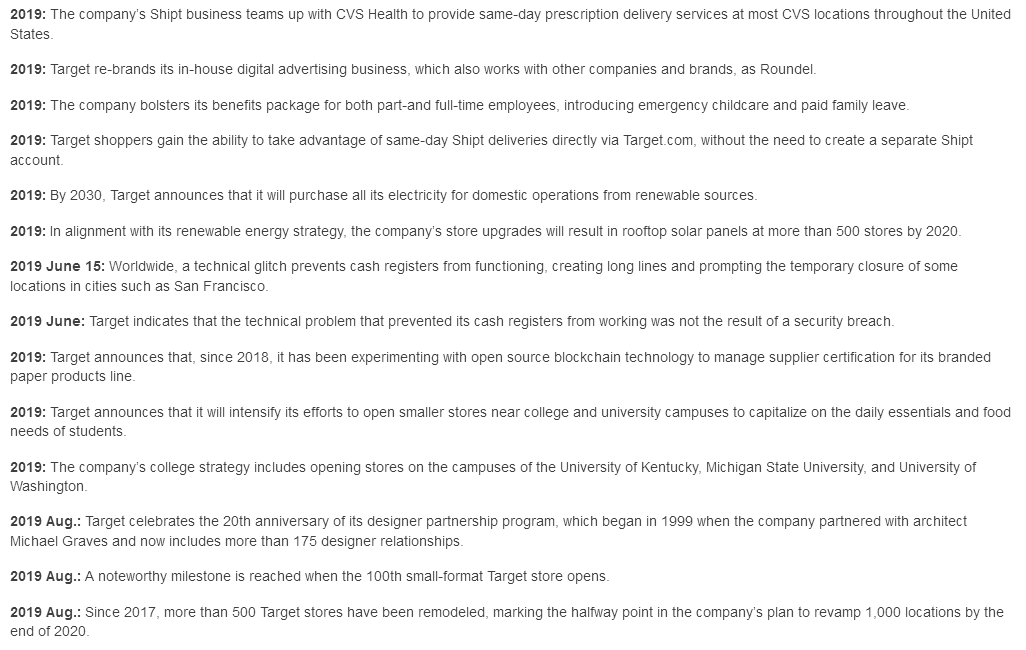

News |
Comparison |
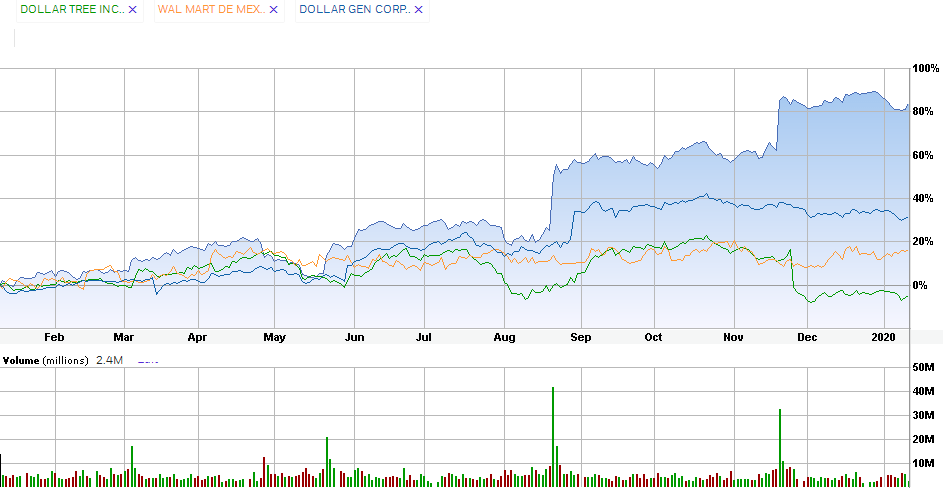
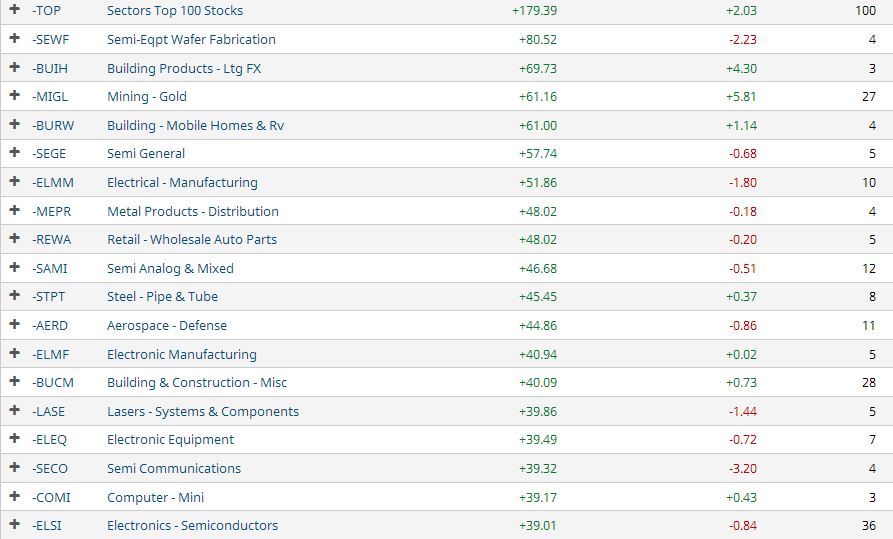
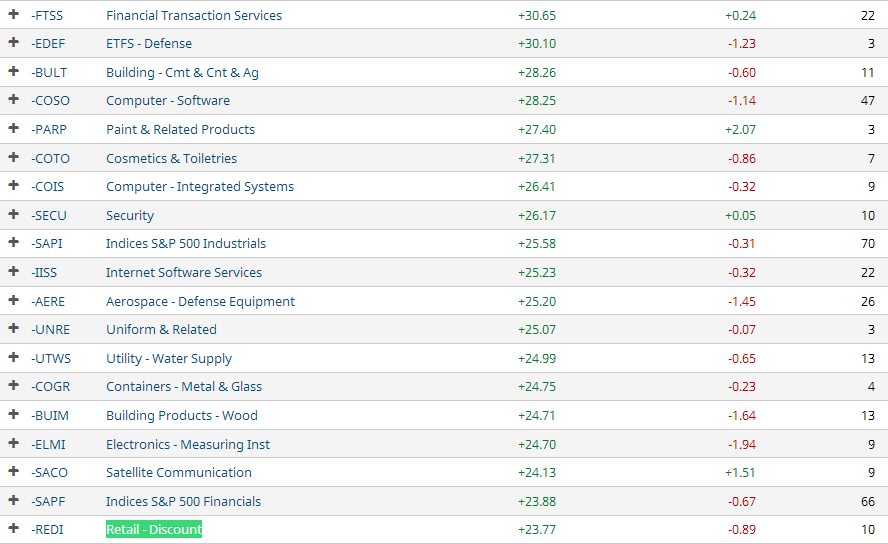
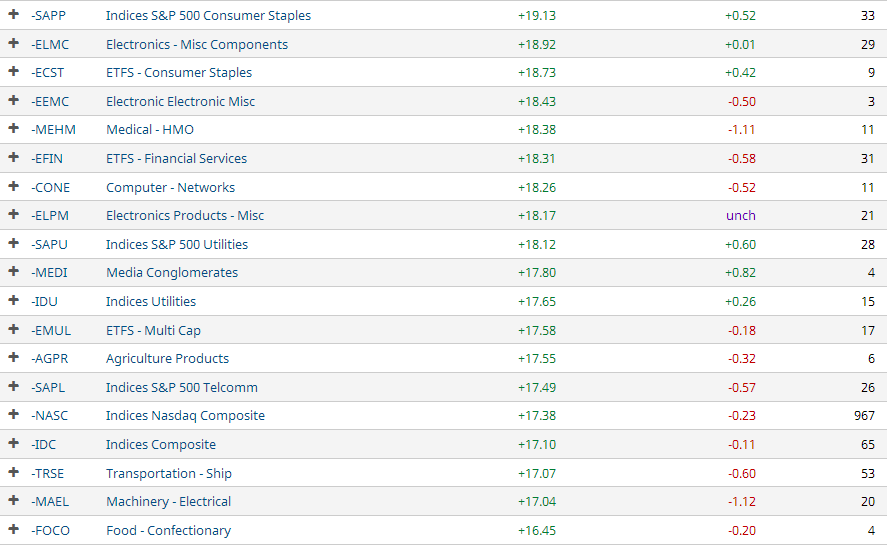
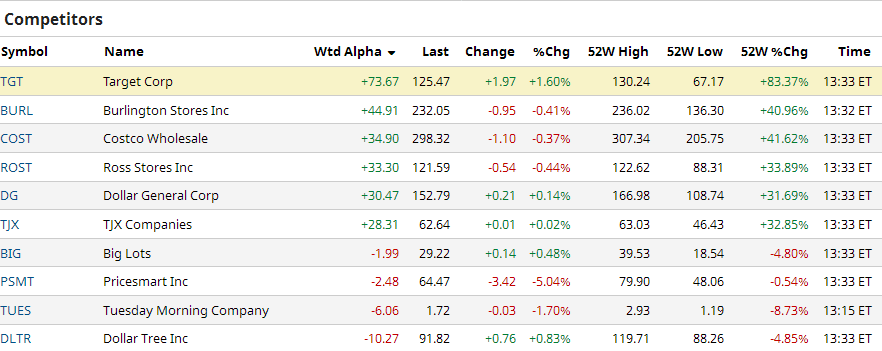
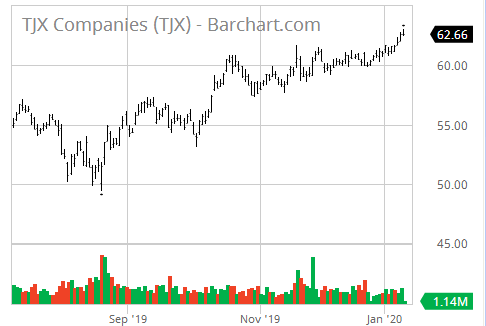
Similar Companies Performance:
Bond Issue |
Zenith Index |
Under current market conditions, a Zenith Index Score of 1.20 or above is required for a positive rating on this factor. 1.21 -1.30 is considered acceptable, 1.30-1.40 is considered strong and
> 1.40 is considered exceptionally strong. Accounting statements in this section often contain mistakes, especially in earlier years' totals, but data is deemed sufficient for us to give a rating. More accurate financial statements follow in the next section.
Target Corporation (TGT)                                  Exchange: NYSE
1000 Nicollet Mall
Minneapolis, MN 55403            Sector: Consumer Defensive
United States                    Industry: Discount Stores

Target Corporation operates as a general merchandise retailer in the
United States. The company offers beauty and household essentials; food
assortments, including perishables, dry grocery, dairy, and frozen
items; and apparel, accessories, home d+¬cor products, electronics, toys,
seasonal offerings, and other merchandise. The company also provides
in-store amenities, such as Target Caf+¬, Target Optical, Starbucks, and
other food service offerings. It sells its products through its stores;
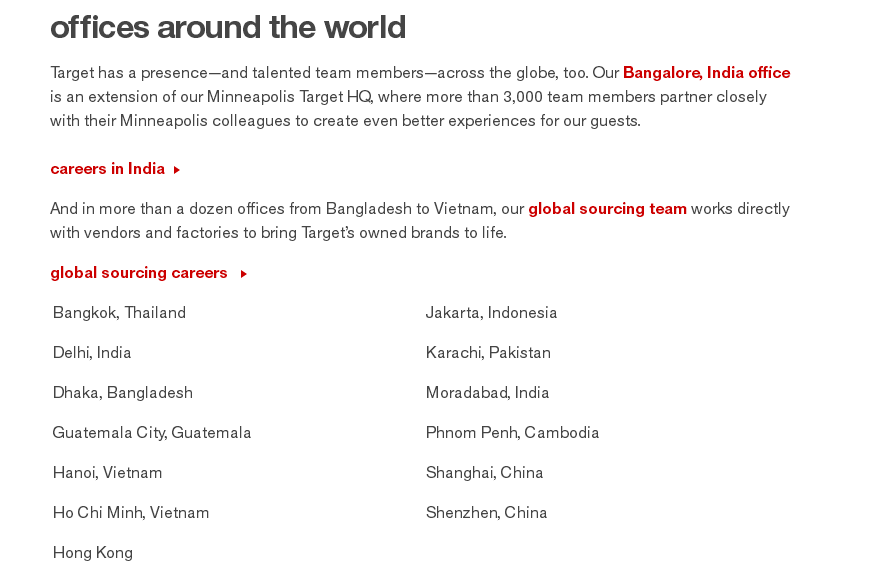
and digital channels, including Target.com. As of September 19, 2019,
the company operated approximately 1,800 stores. Target Corporation was
founded in 1902 and is headquartered in Minneapolis, Minnesota.

Last Trade: 123.50                           52-Week Range: 130.24 -  67.17
Employees: 360,000                           Avg.Volume:   4,714,349 Shares

Corporate Governance:
Pillar scores are Audit: 1; Board: 3; Shareholder Rights: 1; Compensation: 3.
         (A lower number means less governance risk.)

EPS:  6.25    Dividend Amount: $ 2.64          Yield:  2.14%
             Ex-Dividend Date: Nov 19, 2019    Payout Ratio:  41.41

Key Statistics:

    Trailing P/E:  19.94              Forward P/E (est.):  17.99
                                           Target Price: 136.33

Qrtly Stock Price Growth (yoy):  80.85%               Beta:   0.56
Qrtly S&P Index   Growth (yoy):   4.70%        Short Ratio:   2.06%
    Qrtly Revenue Growth (yoy):  52.00%         Shares Out:  506740000
   Qrtly Earnings Growth (yoy):  14.80%

          Book Value:  22.79                    Debt/Equity: 121.80%
    Price/Book Value:   5.47        Operating Profit Margin:   5.98%
         Price/Sales:   0.81                  Profit Margin:   4.18%
         Market Cap:  63,000,000,000       Return on Equity:  28.59%
    Enterprise Value:  75,680,000,000      Return on Assets:   6.65%

    Operating Cash Flow:      5,973,000
         Free Cash Flow:     -1,087,000


Annual Income Statement:                          (All numbers in thousands)
  Period Ending                             1/30/2019   1/30/2018   1/30/2017

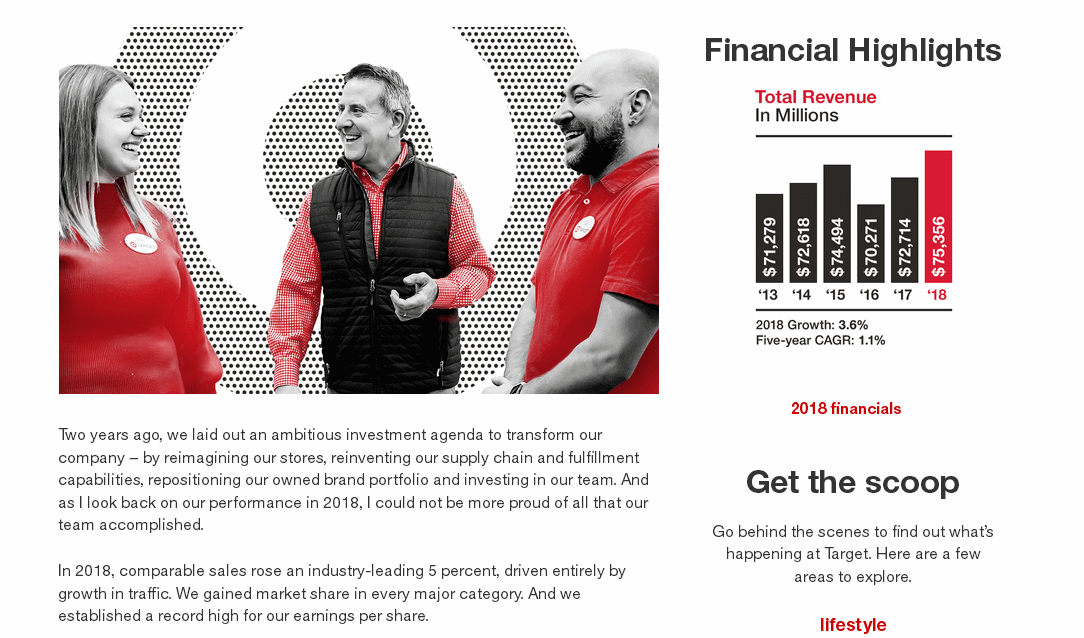
  Total Revenue                             75,356,000  72,714,000  69,495,000
  Cost of Revenue                           53,299,000  51,125,000  48,872,000
  Gross Profit                              22,057,000  21,589,000  20,623,000

Operating Expenses:
  Research & Development                             0           0           0
  Selling, General & Administrative         15,723,000  15,140,000  13,356,000
  Total Operating Expenses                  17,947,000  17,365,000  15,654,000

Operating Income or Loss                     4,110,000   4,224,000   4,969,000

Income from Continuing Operations:
  Total Other Income/Expenses Net               27,000      59,000           0
  Interest Expense                             461,000     666,000   1,004,000
  Income Before Taxes                        3,676,000   3,630,000   3,965,000
  Income Tax Expense                           746,000     722,000   1,296,000

Net Income from Continuing Op.s              2,930,000   2,908,000   2,669,000

Non-recurring Events:
  Extraordinary Items                           -7,000      -6,000     -68,000
  Net Income                                 2,937,000   2,914,000   2,737,000

Net Income Avail to Common Shares            2,937,000   2,914,000   2,737,000


Annual Cash Flow Statement:                   (All numbers in thousands)
  Period Ending                         1/30/2019     1/30/2018     1/30/2017

  Net Income                             2,930,000     2,908,000     2,669,000

Operating Activities:
  Depreciation                           2,474,000     2,445,000     2,298,000
  Changes in Accounts Recv'bls                   0             0             0
  Changes in Liabilities                 2,457,000     4,390,000     3,889,000
  Changes in Inventories                  -900,000      -348,000       293,000
  Changes in other Oper'g Acts              17,000     1,241,000      -214,000

Total Cash Flow f Operations             5,973,000     6,923,000     5,436,000

Investing Activities:
  Capital Exenditures                   -3,516,000    -2,533,000    -1,547,000
  Investments                                    0      -518,000             0
  Other Cash Flows fr Investing                  0       -55,000        28,000

Total Cash Flows from Investing         -3,416,000    -3,075,000    -1,473,000

Financing Activities:
  Dividends Paid                        -1,335,000    -1,338,000    -1,348,000
  Sale of Purchase of Stock             -2,124,000    -2,124,000    -2,124,000
  Other Cash Flows fr Financing                  0             0        28,000

Total Cash Flows from Financing         -3,644,000    -3,717,000    -5,497,000

Change in Cash & Cash Equiv.            -1,087,000       131,000    -1,534,000


Annual Balance Sheets:                              (All Numbers in Thousands)
  Period Ending                          1/30/2019     1/30/2018     1/30/2017
Current Assets:
  Cash & Cash Equivalents                 2,643,000     2,512,000     4,046,000
  Short Term Investments                          0     1,110,000             0
  Net Receivables                           416,000             0             0
  Inventory                               8,597,000     8,309,000     8,601,000
  Other Current Assets                    1,300,000     1,100,000     1,161,000
  Total Current Assets                   12,540,000    11,990,000    14,130,000

  Long-Term Investments                  44,818,000    42,071,000    41,463,000
  Property, Plant & Equipt               26,420,000    24,658,000    25,217,000
  Goodwill                                  630,000       133,000       133,000
  Intangible Assets                         152,000       126,000       144,000
  Other Assets                            1,343,000       783,000       915,000

Total Assets                             40,303,000    37,431,000    40,262,000

Current Liabilities:
  Accounts Payable                        8,677,000     7,252,000     7,418,000
  Current Portion LT Debt                 4,094,000     3,737,000     4,236,000
  Other Current Liabilities                 787,000         1,000       153,000
  Total Current Liabilities              13,052,000    12,708,000     12,622,000

  Long Term Debt                         11,117,000    11,031,000    11,945,000
  Other Liabilities                       1,866,000     1,860,000     1,897,000

Total Liabilities                        28,652,000    26,478,000    27,305,000

Stockholder Equity:
  Common Stock                               45,000        46,000        50,000
  Retained Earnings                       6,495,000     5,884,000     8,188,000
  Capital Surplus                          -747,000      -638,000      -629,000
  Total Stockholder Equity               11,651,000    10,953,000    12,957,000


Target Corporation (TGT)                    [Indices near +3.0, near zero,
                                            or < zero bear special attention.]
P/E Ratio Tests:
P/E Ratio < 28?            1.4042          P/E Ratio > 5?             1.0000
P/E Ratio Vs Growth Rate:  3.0000          Forward P/E Ratio < 28?    1.5564
Price/Sales Ratio < 2.3?   2.8395          Inventory/Sales < 5%?      0.4383
Sales < $1 Billion?        0.0133          Operating Margin < 7.5%?   1.2542

Balance Sheet Tests:
Debt/Equity < 0.40?        0.3284          Long-Term Debt Service:    1.0480
LTD Being Reduced?         0.0000          Short-Term Debt Service:   0.0000
Current Ratio > 2?         0.4804          Working Capital >= 1.5?    1.5821
Leverage Ratio < 20%?      0.2256          Debt/Assets < 1?           3.0000
Quick Ratio > 1?           3.0000          Inventory Turnover > 1?    0.4790
Share Equity Increase:     1.9091          Market Cap.< 1.5 Billion?  0.0238
                                           Intangibles < 3% Assets?   1.5462
Income Tests:
Profit Margin < 7.5%?      0.5573          EPS Annual Growth > 10%?   0.0992
Dividend Yield > 2.0%?     0.9346          EPS 3-yr Growth > 15?      0.1398
Enterprise Value/Revenue   0.8361          EPS Growth Consistent?     2.0000
Enterprise Value/EBITDA:   3.0000          Collection < 45 days?      3.0000
EPS Qrtly Growth > 10%?    0.0068          Gross Pft/Cur. LTD > 1?    3.0000
                                           Borrowing Int. Rate < 6%?  1.4469
Stock Performance Tests:
Volatility > 25%?          1.9370          % Held by Insiders < 5%?   3.0000
Beta > 1.25?               0.4480          % Held by Institut. < 50?  0.5907
50 Da MA > 200 Da MA?      0.4878          % Held by Institut. > 30?  2.8217
52-Wk Change vs. S&P 500:  1.5548          Short Ratio > 5?           0.4120
Price/Book Value < 3?      3.0000          Short % of Float > 20?     0.1255
Return on Assets > 17%?    0.3912          Average Volume > 100,000?  3.0000

Cash Flow Tests:
Oper. C.F. > Lever'd C.F: -3.0000          Positive Free Cash Flow?  -1.0000
Positive Oper. Cash Flow?  3.0000          Price to C.F.Ratio < 14?:  2.8962
                                           Cash Flow / Assets > 10%?  3.0000

TGT    Target Corporation                  Overall Zenith Index:      1.2826
Financial Statements |
TARGET CORP (TGT) INCOME STATEMENT Fiscal year ends in January. USD in thousands 2015-01 2016-01 2017-01 2018-01 2019-01 TTM Revenue 72,618,000 73,785,000 69,495,000 71,879,000 75,356,000 77,690,000 Cost of revenue 51,278,000 51,997,000 48,872,000 51,125,000 53,299,000 54,707,000 Gross profit 21,340,000 21,788,000 20,623,000 20,754,000 22,057,000 22,983,000 Operating expenses Sales, General and administrative 14,676,000 14,665,000 13,356,000 14,248,000 15,723,000 16,104,000 Other operating expenses 2,129,000 2,213,000 2,298,000 2,194,000 2,224,000 2,302,000 Total operating expenses 16,805,000 16,878,000 15,654,000 16,442,000 17,947,000 18,406,000 Operating income 4,535,000 4,910,000 4,969,000 4,312,000 4,110,000 4,577,000 Other income (expense) -882,000 13,000 -1,004,000 -666,000 -434,000 -424,000 Income before taxes 3,653,000 4,923,000 3,965,000 3,646,000 3,676,000 4,153,000 Provision for income taxes 1,204,000 1,602,000 1,296,000 718,000 746,000 919,000 Net income from continuing operations 2,449,000 3,321,000 2,669,000 2,928,000 2,930,000 3,234,000 Net income from discontinuing ops -4,085,000 42,000 68,000 6,000 7,000 11,000 Net income -1,636,000 3,363,000 2,737,000 2,934,000 2,937,000 3,245,000 Net income available to common shareholders -1,636,000 3,363,000 2,737,000 2,934,000 2,937,000 3,245,000 Earnings per share Basic -2.58 5.35 4.74 5.36 5.55 6.30 Diluted -2.58 5.31 4.70 5.33 5.51 6.26 Weighted average shares outstanding Basic 634,700 627,700 577,600 546,800 528,600 514,350 Diluted 640,100 632,900 582,500 550,300 533,200 518,650 ____________________________________________________________________________________________________________________________________________ TARGET CORP (TGT) BALANCE SHEET Fiscal year ends in January. USD in thousands 2015-01 2016-01 2017-01 2018-01 2019-01 Assets Current assets Cash Short-term investments 0 0 1,110,000 0 769,000 Total cash 2,210,000 4,046,000 2,512,000 2,643,000 1,556,000 Receivables 1,122,000 779,000 749,000 929,000 1,100,000 Inventories 8,790,000 8,601,000 8,309,000 8,657,000 9,497,000 Deferred income taxes 188,000 0 0 0 0 Prepaid expenses 231,000 214,000 207,000 181,000 157,000 Other current assets 1,546,000 490,000 213,000 154,000 209,000 Total current assets 14,087,000 14,130,000 11,990,000 12,564,000 12,519,000 Non-current assets Property, plant and equipment Gross property, plant and equipment 41,064,000 41,463,000 42,071,000 43,199,000 46,185,000 Accumulated Depreciation -15,106,000 -16,246,000 -17,413,000 -18,181,000 -18,687,000 Net property, plant and equipment 25,958,000 25,217,000 24,658,000 25,018,000 27,498,000 Equity and other investments 322,000 308,000 345,000 383,000 380,000 Goodwill 147,000 133,000 133,000 630,000 633,000 Intangible assets 155,000 144,000 126,000 152,000 66,000 Prepaid pension benefit 0 66,000 43,000 46,000 11,000 Other long-term assets 735,000 264,000 136,000 206,000 183,000 Total non-current assets 27,317,000 26,132,000 25,441,000 26,435,000 28,771,000 Total assets 41,404,000 40,262,000 37,431,000 38,999,000 41,290,000 Liabilities and stockholders' equity Liabilities Current liabilities Short-term debt 91,000 815,000 1,718,000 270,000 1,052,000 Capital leases 0 0 0 0 166,000 Accounts payable 7,759,000 7,418,000 7,252,000 8,677,000 9,761,000 Taxes payable 576,000 1,076,000 729,000 696,000 601,000 Accrued liabilities 1,009,000 1,055,000 1,035,000 1,085,000 902,000 Other current liabilities 2,301,000 2,258,000 1,974,000 2,473,000 2,532,000 Total current liabilities 11,736,000 12,622,000 12,708,000 13,201,000 15,014,000 Non-current liabilities Long-term debt 12,705,000 11,945,000 11,031,000 11,317,000 10,223,000 Capital leases 0 0 0 0 2,004,000 Deferred taxes liabilities 1,321,000 823,000 861,000 713,000 972,000 Pensions and other benefits 151,000 54,000 46,000 41,000 40,000 Other long-term liabilities 1,494,000 1,861,000 1,832,000 2,018,000 1,740,000 Total non-current liabilities 15,671,000 14,683,000 13,770,000 14,089,000 14,979,000 Total liabilities 27,407,000 27,305,000 26,478,000 27,290,000 29,993,000 Stockholders' equity Common stock 53,000 50,000 46,000 45,000 43,000 Additional paid-in capital 4,899,000 5,348,000 5,661,000 5,858,000 6,042,000 Retained earnings 9,644,000 8,188,000 5,884,000 6,553,000 6,017,000 Accumulated other comprehensive income -599,000 -629,000 -638,000 -747,000 -805,000 Total stockholders' equity 13,997,000 12,957,000 10,953,000 11,709,000 11,297,000 Total liabilities and stockholders' equity 41,404,000 40,262,000 37,431,000 38,999,000 41,290,000 ____________________________________________________________________________________________________________________________________________ TARGET CORP (TGT) Statement of CASH FLOW Fiscal year ends in January. USD in thousands 2015-01 2016-01 2017-01 2018-01 2019-01 TTM Cash Flows From Operating Activities Net income 2,449,000 3,321,000 2,669,000 2,928,000 2,930,000 3,234,000 Depreciation & amortization 2,129,000 2,213,000 2,298,000 2,445,000 2,474,000 2,553,000 Deferred income taxes 7,000 -322,000 41,000 -192,000 322,000 296,000 Stock based compensation 71,000 115,000 113,000 112,000 132,000 142,000 Change in working capital 150,000 445,000 -214,000 1,241,000 17,000 256,000 Inventory -512,000 -316,000 293,000 -348,000 -900,000 997,000 Accounts payable 0 0 0 1,307,000 1,127,000 -698,000 Accrued liabilities 777,000 534,000 -543,000 450,000 89,000 126,000 Other working capital -115,000 227,000 36,000 -168,000 -299,000 -169,000 Other non-cash items -367,000 72,000 529,000 389,000 98,000 27,000 Net cash provided by operating activities 4,439,000 5,844,000 5,436,000 6,923,000 5,973,000 6,508,000 Cash Flows From Investing Activities Investments in property, plant, and equipmen -1,786,000 -1,438,000 -1,547,000 -2,533,000 -3,516,000 -3,046,000 Property, plant, and equipment reductions 95,000 28,000 46,000 31,000 85,000 75,000 Acquisitions, net -20,000 1,875,000 0 -518,000 0 0 Other investing activities -215,000 43,000 28,000 -55,000 15,000 14,000 Net cash used for investing activities -1,926,000 508,000 -1,473,000 -3,075,000 -3,416,000 -2,957,000 Cash Flows From Financing Activities Debt issued 1,993,000 0 1,977,000 739,000 0 504,000 Debt repayment -2,159,000 -85,000 -2,641,000 -2,180,000 -281,000 -1,054,000 Common stock repurchased 0 -3,438,000 -3,706,000 -1,046,000 -2,124,000 -1,598,000 Dividend paid -1,205,000 -1,362,000 -1,348,000 -1,338,000 -1,335,000 -1,329,000 Other financing activities 373,000 369,000 221,000 108,000 96,000 70,000 Net cash provided by (used for) financing -998,000 -4,516,000 -5,497,000 -3,717,000 -3,644,000 -3,407,000 Net change in cash 1,515,000 1,836,000 -1,534,000 131,000 -1,087,000 144,000 Cash at beginning of period 695,000 2,210,000 4,046,000 2,512,000 2,643,000 825,000 Cash at end of period 2,210,000 4,046,000 2,512,000 2,643,000 1,556,000 969,000 Free Cash Flow Operating cash flow 4,439,000 5,844,000 5,436,000 6,923,000 5,973,000 6,508,000 Capital expenditure -1,786,000 -1,438,000 -1,547,000 -2,533,000 -3,516,000 -3,046,000 Free cash flow 2,653,000 4,406,000 3,889,000 4,390,000 2,457,000 3,462,000 ____________________________________________________________________________________________________________________________________________
Average to Current P/E Ratios |
              (TGT)     Target Corp.

                               2015    2016    2017    2018    2019

          Annual Earnings:    -2.56    5.31    4.70    5.30    5.51
Average Price During Year:    78.35   73.58   58.15   77.08   88.22

                P/E Ratio:    30.60   13.86   12.37   14.54   16.01

 Average 5-Year P/E Ratio  =  17.48
             Current Price =  124.73

Previous 5 Quarter Earnings:   1.17    1.52    1.53    1.82    1.39

          Current Annualized (Last Four Quarters) Earnings =   4.74
                                                           ________
                                 Average PE / Current PE =     0.66
                                                           --------

                                      ...a number above 1.00 is good
                                                1.00 or below is bad
Financial Ratios |
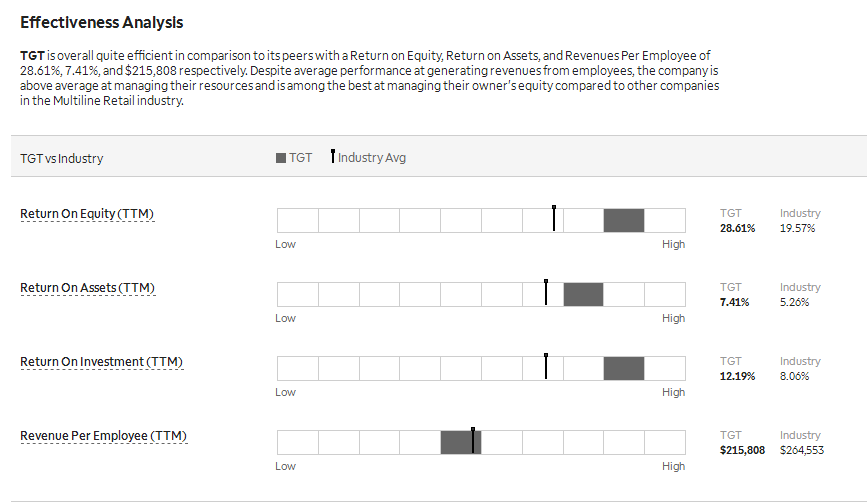
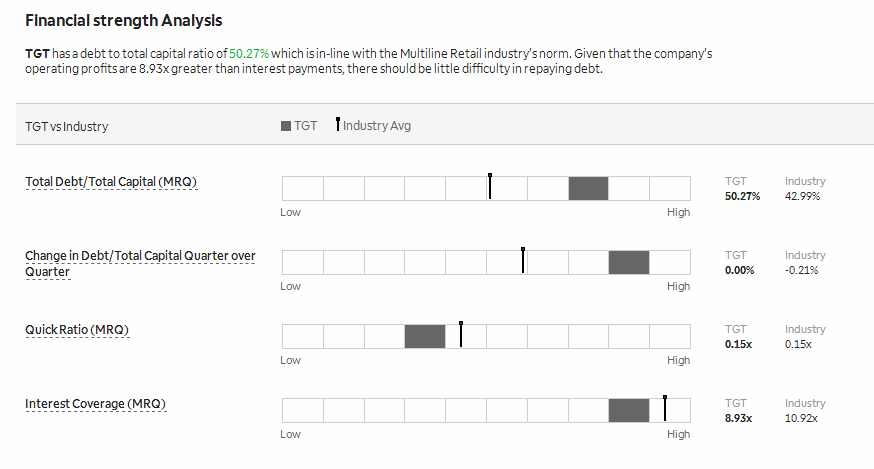
. . . . . . . . . . . . Lowest to Highest, Compared to Industry
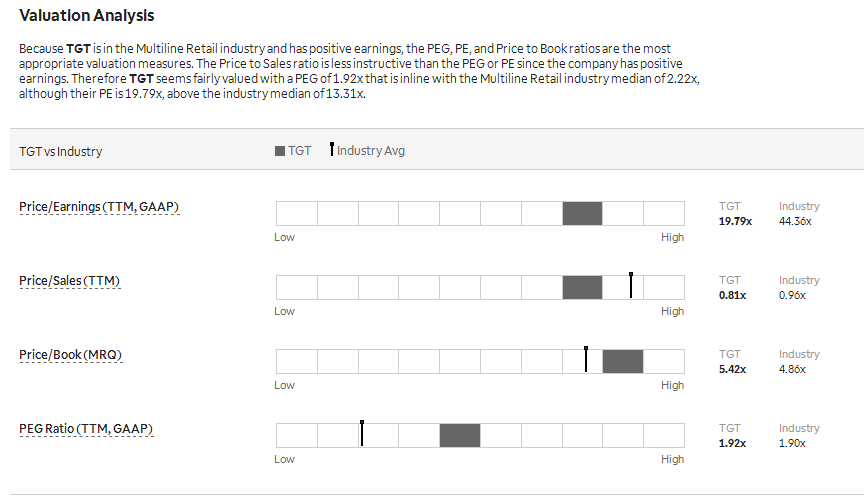
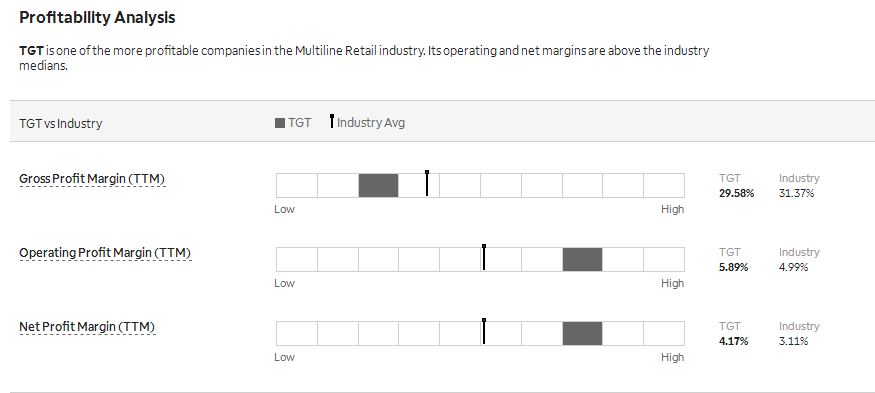
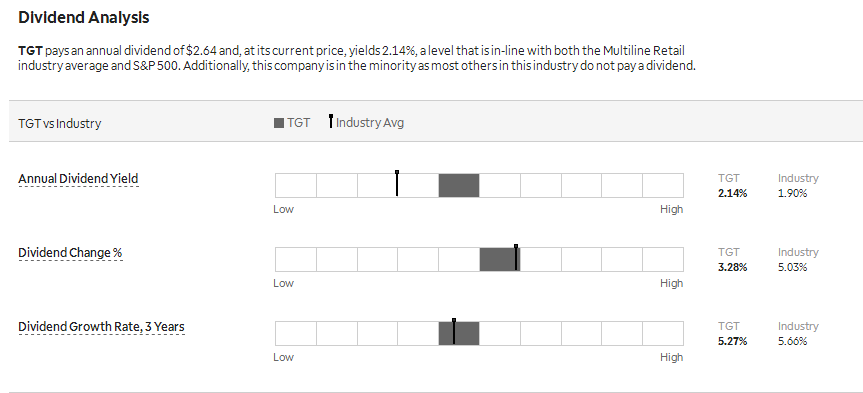
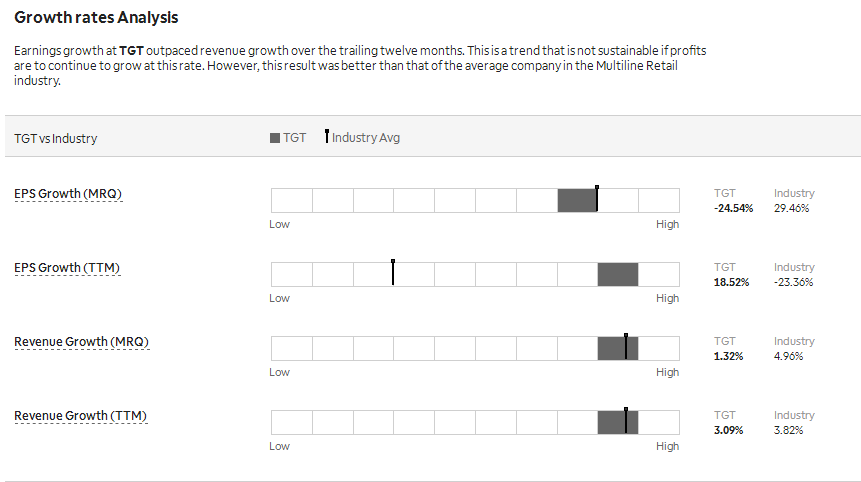
Intrinsic Value (DCF) |
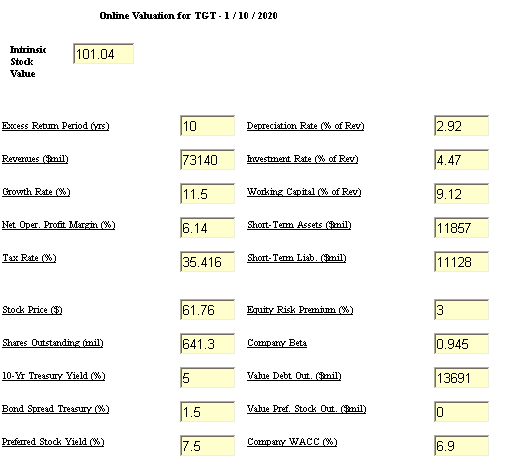
Intrinsic Value by Discounted Cash Flow Method:
Fair Value Estimator |
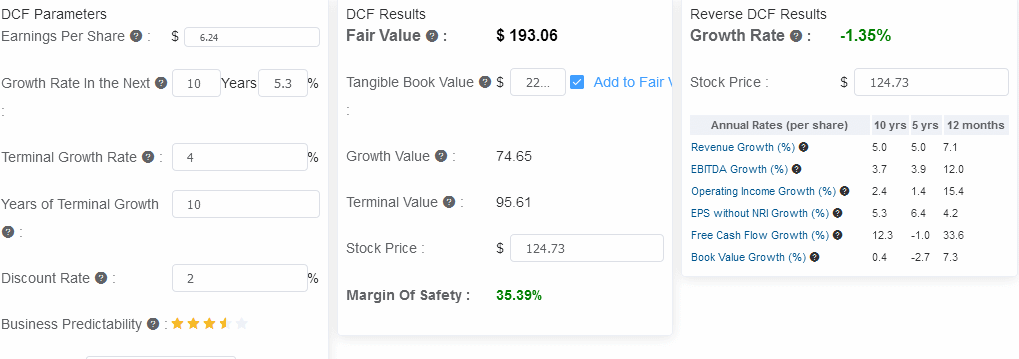
Fair Value Estimate:
Projected Earnings |

Research Reports |
Analysts' Opinions |


Insider Activity |
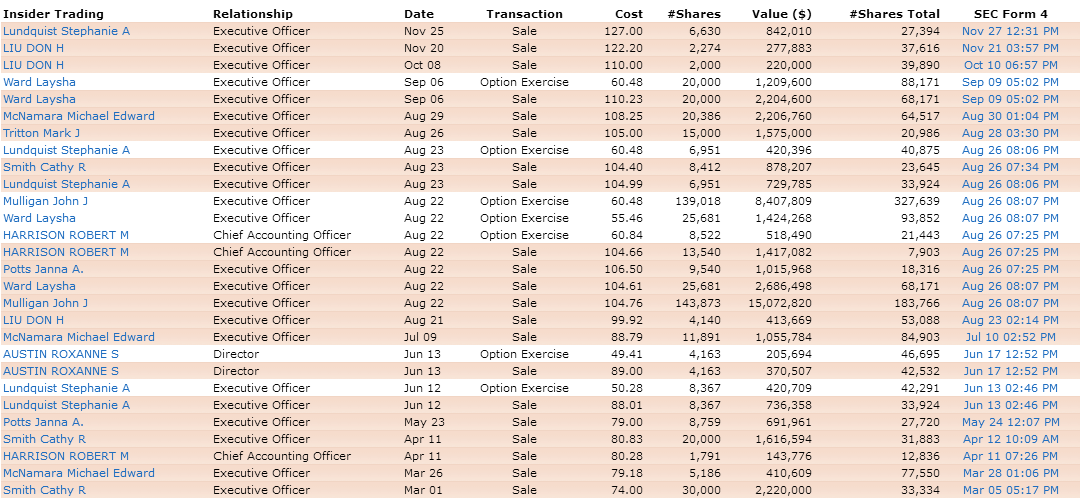
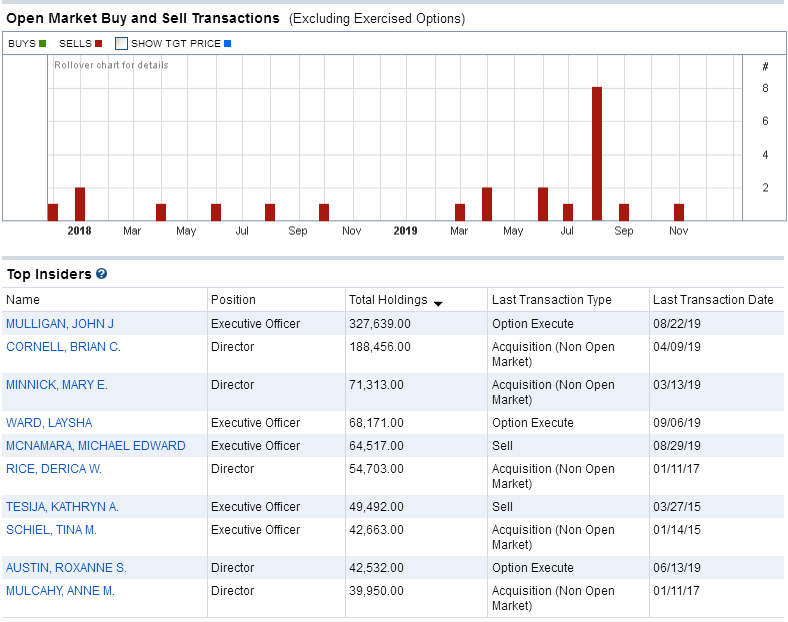
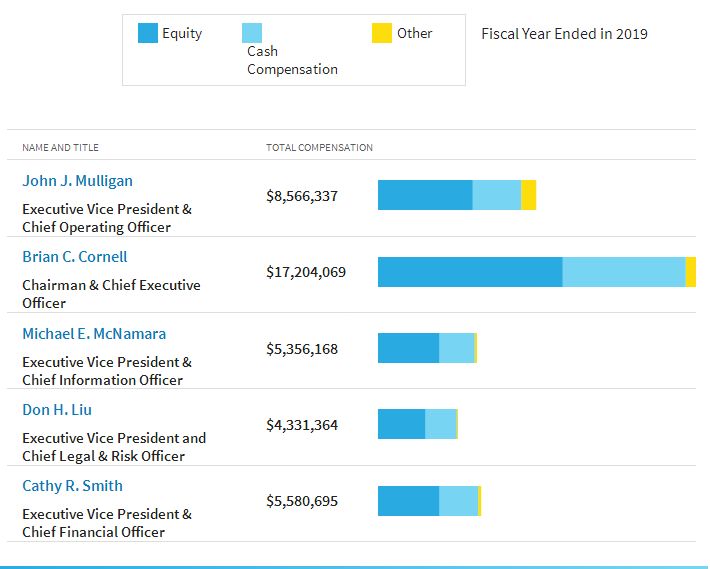
Institutional Activity |
Institutional Ownership:
Sentiment |
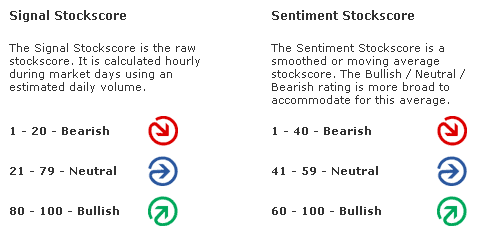
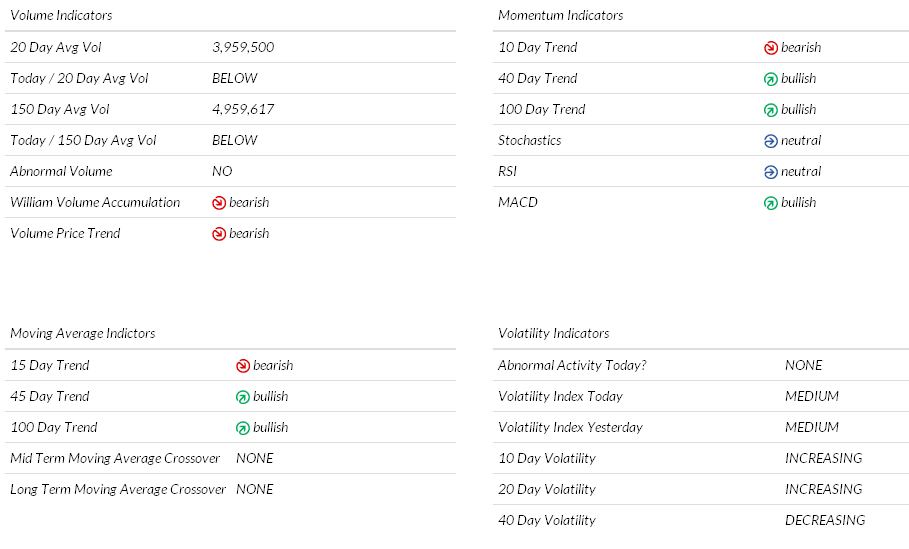
Zenith uses the "sentiment" score above or below 50 to award a positive or negative point in the Decision Matrix.


Short Interest Ratio |
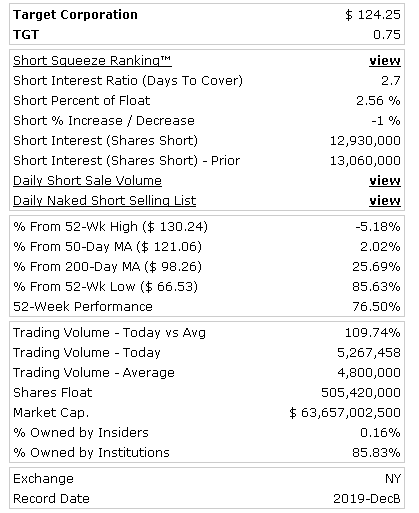
As the short interest rises as a percentage of average daily share volume (Days to Cover), this is considered a measure of negative sentiment. Similarly, a decrease in that percentage is considered positive sentiment.

Standard & Poor's |
Management's Discussion of Results of Operations Excerpts |
Channeling Potential |
The summary below includes a value for `Degree,' which refers on a
scale of 1 to 10 the range of a channel in the period under consi-
deration compared to the total range of price movement. It also looks
for the last closing price to be within the channel, otherwise zeroed.
The `Index' is the `Degree' weighted for volatility.  Generally, the
the higher the index, the more suitable is the stock for trading as
a `rolling stock' between channel high and low points.

Results for TARGET CORPORATION:
Symbol? TGT
Total Months Available:  25
       Months in Cycle?   4

Months Covered by Periods:  12

Period 1           Period 2          Period 3
   H1      L1        H2      L2        H3      L3
  83.65   66.53    110.94   70.03    130.24  104.01

RANGE   = 130.24  TO   66.53            Close = 123.76
CHANNEL = 104.01  TO   83.65           Degree =   3
Volatility =  16.45%                    Index =   4
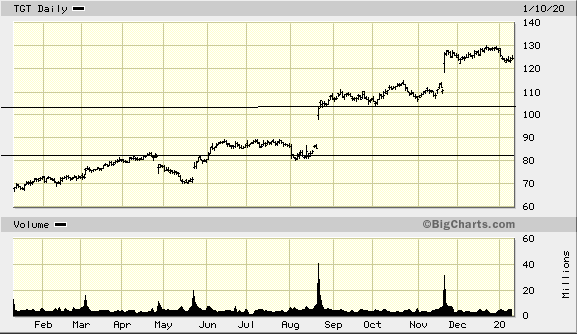
MACD Histogram Divergence |
The theory is that connecting the two most recent peaks or valleys of the MACD histogram will signal the direction of the next major move.
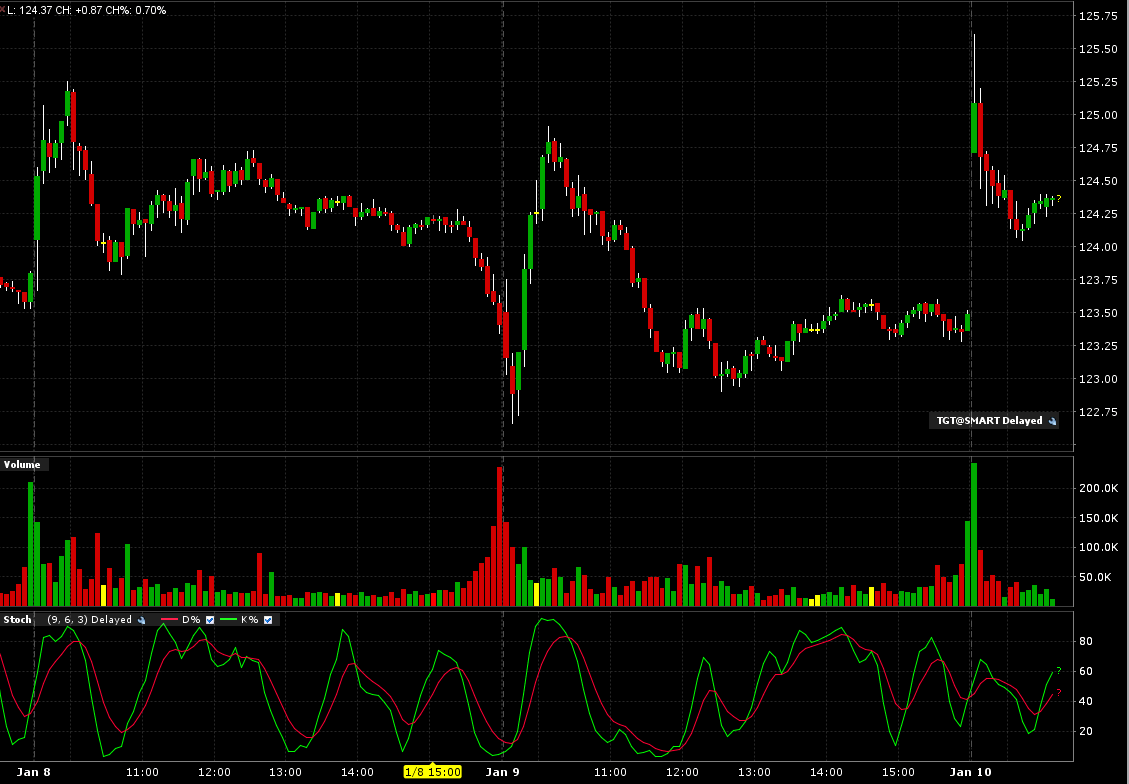
Intraday Chart |
2 Days:
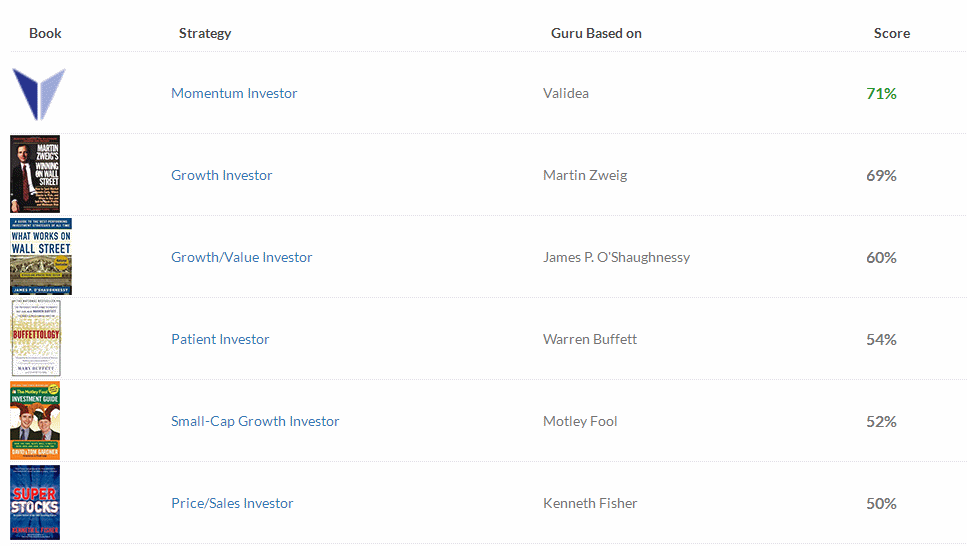
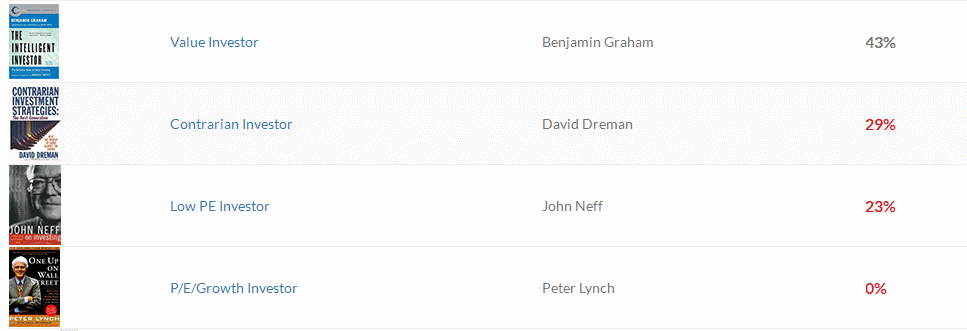
Val Idea |
6 out of 10 favorable, (positive opinion.)
Stock Consultant |
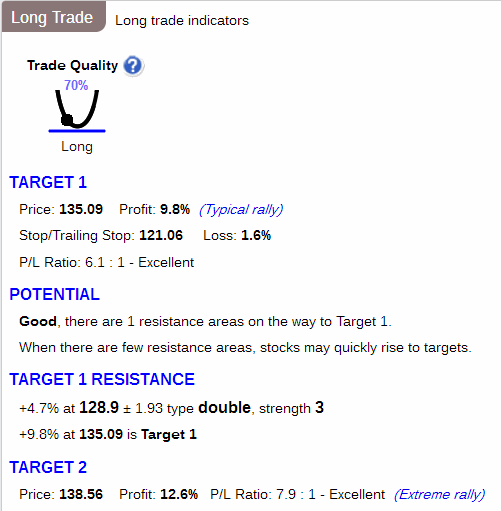
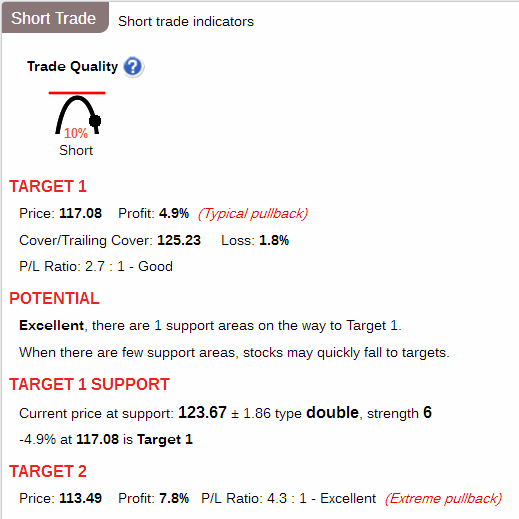
Point & Figure Chart |
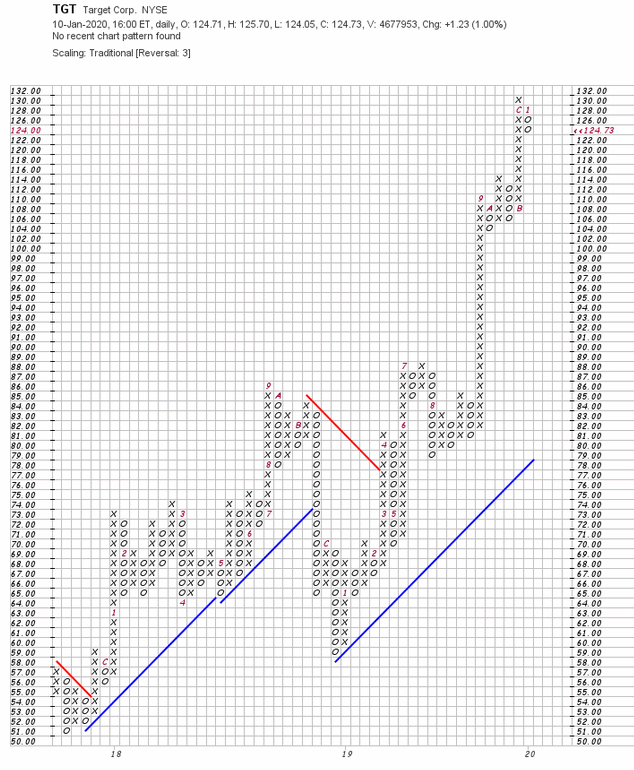
Wall Street Analyzer |
Marketspace Chart |
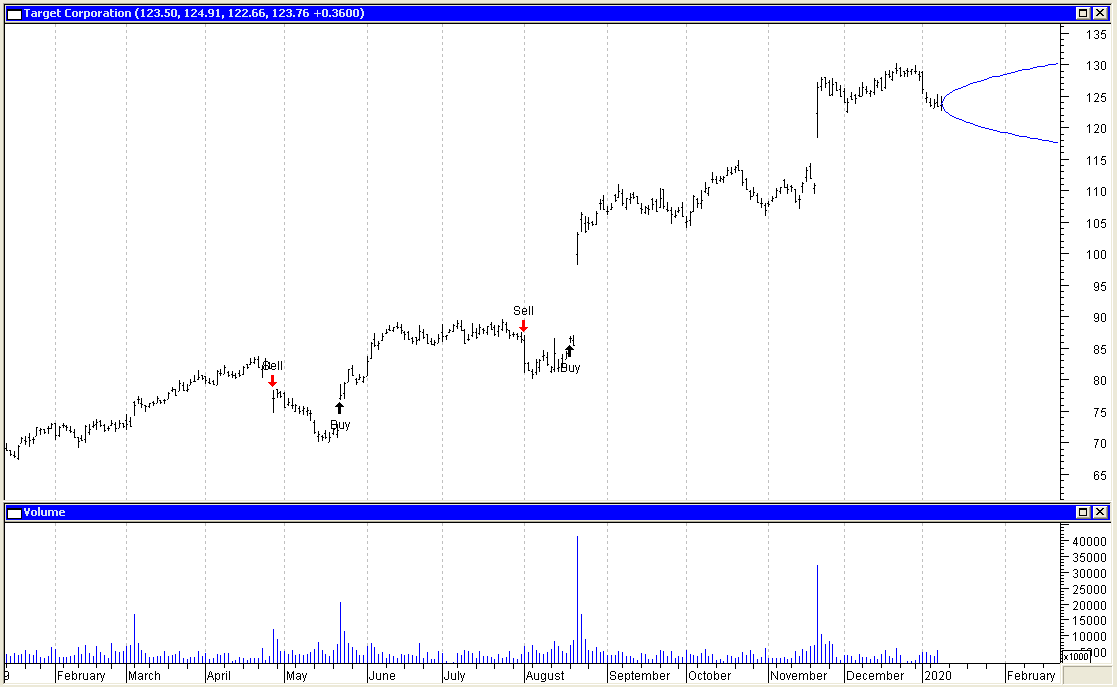
Time Series Forecast |
Neural Network Prediction |
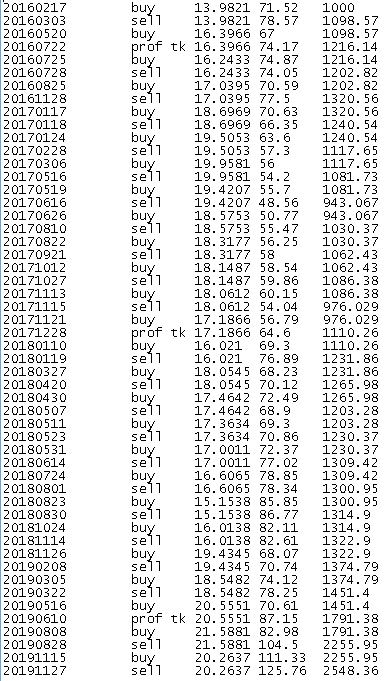
"Neurostock" can only track long trades. Therefore its performance, as tracked by itself on stocks which are consistently falling, may not appear as good as it could if each "sell" signal were a "short sale."

![]()

Ultimate Trading Systems |
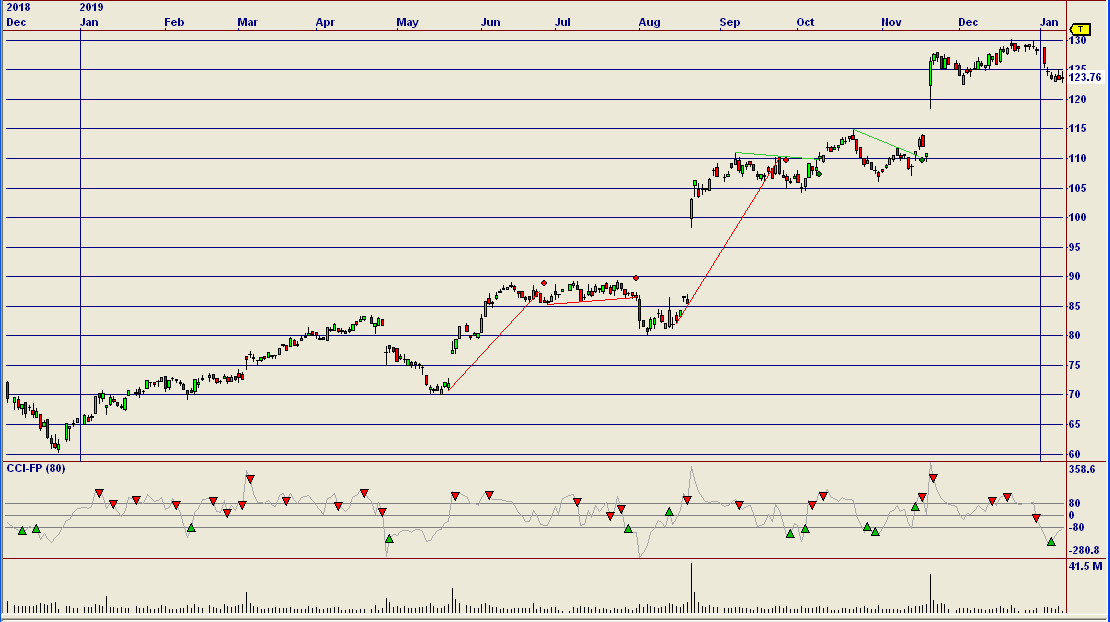
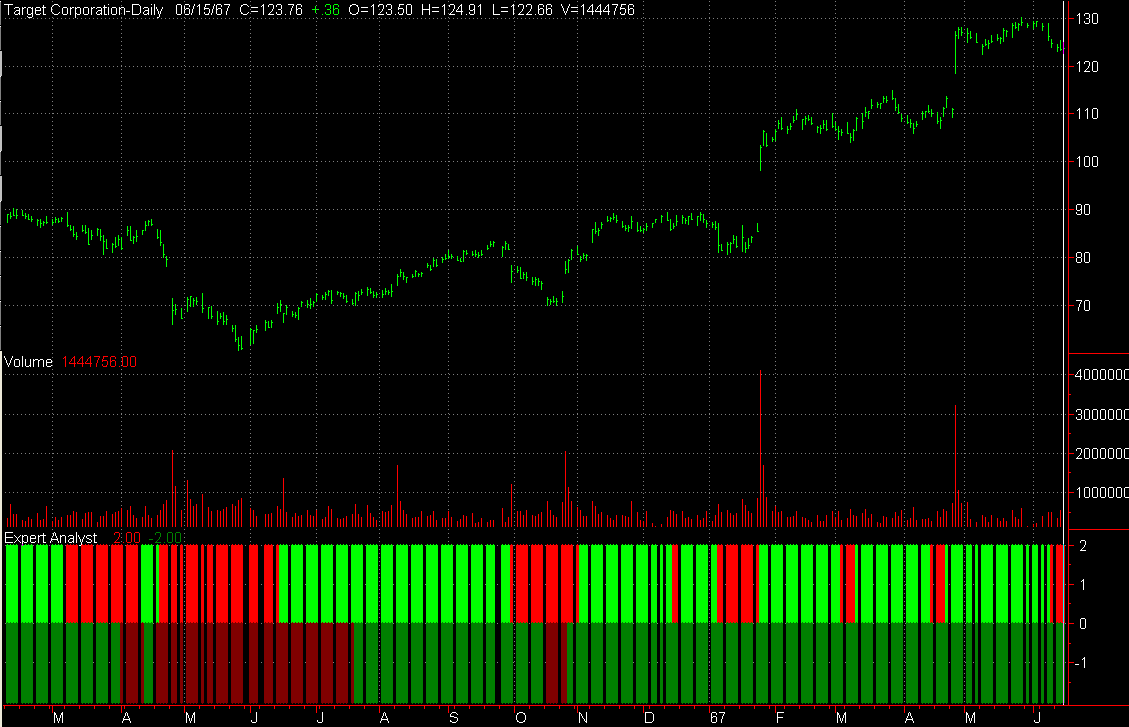
2 out of 3 of the ultimate systems favor a downmove.
System Below:
Short term outlook: Positive: Bright Green, Negative: Bright Red
Long term outlook: Postive: Dark Green, Negative: Dark Red.

Recommendation |
| Factors | Weighted Points |
|---|---|
| News | + 1 |
| Comparison | - 1 |
| Industry | - 1 |
| Bond Issue | + 1 |
| Zenith Index | + 1 |
| Non-GAAP vs. GAAP Earnings | - 1 |
| Cash Flow | + 1 |
| Average to Current P/E | - 1 |
| Ratios | + 1 |
| Intrinsic Value DCF | + 1 |
| Fair Value Estimator | + 1 |
| Projected Earnings | + 1 |
| Research Reports | + 1 |
| Analysts | + 1 |
| Executive Perquisites | - 1 |
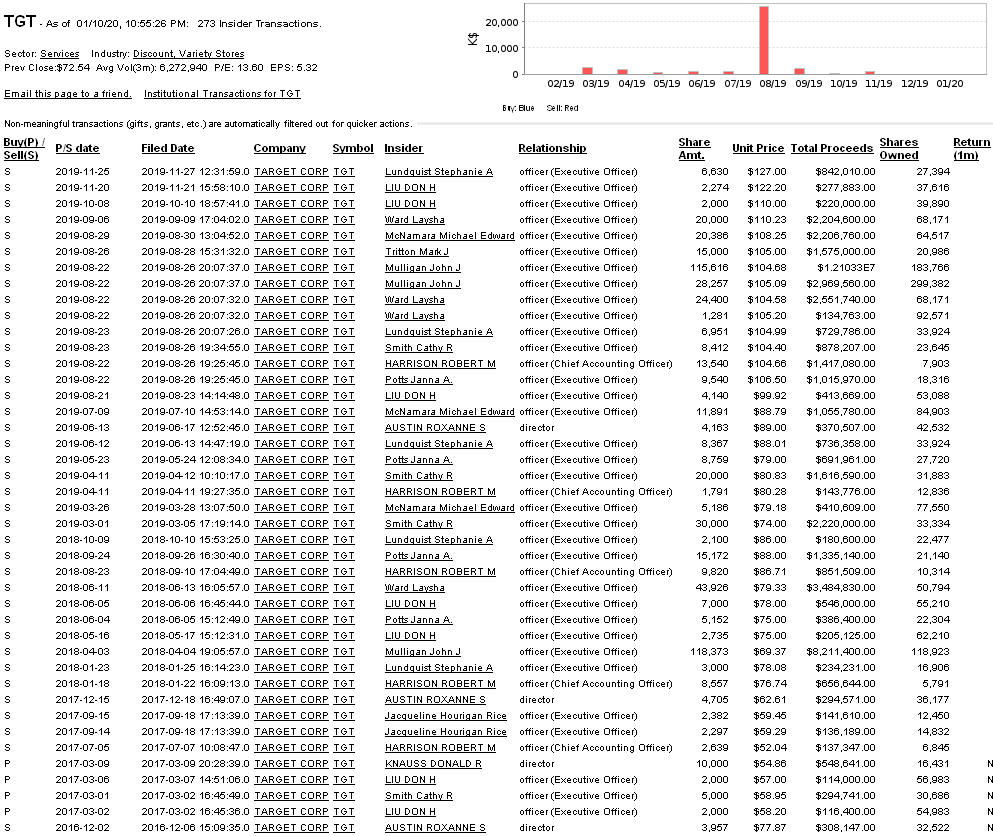
| Insider Activity | - 1 |
| Institutional Activity | - 1 |
| Management Reporting | + 1 |
| Short Interest | + 1 |
| Sentiment | + 1 |
| Standard & Poor's | - 1 |
| MACD Histogram Divergence | - 1 |
| Val Idea | + 1 |
| Stock Consultant | + 1 |
| Point & Figure | + 1 |
| Wall Street Analyzer | - 1 |
| Marketspace Chart | + 1 |
| Time Series Chart | + 1 |
| Neural Network | - 1 |
| Stock Options | + 1 |
| Ultimate Trading Systems | - 1 |
| Total | + 7 |
Place 245 shares of Target Corporation (TGT) on the Active List.