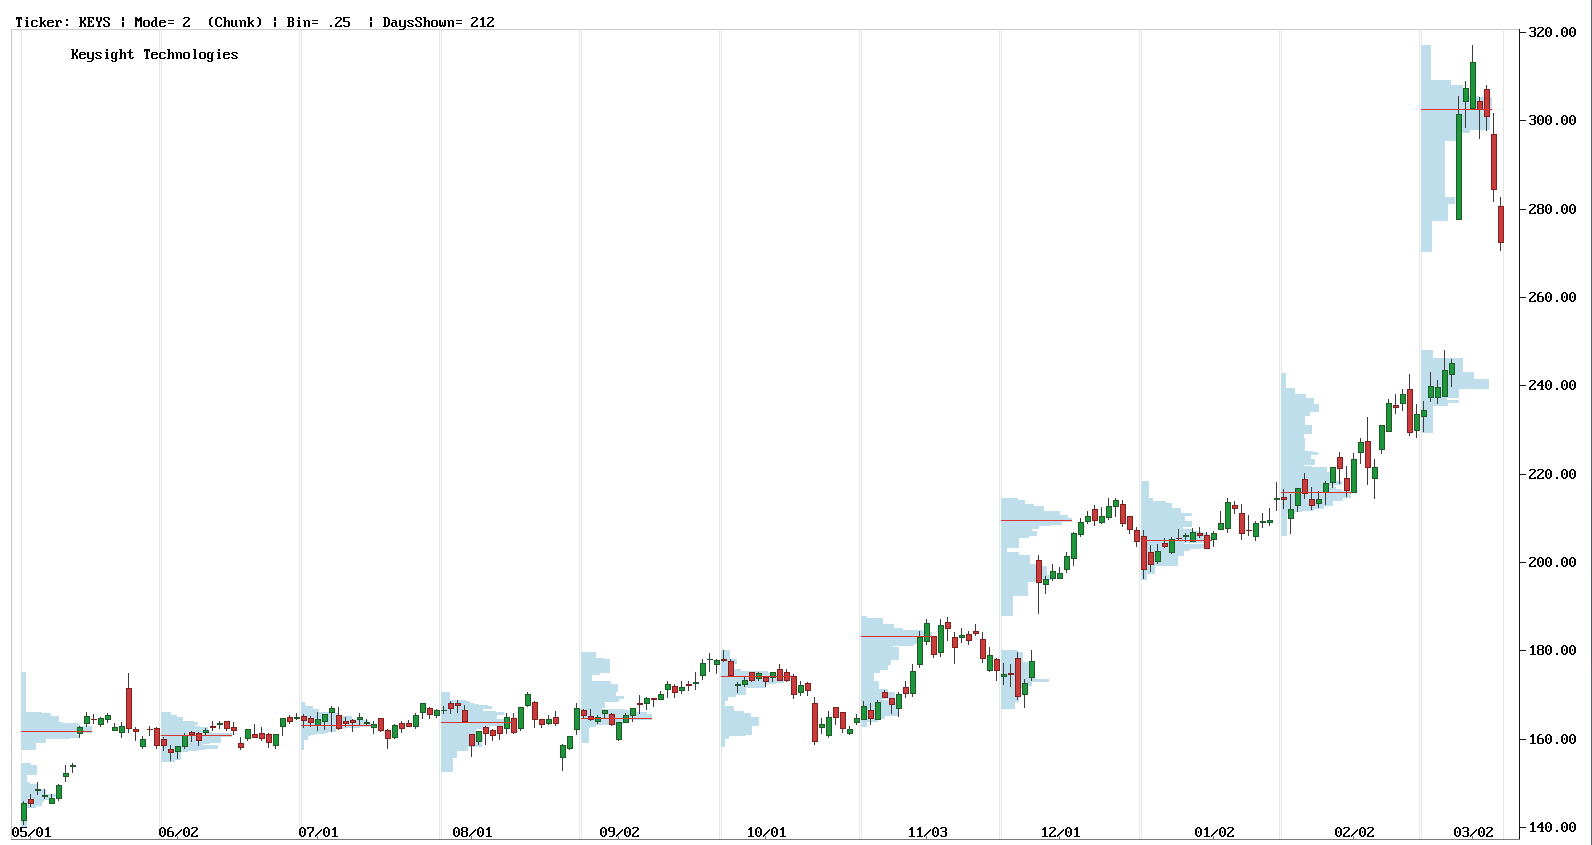
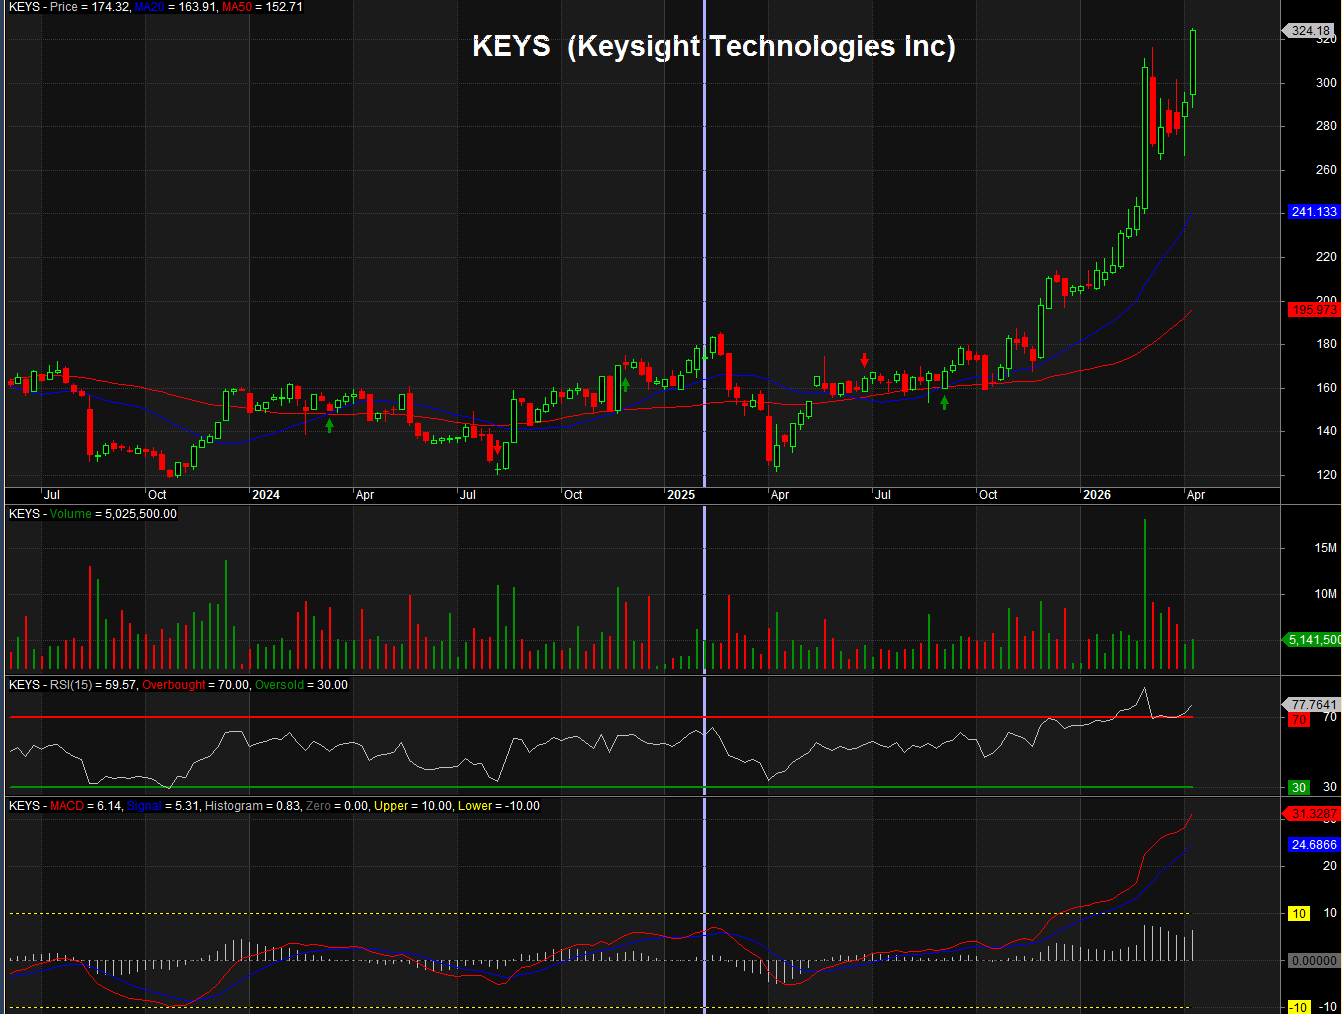
04-15-2026: Keysight Technologies (KEYS): Artificial Intelligence Periphery

Description of Company |
▓ Company & Business Overview....

What the company actually does (important context)

Keysight is not a pure AI company. It sells:

Electronic testing/measurement equipment
Software for validating chips, networks, data centers
Critical tools for semiconductors, 5G/6G, defense, and AI infrastructure

Translation:
It's a “picks-and-shovels” supplier to AI, not AI itself.

Financial Strength (Strong overall)
Growth & profitability
Revenue ~ $5.38B (2025), +8% YoY

Q1 2026:

Revenue ~$1.6B (+23% YoY)

EPS beat expectations ($2.17 vs $2.00)

Expected EPS growth ~ 16–18%

Interpretation:

Solid double-digit earnings growth
Strong operating leverage
Business accelerating again after a softer 2024
Demand drivers (very important)
AI data centers
Semiconductors
6G / high-speed networking
Defense & aerospace

The company reported record orders and backlog driven by these sectors

Balance sheet / capital
Strong institutional ownership (~85%)

Active share buybacks ($1.5B authorization)

Translation: financially solid, not distressed.

Strengths (Bull case)
1. “AI infrastructure” leverage (quiet winner)

Keysight benefits indirectly from AI growth:

AI chips must be tested
High-speed interconnects need validation
Data centers require signal integrity tools

This is a high-margin, mission-critical niche

2. High switching costs / moat

Customers (chipmakers, telecoms, defense):

Depend on precision tools
Can't easily switch vendors

Sticky revenue, recurring demand

3. Strong recent momentum
Stock up sharply (40%+ YTD at one point)

Hitting new highs recently

Market is rewarding the story

4. M&A + software shift
Acquisitions expanding into software + simulation

Higher margins long-term

Weaknesses / Risks (Bear case)
1. Valuation risk (big one)
PEG ratio ~2.2 (expensive)

Some models say overvalued by ~60%

Other estimates: 20%+ overvalued after rally

This is the main problem right now

2. Cyclical exposure

Depends on:

Semiconductor capex
Telecom spending
Industrial cycles

If chips or telecom slow → KEYS slows

3. Not a “pure AI winner”
Growth tied to infrastructure cycles
Not exponential like Nvidia-type companies

More steady, less explosive upside

4. Price already ran hard
Near / at 52-week highs
Some analyst targets below current price

Risk of pullback or consolidation

Analyst sentiment
Mostly Buy / Strong Buy ratings
But price targets often lag current price

Translation:

Analysts like the business
But think the stock may be ahead of itself
Bottom line (what it really is)
Financial strength: Strong
Profitable
Growing double digits
Strong demand pipeline
Stock attractiveness: Mixed / timing-sensitive

Bull case (BUY if):

You want AI infrastructure exposure without hype
You expect continued semiconductor + data center boom
You're investing long-term

Bear case (WAIT / TRIM if):

You care about valuation discipline
You're buying after a big run-up
You expect a tech spending slowdown

Business quality: very strong
Stock at current price: borderline expensive
Action bias:
Long-term investor: reasonable BUY on pullbacks
Short-term / value-minded: HOLD or wait
Corporate Website Excerpts |


News Items |


More Charts |
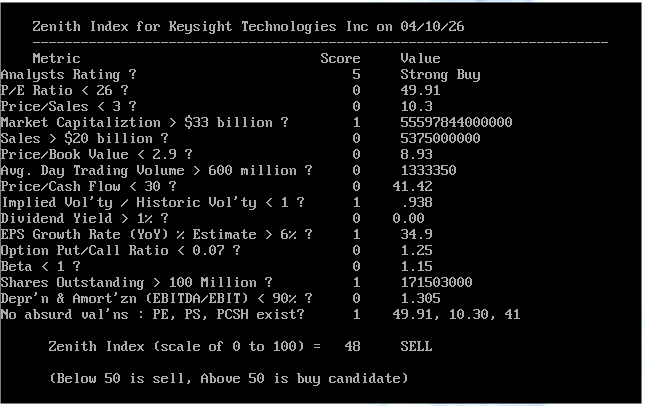
Zenith Index
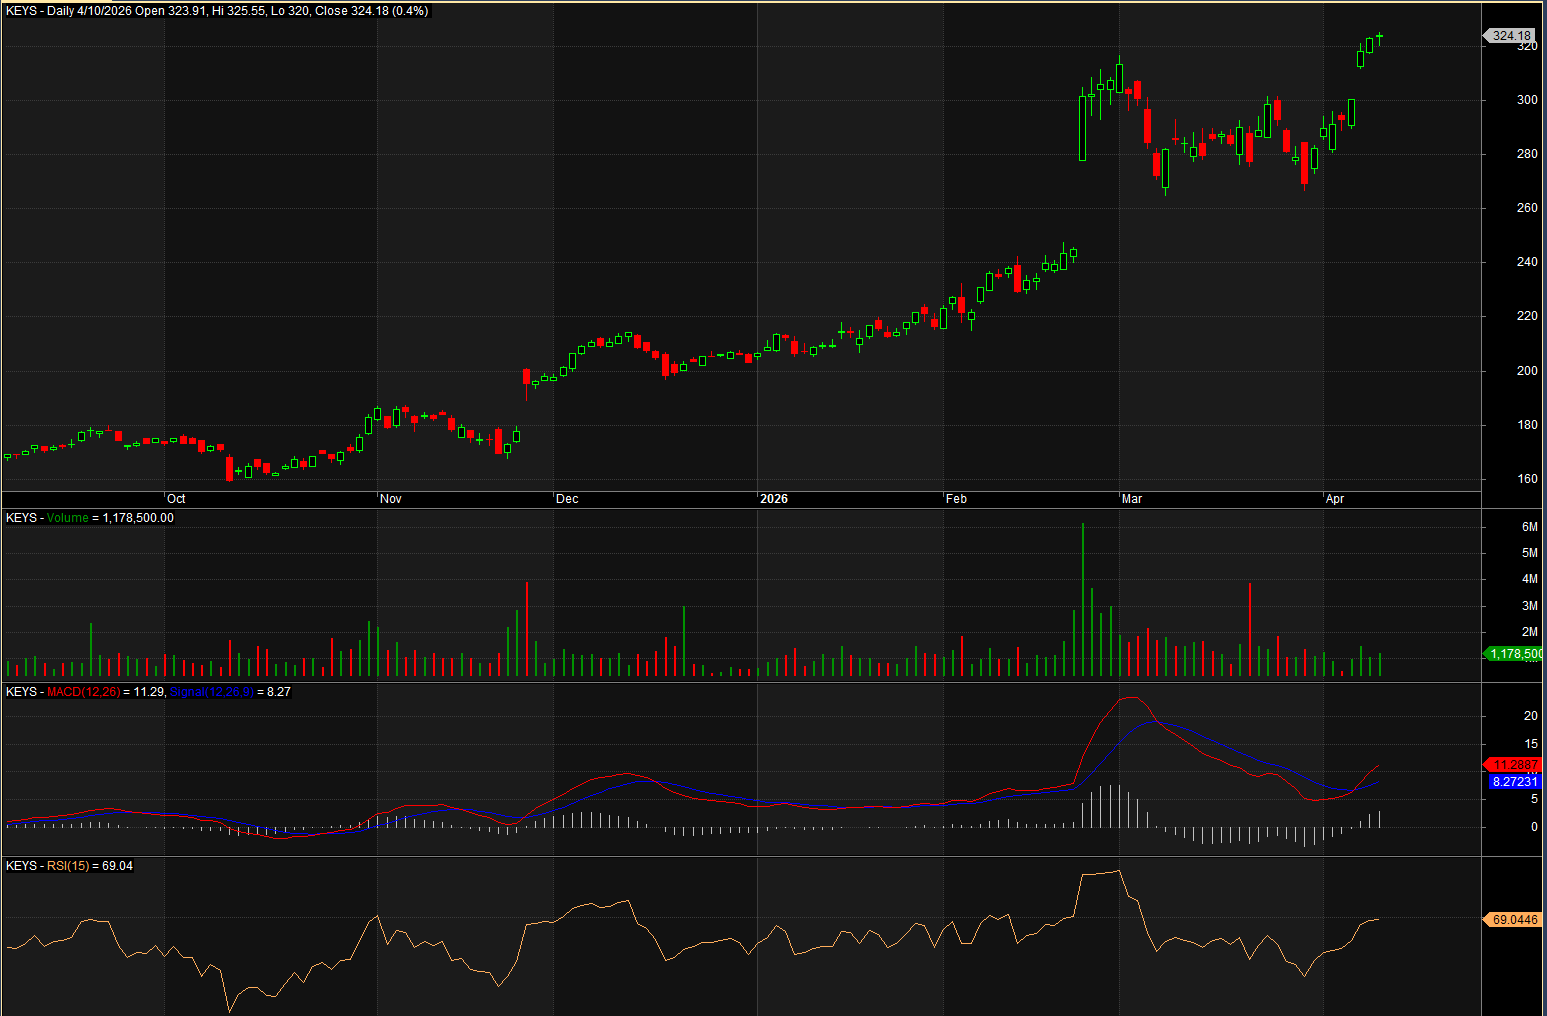
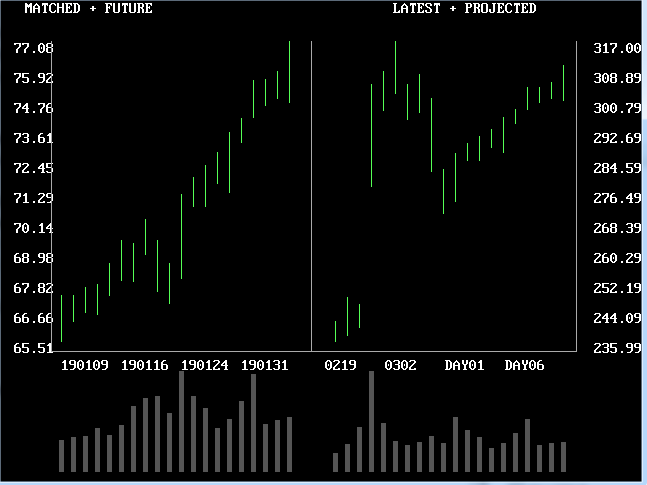
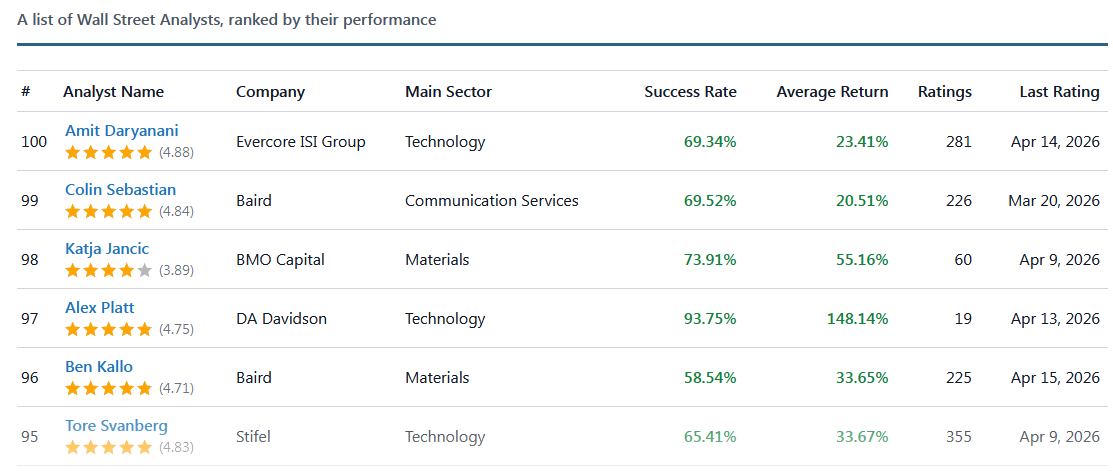
More evidence of being "over-priced" and perhaps to wait a bit before buying. Management's Discussion: Results of Operations Analysts' Ratings
Below is an interim report on a portion of Zenith's First Quarter covering 01-02-2026 to 02-19-2026. We commit around $30,000 per stock and do not compound investments so share alotments stay constant. Reports are made at odd intervals and trades closed out at the end of each quarter starting with March 31st, then given a fresh start each quarter with new cumulative totals and previous totals out.
02-05-2026: Bunge Ltd. (BG): Stronger Through Recent Acquisition
12-08-2025: Chefs Warehouse (CHEF): Wholesale or Retail?
11-07-2025: J.B. Hunt Transport Services (JBHT): Billion Dollar Buyback
11-05-2025: Helix Energy Solutions Group (HLX): New Gulf of America Contract
11-04-2025: AMC Networks Inc. (AMCX): Declining Streaming Customer Base
10-31-2025: Zoom Communications, Inc. (ZM): Free Meeting Rooms Lead to Upscale Add-Ons
10-20-2025: Snowflake Inc. Cl A (SNOW): Understanding What They Do Is Difficult
09-12-2025: Taylor Morrison Home Corp. (TMHC): Real Estate Housing Price Cycle Peaking?
08-27-2025: Axalta Coating Systems Ltd. (AXTA: Protective Coatings are a Big Business
08-07-2025: Vodafone Group PLC ADR (VOD): Connecting the World
08-01-2025: MotorCar Parts of America (MPAA): Small Cap Heading Toward Big Cap
07-28-2025: Plantir Technologies Inc. CL A (PLTR) Another "Dot".Com Era" Lookalike?
05-25-2025: Why Most Seniors Have a Short Lifespan After 80 and 5 Secrets to Living Beyond
04-30-2025: Plan to Insulate Manipulated U.S. Markets
04-27-2025: How Fools Become World's Most Powerful Leaders
10-25-2024: W D 40 Company: Swing Tradeable?
10-19-2024: Centrus Energy, Inc. (LEU): World's Only Publicly Held Nuclear Fuels Processor
10-11-2024: Pennant Investment Corp.: 7 % Per Annum Paid Out Monthly
Overview and Executive Summary
Keysight Technologies, Inc., incorporated in Delaware on December 6, 2013, is a global innovator in the computing, communications and electronics markets, committed to advancing our customers' business success by helping them solve critical challenges in the development and commercialization of their products and services. Our mission, “accelerating innovation to connect and secure the world,” speaks to the value we provide our customers in a world of ever-increasing technological complexity. We deliver this value through a broad range of design and test solutions that address the critical challenges our customers face in bringing their innovations to market on ever-shorter schedules.

Our fiscal year end is October 31. Unless otherwise stated, all years and dates refer to our fiscal year.
Acquisitions of Spirent Communications plc, Synopsys' Optical Solutions Group, and Ansys' PowerArtist RTL Business
On October 15, 2025, we acquired all of the outstanding common stock of Spirent Communications plc (“Spirent”) for $1,415 million, net of $127 million cash acquired, using existing cash. On October 16, 2025, Keysight divested Spirent's high-speed ethernet, network security, and channel emulation business lines for $399 million to Viavi Solutions Inc. (“Viavi”) in connection with satisfying the regulatory conditions set out as part of the Spirent acquisition. For the year ended October 31, 2025, our acquisition of Spirent resulted in incremental revenue of $9 million. In our discussion of changes in our results of operations, we have qualitatively disclosed the impact of the Spirent acquisition.

On October 17, 2025, we acquired the Optical Solutions Group business (“OSG”) from Synopsys, Inc. (“Synopsys”) and the PowerArtist RTL business (“PowerArtist”) from Ansys, Inc. (“Ansys”) for $578 million and $26 million, respectively. For the year ended October 31, 2025, the acquisitions had an immaterial impact on our revenue.

Impact of U.S. government tariffs
Beginning in the second quarter of fiscal 2025, the U.S. government announced tariffs on products from most countries and additional reciprocal tariffs on certain countries. In response, China and other countries announced retaliatory tariffs against certain imports from the United States. There have been recent changes effective August 1, 2025, resulting in broad-based increases in tariff rates, and there has been continuing litigation in the federal courts regarding the validity of the imposition of certain tariffs. These tariffs have impacted our financial results for the year ended October 31, 2025. We have taken actions across multiple vectors to reduce the impact on our results of operations. This multipronged mitigation approach spans our global manufacturing footprint and sourcing strategies, as well as pricing and cost actions.

Years ended October 31, 2025, 2024, and 2023
Orders were $5,452 million, $5,033 million, and $5,190 million in 2025, 2024, and 2023, respectively. Orders of $5,452 million for 2025 increased 8 percent compared to 2024. Acquisitions had a favorable impact of 1 percentage point on the increase, while foreign currency movements had an immaterial impact. Orders grew across all regions. Orders of $5,033 million for 2024 decreased 3 percent compared to 2023. Acquisitions had a favorable impact of 4 percentage points on the change, while foreign currency movements had an immaterial impact. Orders declined in the Americas and Asia Pacific, while Europe was flat.

Revenue was $5,375 million, $4,979 million, and $5,464 million in 2025, 2024, and 2023, respectively. Revenue of $5,375 million for 2025 increased 8 percent compared to 2024. Acquisitions and foreign currency movements had an immaterial impact on the change. Revenue increased in both the Communications Solutions Group (“CSG”) and the Electronic Industrial Solutions Group (“EISG”). Revenue from CSG and EISG represented approximately 69 percent and 31 percent, respectively, of total revenue for 2025. Revenue of $4,979 million for 2024 decreased 9 percent compared to 2023. Acquisitions had a favorable impact of 3 percentage points on the change, while foreign currency movements had an immaterial impact. Revenue declined in both CSG and EISG. Revenue from CSG and EISG represented approximately 69 percent and 31 percent, respectively, of total revenue for 2024.

Net income was $850 million, $614 million, and $1,057 million in 2025, 2024, and 2023, respectively. Net income of $850 million for 2025 increased 38 percent compared to 2024, primarily driven by higher revenue and net gains on equity investments and derivative instruments and lower income tax provisions, partially offset by higher people-related costs, higher acquisition and integration costs, impact of tariffs, and loss from discontinued operations, net of income taxes. Net income of $614 million for 2024 decreased 42 percent compared to 2023, primarily driven by lower revenue and higher acquisition and integration costs, restructuring costs, and amortization of acquisition-related balances, partially offset by lower provision for income taxes, favorable gross margin impact from the ESI Group acquisition, and lower people-related costs.
Cash flows generated from operating activities were $1,409 million, $1,052 million, and $1,408 million in 2025, 2024, and 2023, respectively.

Outlook
Our first-to-market solutions strategy enables customers to develop new technologies and accelerate innovation and provides a platform for Keysight's long-term growth. Our customers are expected to continue to make R&D investments in certain next-generation technologies and applications, including evolution of 5G, early 6G, high-speed data center networks and infrastructure, satellite networks, artificial intelligence (“AI”), industrial internet of things (“IoT”), defense modernization, and next generation electric vehicles and autonomous vehicles. We continue to engage actively with our customers and closely monitor the macroeconomic environment, including tariffs, trade restrictions and tightening of export control regulations, monetary and fiscal policies, and geopolitical tensions. We remain confident in the long-term secular growth trends of our markets and our ability to outperform in a variety of market conditions.

Currency Exchange Rate Exposure
Our revenues, costs and expenses, and monetary assets and liabilities are exposed to changes in foreign currency exchange rates due to our global operating, investing, and financing activities. We hedge revenues, expenses, and balance sheet exposures that are not denominated in the functional currencies of our subsidiaries on a short-term and anticipated basis. The result of these hedging activities are included in our consolidated balance sheet and consolidated statement of operations. We may experience some fluctuations within individual lines of the consolidated balance sheet and consolidated statement of operations because our hedging program is not designed to offset the currency movements in each category of revenues, expenses, monetary assets and liabilities. Our cash flow hedging program is designed to hedge short-term currency movements based on a rolling period of up to twelve months. Therefore, we are exposed to currency fluctuations over the longer term. To the extent that we are required to pay for all, or portions, of an acquisition price in foreign currencies, we may enter into foreign exchange
contracts to reduce the risk that currency movements will impact the U.S. dollar cost of the transaction.

Gross Margin, Operating Margin, and Income Before Taxes
Gross margin decreased 1 percentage point in 2025 compared to 2024, primarily driven by the impact of tariffs and unfavorable mix, partially offset by favorable pricing, higher revenue volume, and lower restructuring costs. Gross margin decreased 2 percentage points in 2024 compared to 2023, primarily driven by lower revenue volume, higher amortization of acquisition-related balances, and higher restructuring costs, partially offset by lower material costs, favorable gross margin impact from the ESI Group acquisition, and lower variable people-related costs.
Excess and obsolete inventory charges were $43 million in 2025, $35 million in 2024, and $27 million in 2023.
R&D expense increased 10 percent in 2025 compared to 2024, primarily driven by continued investments in key growth opportunities in our end markets and leading-edge technologies, higher variable people-related costs, and incremental costs from acquired businesses. We continued to prioritize investments prudently in strategic growth areas and advanced technologies. R&D expense increased 4 percent in 2024 compared to 2023, primarily driven by incremental costs from acquired businesses, partially offset by lower variable people-related costs.
Selling, general and administrative expenses increased 6 percent in 2025 compared to 2024, primarily driven by higher acquisition and integration costs, people-related costs, travel costs, and incremental costs from acquired businesses, partially offset by lower infrastructure costs and amortization of acquisition-related balances. Selling, general and administrative expenses increased 7 percent in 2024 compared to 2023, primarily driven by higher acquisition and integration costs, incremental costs from acquired businesses, and higher amortization of acquisition-related balances, partially offset by lower people-related, marketing, and infrastructure costs resulting from the flexibility of our operating model and cost efficiency measures.
Other operating expense (income) was income of $20 million, $14 million, and $15 million for 2025, 2024, and 2023, respectively, and primarily includes property rental income.
Operating margin was flat in 2025 compared to 2024, as declines in gross margin were offset by lower operating expenses as percentage of sales. Operating margin decreased 8 percentage points in 2024 compared to 2023, primarily driven by higher selling, general and administrative and R&D expenses on lower revenue coupled with declines in gross margin.

Interest income for 2025, 2024, and 2023 was $102 million, $81 million, and $102 million, respectively, and primarily related to interest earned on our cash balances. The increase in interest income in 2025 compared to 2024 was primarily driven by increase in year-over-year cash balances. The decline in interest income in 2024 compared to 2023 was primarily driven by decline in year-over-year cash balances. Interest expense for 2025, 2024, and 2023 was $96 million, $84 million, and $78 million, respectively, and primarily related to interest on our debt instruments. See Note 11, “Debt,” for additional information.
Other income (expense) was income of $200 million, $35 million, and expense of $25 million, for 2025, 2024, and 2023, respectively. The increase in net other income for 2025 compared to 2024 was primarily driven by net gains on equity investments, gains on derivative instruments and lower amortization of actuarial losses. The increase in net other income for 2024 compared to 2023 was primarily driven by gains on derivative instruments and higher net gains on equity investments, partially offset by an increase in pension costs due to higher interest cost on benefit obligations.

Our headcount was approximately 16,800 as of October 31, 2025, compared to approximately 15,500 as of October 31, 2024. The increase was primarily driven by acquisitions.

Provision for Income Taxes
effective tax rate	20 	%		29 	%		22 	%
The effective tax rate was 20 percent, 29 percent, and 22 percent for 2025, 2024, and 2023, respectively.
The tax rate in 2025 was lower than the U.S. statutory rate, primarily due to a lower effective tax rate on foreign earnings and the utilization of foreign tax credits, partially offset by U.S. taxes on Global Intangible Low Taxed Income (“GILTI”) inclusion, and the impact of Pillar Two minimum taxes.

In July 2025, the One Big Beautiful Bill Act (“OBBBA”) was enacted into law in the U.S. The OBBBA includes numerous provisions that affect corporate taxation, including changes to bonus depreciation, the expensing of domestic research costs, and modifications to certain U.S. international tax rules. The company has analyzed the impacts of the OBBBA and reflected them in the current period. These impacts do not have a material effect on the tax rate for the year ended October 31, 2025. The majority of the tax law changes will take effect in future years.
The Organization for Economic Cooperation and Development (“OECD”) reached agreement among certain member countries to implement a global minimum tax framework, commonly referred to as Pillar Two, which established a minimum 15 percent income tax rate. Various countries have passed legislation to comply with the Pillar Two model rules. A subset of these rules became effective for Keysight in the current fiscal year. While we expect to meet transitional safe harbor requirements in most jurisdictions, there are a limited number of jurisdictions where we expect Pillar Two taxes to apply. The income tax provision for the year ended October 31, 2025 includes the effects of Pillar Two taxes, resulting in a tax expense of $13 million.
The decrease in the effective tax rate of 9 percentage points from 2024 to 2025 was primarily due to the absence of the 2024 one-time income tax items in 2025, partially offset by the increase of taxes on the impact of Pillar Two minimum taxes.

The tax rate in 2024 was higher than the U.S. statutory rate primarily due to the impact of a one-time income tax charge to decrease deferred tax asset values from the Singapore statutory tax rate to an incentive tax rate, partially offset by a one-time income tax benefit related to the GILTI tax deductions for intangible asset amortization and the release of tax reserves related to Malaysia income tax assessment appeal. The tax rate in 2023 was higher than the U.S. statutory rate primarily due to the impact of U.S. tax capitalization of research and experimental expenditures, partially offset by the net impact from the proportion of worldwide earnings taxed at lower statutory tax rates in non-U.S. jurisdictions and the U.S. tax imposed on those non-U.S. jurisdictions. The increase in the effective tax rate of 7 percentage points from 2023 to 2024 was primarily due to the one-time income tax items in 2024.

Keysight benefits from tax incentives in several jurisdictions, most significantly in Singapore and Malaysia. The tax incentives provide lower rates of taxation on certain classes of income and require thresholds of investments and employment in those jurisdictions. The Singapore tax incentive expires July 31, 2029 while the Malaysia tax incentive expired on October 31, 2025. We are in the process of renewing our Malaysia tax incentive.
The open tax years for the U.S. federal income tax return and most state income tax returns are from November 1, 2019 through the current tax year. For the majority of our non-U.S. entities, the open tax years are from November 1, 2019 through the current tax year.

At this time, management does not believe that the outcome of any future or current examination will have a material impact on our consolidated financial statements. We believe that we have an adequate provision for any adjustments that may result from tax examinations. However, the outcome of tax examinations cannot be predicted with certainty. Given the numerous tax years and matters that remain subject to examination in various tax jurisdictions, the ultimate resolution of current and future tax examinations could be inconsistent with management's current expectations. If that were to occur, it could have an impact on our effective tax rate in the period in which such examinations are resolved.

The calculation of our tax liabilities involves uncertainties in the application of complex tax law and regulations in a multitude of jurisdictions. Although the guidance on the accounting for uncertainty in income taxes prescribes the use of a recognition and measurement model, the determination of whether an uncertain tax position has met those thresholds requires significant judgment by management. In accordance with the guidance on the accounting for uncertainty in income taxes, for all U.S. and other tax jurisdictions, we recognize potential liabilities for anticipated tax audit issues based on our estimate of whether, and the extent to which, additional taxes and interest will be due. We include interest and penalties related to unrecognized tax positions within the provision for income taxes in the consolidated statements of operations. Accrued interest and penalties are included in the related tax liability line in the consolidated balance sheet.

We are subject to income taxes in the U.S. and various other countries globally. Changes in tax law, tax rates, or in the composition of earnings in countries with differing tax rates may affect deferred tax assets and liabilities recorded and our future effective tax rate.

In June 2025, the United States and the other six countries that make up the G7 nations jointly announced that U.S. companies would be exempted from certain minimum taxes related to the OECD agreement, commonly referred to as Pillar Two. However, significant details regarding the G7 announcement remain uncertain and individual countries that have enacted the OECD agreement, including countries not within the G7, must amend their local legislation for the G7 announcement to become effective. We continue to closely monitor Pillar Two developments.
We do not recognize deferred taxes for temporary differences expected to impact the GILTI tax expense in future years. We recognize the tax expense related to GILTI in each year in which the tax is incurred.

Segment Overview
Keysight has two reportable operating segments, CSG and EISG. The profitability of each of the segments is measured after excluding share-based compensation expense, amortization of acquisition-related balances, acquisition and integration costs, restructuring costs, interest income, interest expense and other items.
A significant portion of the segments' expenses arise from allocated corporate charges, as well as expenses related to our centralized sales force, and service, marketing, and technology functions that are provided to the segments in order to realize economies of scale and to efficiently use resources. Corporate charges include legal, accounting, real estate, insurance services, information technology services, treasury, and other corporate infrastructure expenses. Segment allocations are determined on a basis that we consider to be a reasonable reflection of the utilization of services provided to, or benefits received by the segments. Newly acquired businesses are not allocated these charges until integrated into our shared services and corporate infrastructure.

Communications Solutions Group
CSG serves customers spanning the global commercial communications and aerospace, defense, and government end markets. The group's solutions consist of electronic design and test software, instrumentation, systems, and related services. These solutions are used in the design, simulation, validation, manufacturing, installation, and optimization of communication systems in wireless, wireline (data center ecosystem), enterprise, and aerospace, defense, and government end markets. Our recent acquisition of Spirent adds wireless network test and assurance and positioning technology solutions to our portfolio, complementing our design, validation, and performance offerings to deliver end-to-end solutions to our customers.

Revenue for CSG in 2025 increased 9 percent compared to 2024. Acquisitions had a favorable impact of 1 percentage point on the year-over-year revenue change, while foreign currency movements had an immaterial impact. Revenue increased across all regions and in both the commercial communications and the aerospace, defense, and government end markets. The increase was primarily driven by higher investments in high-speed networks to support increasing demand for AI capabilities and increased investment in aerospace and defense solutions. Customers continued their R&D investments in next-generation technologies and applications, including AI-driven data center expansion, ongoing 5G standards development and deployment, 400G/800G Ethernet, development of new communications technologies (such as 6G, Open Radio Access Networks, commercial non-terrestrial networks, quantum), high-speed networking and major defense and government programs worldwide. CSG revenue for 2024 decreased 7 percent compared to 2023. Acquisitions had a favorable impact of 1 percentage point on the year-over-year revenue change, while foreign currency movements had an immaterial impact. Revenue declined across all regions and in both the commercial communications and the aerospace, defense, and government end markets.
Revenue from the commercial communications market represented approximately 67 percent of total CSG revenue in 2025 and increased 10 percent compared to 2024. Revenue increased across all regions. The year-over-year increase was primarily driven by R&D investments in terabit solutions and expanding 400G/800G transceiver manufacturing capacity to meet rising demand for AI capabilities. We continued to see investments in high-speed networks due to increasing need for AI capabilities in the data center infrastructure ecosystem, which drove demand for our 400G/800G Ethernet solutions, in both R&D and manufacturing. Revenue from the commercial communications market represented approximately 66 percent of total CSG revenue in 2024 and decreased 7 percent compared to 2023. Revenue declined across all regions.

Revenue from the aerospace, defense, and government market represented approximately 33 percent of total CSG revenue in 2025 and increased 8 percent compared to 2024. Revenue increased across all regions. The year-over-year increase was primarily driven by strong growth in space and satellite solutions and continued investments in radar and spectrum operations. Revenue from the aerospace, defense, and government market represented approximately 34 percent of total CSG revenue in 2024 and decreased 8 percent compared to 2023. Revenue declines in Asia Pacific and the Americas were partially offset by an increase in Europe.

Gross margin for CSG in 2025 decreased 1 percentage point compared to 2024, primarily driven by the impact of tariffs and unfavorable mix, partially offset by favorable pricing and higher revenue volume. Gross margin for CSG in 2024 was flat compared to 2023, as lower revenue volume was offset by lower material and variable people-related costs.

R&D expense in 2025 increased 13 percent compared to 2024, primarily driven by continued investments in key growth opportunities in our end markets and leading-edge technologies, higher variable people related costs, and incremental costs from acquired businesses. R&D expense in 2024 was flat compared to 2023, as incremental costs of acquired businesses were offset by lower variable people-related costs. We continued to prioritize investments prudently in strategic growth areas and advanced technologies.

Selling, general and administrative expense in 2025 increased 5 percent compared to 2024, primarily driven by higher people-related and incremental costs from acquired businesses, partially offset by lower infrastructure costs. Selling, general and administrative expense in 2024 decreased 4 percent compared to 2023, primarily driven by lower people-related, marketing, and infrastructure costs resulting from the flexibility of our operating model and cost efficiency measures, partially offset by incremental costs of acquired businesses.

Other operating expense (income), net was income of $14 million in 2025, $10 million in 2024, and $11 million in 2023, and primarily includes property rental income.
Operating margin in 2025 was flat compared to 2024, as gross margin declines were offset by a decline in operating expense as a percentage of sales. Operating margin in 2024 decreased 2 percentage points compared to 2023, primarily driven by higher R&D and selling, general and administrative expenses on lower revenue.

Electronic Industrial Solutions Group
EISG serves customers across a diverse set of end markets focused on automotive and energy, semiconductor solutions, and general electronics. The group's solutions consist of electronic design, test and simulation software, instrumentation, systems, computer-aided engineering solutions, and related services. These solutions are used in the design, simulation, validation, manufacturing, installation, and optimization of electronic equipment.

Revenue for EISG in 2025 increased 6 percent compared to 2024. Acquisitions and foreign currency movements had an immaterial impact on the year-over-year revenue change. Revenue increased across all regions.The increase in revenue reflects mixed demand across the electronic industrial markets with an increase in semiconductor measurements and general electronics measurement, partially offset by a decline in automotive and energy. Despite macroeconomic uncertainties, customer engagement remained high in key long-term strategic initiatives, including R&D for AI-driven demand for advanced semiconductor technologies, software-defined vehicles, industrial IoT, digital health, and fab capacity. Revenue for EISG in 2024 decreased 12 percent compared to 2023. Acquisitions had a favorable impact of 7 percentage points on the year-over-year revenue change, while foreign currency movements had an unfavorable impact of 1 percentage point.

Gross Margin and Operating Margin

Gross margin for EISG in 2025 was flat compared to 2024, primarily as the impact of tariffs and unfavorable mix, was offset by favorable pricing. Gross margin for EISG in 2024 decreased 2 percentage points compared to 2023, primarily driven by lower revenue volume, partially offset by favorable gross margin impact from the ESI Group acquisition and lower variable people-related costs.

R&D expense in 2025 increased 2 percent compared to 2024, primarily driven by continued investments in key growth opportunities in our end markets and leading-edge technologies and higher variable people related costs. R&D expense in 2024 increased 13 percent compared to 2023, primarily driven by incremental costs from acquired businesses, partially offset by lower variable people-related costs.

Selling, general and administrative expense in 2025 decreased 1 percent compared to 2024, primarily driven by lower infrastructure costs, partially offset by higher people-related costs. Selling, general and administrative expense in 2024 increased 9 percent compared to 2023, primarily driven by incremental costs from acquired businesses, partially offset by lower people-related and infrastructure costs resulting from the flexibility of our operating model and cost efficiency measures.

Other operating expense (income), net was income of $7 million in 2025 and $4 million in 2024 and 2023, and primarily included property rental income.
Operating margin in 2025 increased 2 percentage points compared to 2024, primarily driven by lower R&D expense and selling, general and administrative expense on higher revenue. Operating margin in 2024 decreased 10 percentage points compared to 2023, primarily driven by higher selling, general and administrative expense and R&D expense on lower revenue, coupled with gross margin declines.

Financial Condition

Liquidity and Capital Resources
Our liquidity is affected by many factors, including normal ongoing operations of our business and fluctuations due to global economics and markets. Our cash balances are generated and held in many locations throughout the world. Under certain circumstances, U.S. and local government regulations may limit our ability to move cash balances to meet cash needs.

Overview of Cash Flows

perating Activities
Cash flows from operating activities can fluctuate significantly from period to period as working capital needs, the timing of payments for income taxes, variable pay, pension funding, and other items impact reported cash flows.

Net cash provided by operating activities increased $357 million in 2025 compared to 2024 and decreased $356 million in 2024 compared to 2023.

•    Net income in 2025 increased $236 million compared to 2024. Non-cash adjustments to net income were lower by $452 million, primarily due to a $384 million increase in deferred tax benefit resulting from a prior period one-time income tax charge (see Note 5, “Income Taxes,” for additional information), an $85 million increase in unrealized gains on investments in equity securities, and a $21 million gain on sale of investments, partially offset by a $25 million increase in share-based compensation, a $8 million increase in excess and obsolete inventory related charges, and a $6 million increase in amortization and depreciation expense.
Net income in 2024 decreased $443 million compared to 2023. Non-cash adjustments to net income were higher by $339 million, primarily due to a $271 million increase in deferred tax expense resulting from a one-time income tax charge of $315 million to decrease deferred tax asset values from the Singapore statutory tax rate to an incentive tax rate, a $58 million increase in amortization and depreciation expense, a $8 million increase in excess and obsolete inventory related charges, and a $2 million increase in share-based compensation.

•    The aggregate of accounts receivable, inventory, and accounts payable provided net cash of $25 million during 2025, compared to net cash provided of $48 million in 2024, and net cash used of $196 million in 2023. The amount of cash flow generated from or used by the aggregate of accounts receivable, inventory, and accounts payable depends upon the cash conversion cycle, which represents the number of days that elapse from the day we pay for the purchase of raw materials and components to the collection of cash from our customers and can be significantly impacted by the timing of shipments and purchases, as well as collections and payments in a period.

•The aggregate of income tax receivables provided net cash of $105 million during 2025, compared to net cash used of $202 million in 2024 and $4 million in 2023. The difference between 2025 and 2024 cash flows was primarily driven by a prior year income tax benefit due to one-time discrete tax items (see Note 5, “Income Taxes,” for additional information), partially offset by current year income tax accruals.
The difference between 2024 and 2023 cash flow was due to higher tax receivables primarily due to the recognition of a discrete tax benefit of $165 million recorded as a current and long-term tax receivable in the consolidated balance sheet related to the U.S. intangible asset amortization deduction for purposes of determining income or loss under IRC § 951A(c) and the amendment of our U.S. federal income tax returns for the open tax years to claim the deduction. See Note 5, “Income Taxes,” for additional information.

•During the year ended October 31, 2023, we terminated forward-starting interest rate swap agreements resulting in proceeds of $107 million.

•The aggregate other movements in assets and liabilities provided net cash of $172 million during 2025, compared to net cash used of $117 million in 2024 and net cash provided of $74 million in 2023. The difference between 2025 and 2024 cash flows was primarily due to changes in derivative assets and liabilities (see Note 9, “Derivatives,” for additional information), higher variable compensation, and payroll-related accruals, net of payments, higher income and other tax accruals, net of payments, and changes in deferred revenue, partially offset by changes in retirement and post-retirements benefits and other assets and liabilities, driven by acquisition-related payments.
The difference between 2024 and 2023 cash flows was primarily due to changes in derivative assets and liabilities
, changes in deferred revenue, and changes in other assets and liabilities, partially offset by higher income and other tax accruals, net of payments, lower variable compensation, and payroll-related payments, net of accruals.

Investing Activities
Net cash changes in investing activities primarily relates to investments in property, plant and equipment and acquisitions of businesses to support our growth.
Net cash used in investing activities increased by $908 million in 2025 compared to 2024 and increased by $531 million in 2024 compared to 2023. The increase in net cash used in investing activities in 2025 as compared to 2024 was primarily due to $1,341 million higher cash used for acquisition activities, partially offset by a $399 million proceeds from a divestiture and a $20 million decrease in cash used for purchases of property, plant and equipment, net of government incentives received.

In 2025, we used $2,022 million, net of cash acquired, for acquisitions, which included $1,415 million, net of $127 million cash acquired, for the acquisition of Spirent, $578 million used for the acquisition of Synopsys' OSG, $26 million used for acquisition of Ansys' PowerArtist RTL Business and $3 million used for other acquisition activity. Additionally, we used $127 million for purchases of property, plant and equipment, net of $1 million of government incentives, and $7 million for purchase of investments, partially offset by $399 million provided by the divestiture of Spirent's high-speed ethernet, network security and channel emulation business lines to Viavi Solutions Inc. and $30 million provided by sale of investments.

In 2024, we used $681 million, net of cash acquired, for acquisitions, which included $477 million, net of $35 million cash acquired, for the acquisition of the controlling block of ESI Group shares. Additionally, we used $147 million for purchases of property, plant and equipment, net of $7 million of government incentives and $11 million for purchase of investments, partially offset by $11 million provided by sale of investments and $9 million provided by other investing activities.

In 2023, we used $288 million for investing activities, including $196 million for purchases of property, plant and equipment, net of $1 million of government incentives, $85 million, net of cash acquired, for acquisition activities, and $7 million for purchase of investments.
Financing Activities

Our financing activities primarily include proceeds from issuance of common stock under employee stock plans, tax payments related to net share settlement of equity awards, issuances and repayment of debt and related costs, treasury stock repurchases, and transactions with non-controlling interests in partially-owned consolidated subsidiaries.

Net cash provided by financing activities increased by $1,298 million in 2025 compared to 2024. Net cash used in financing activities increased by $226 million in 2024 compared to 2023. The increase in 2025 compared to 2024 was primarily due to $624 million used for repayment of 2024 Senior Notes in 2024, $458 million used for the acquisition of the non-controlling interest in ESI Group in 2024, $149 million higher proceeds from issuance of senior notes and $66 million lower treasury stock repurchases.

In 2025, we generated $385 million from financing activities, including $748 million of proceeds from the issuance of the 2030 Senior Notes and $63 million of proceeds from issuance of common stock under employee stock plans, partially offset by $377 million for treasury stock repurchases, including payment of $3 million for excise taxes levied on share repurchases, $39 million for tax payments related to net share settlement of equity awards, $8 million used for payment of debt issuance costs and $2 million used for other financing activities.

In 2024, we used $913 million for financing activities, including $600 million used for repayment of the 2024 Senior Notes, $458 million used for the acquisition of the non-controlling interest in ESI Group, $443 million used for treasury stock repurchases, including payment of $4 million for excise taxes levied on share repurchases, $31 million for tax payments related to net share settlement of equity awards, $24 million used for repayment of debt assumed as part of the ESI Group acquisition, $12 million used for payment of debt issuance costs, and $10 million used for other financing activities, partially offset by $599 million of proceeds from the issuance of the 2034 Senior Notes and $66 million of proceeds from issuance of common stock under employee stock plans.

In 2023, we used $687 million for financing activities, including $702 million for treasury stock repurchases and $49 million for tax payments related to net share settlement of equity awards, partially offset by $67 million of proceeds from issuance of common stock under employee stock plans.

Treasury stock repurchases
On March 6, 2023, our board of directors approved a stock repurchase program authorizing the purchase of up to $1,500 million of the company's common stock. On November 24, 2025, our board of directors approved a new stock repurchase program authorizing the purchase of up to $1,500 million of the company's common stock, replacing the previously approved March 2023 program, under which $110 million remained as of October 31, 2025. The stock repurchase program may be commenced, suspended, or discontinued at any time at the company's discretion and does not have an expiration date. See “Issuer Purchases of Equity Securities” under Part II Item 5 for additional information.

In April 2017, the company issued an aggregate principal amount of $700 million in unsecured senior notes (“2027 Senior Notes”). The 2027 Senior Notes were issued at 99.873 percent of their principal amount. The notes will mature on April 6, 2027 and bear interest at a fixed rate of 4.60 percent per annum. The interest is payable semi-annually on April 6 and October 6, commencing on October 6, 2017. We incurred issuance costs of $6 million in connection with the 2027 Senior Notes that, along with the debt discount, are being amortized to interest expense over the term of the senior notes.

2029 Senior Notes
In October 2019, the company issued an aggregate principal amount of $500 million in unsecured senior notes (“2029 Senior Notes”). The 2029 Senior Notes were issued at 99.914 percent of their principal amount. The notes will mature on October 30, 2029 and bear interest at a fixed rate of 3.00 percent per annum. The interest is payable semi-annually on April 30 and October 30, commencing on April 30, 2020. We incurred issuance costs of $4 million in connection with the 2029 Senior Notes that, along with the debt discount, are being amortized to interest expense over the term of the senior notes.

2030 Senior Notes
In April 2025, the company issued an aggregate principal amount of $750 million in unsecured senior notes (“2030 Senior Notes”). The 2030 Senior Notes were issued at 99.760 percent of their principal amount. The notes will mature on July 30, 2030 and bear interest at a fixed rate of 5.35 percent per annum. The interest is payable semi-annually on January 30 and July 30, commencing on January 30, 2026. We incurred issuance costs of $7 million in connection with the 2030 Senior Notes that, along with the debt discount, are being amortized to interest expense over the term of the senior notes.

2034 Senior Notes
In October 2024, the company issued an aggregate principal amount of $600 million in unsecured senior notes . The 2034 Senior Notes were issued at 99.897 percent of their principal amount. The notes will mature on October 15, 2034 and bear interest at a fixed rate of 4.95 percent per annum. The interest is payable semi-annually on April 15 and October 15, commencing on April 15, 2025. We incurred issuance costs of $6 million in connection with the 2034 Senior Notes that, along with the debt discount, are being amortized to interest expense over the term of the senior notes.

The above senior notes are unsecured and rank equally in right of payment with all of our other senior unsecured indebtedness. We were in compliance with the covenants of our senior notes during the year ended October 31, 2025.

Revolving Credit Facility
On July 30, 2021, we entered into an amended and restated credit agreement (the “Revolving Credit Facility”), which provided a $750 million five-year unsecured revolving credit facility that expires on July 30, 2026. Borrowings under the facility bear an annual interest rate of SOFR + 1.1 percent, including a facility fee of 0.1 percent per annum. In addition, the Revolving Credit Facility permits the company, subject to certain customary conditions, on one or more occasions to request to increase the total commitments under the Revolving Credit Facility by up to $250 million in the aggregate. We may use amounts borrowed under the Revolving Credit Facility for general corporate purposes. As of October 31, 2025 and 2024, we had no borrowings outstanding under the Revolving Credit Facility. We were in compliance with the covenants of the Revolving Credit Facility during the year ended October 31, 2025.

Bridge Facility
On March 28, 2024, we entered into a bridge credit agreement (the “Bridge Facility”) pursuant to which certain lenders agreed to provide a senior unsecured bridge credit facility of up to 1,350 million pounds sterling for the purpose of providing the financing to support a planned acquisition. On July 25, 2024, the Bridge Facility decreased to 1,232 million pounds sterling. On May 8, 2025, the Bridge Facility further decreased to 752 million pounds sterling and on September 25, 2025 the Bridge Facility was terminated. We incurred costs in connection with the Bridge Facility of $7 million that have been fully amortized to interest expense.

Cash and cash requirements
Our cash and cash equivalents mainly consist of investments in institutional money market funds investments, short-term deposits held at major global financial institutions, and similar short duration instruments with original maturities of three months or less. We continuously monitor the creditworthiness of the financial institutions and money market fund asset managers with whom we invest our funds. We utilize a variety of funding strategies in an effort to ensure that our worldwide cash is available in the locations in which it is needed. Most significant international locations have access to internal funding through an offshore cash pool for working capital needs. In addition, a few locations that are unable to access internal funding have access to temporary local overdraft and short-term working capital lines of credit.

Cash requirements
We have cash requirements to support working capital needs, capital expenditures, business acquisitions, contractual obligations, commitments, principal and interest payments on debt, and other liquidity requirements associated with our operations. We generally intend to use available cash and funds generated from our operations to meet these cash requirements. In the event that additional liquidity is required, we may also borrow under the Revolving Credit Facility and/or issue new debt.

We also have long-term power purchase agreements to purchase power at predominantly variable prices. These agreements are expected to support our power consumption needs with more favorable pricing and reliability than our previous supply agreements.

Other liabilities. Other liabilities primarily include contract liabilities, net pension and post-retirement benefit obligations, employee compensation and benefits, net tax liabilities, standard warranties, and other accrued liabilities. The timing of cash flows associated with these obligations is based on management's estimates over the terms of these arrangements and is largely based on historical experience.
Of the tax liabilities included in the above table, $20 million relates to a U.S. transition tax liability and $231 million for uncertain tax positions. The remaining U.S. transition tax liability, which Keysight originally elected to pay over 8 years, is payable over the next 3 years and relates to a one-time U.S. tax on those earnings that had not been previously repatriated to the U.S. With regard to the $231 million of long-term liabilities for uncertain tax positions, we are unable to accurately predict when these amounts will be realized or released. We believe that we have an adequate provision for any adjustments that may result from tax examinations. However, the outcome of tax examinations cannot be predicted with certainty. Given the numerous tax years and matters that remain subject to examination in various tax jurisdictions, the ultimate resolution of current and future tax examinations could be inconsistent with management's current expectations.
In addition to the obligations noted above, as of October 31, 2025, we had $60 million of outstanding letters of credit, custom bonds, and surety bonds that were issued by various lenders.

For the next twelve months, we do not expect to contribute to our U.S. defined benefit plan and U.S. post-retirement benefit plan, and we expect to contribute $14 million to our non-U.S. defined benefit plans. The ultimate amounts we may contribute depend on, among other things, legal requirements, underlying asset returns, the plan's funded status, the anticipated tax deductibility of the contribution, local practices, market conditions, interest rates, and other factors.

Additionally, we expect capital expenditures to be approximately $160 million in 2026 compared to $127 million in 2025.
As of October 31, 2025, we believe our cash and cash equivalents, cash generated from operations, and our ability to access capital markets and credit lines will satisfy our cash needs for the foreseeable future both globally and domestically.

Quantitative and Qualitative Disclosures About Market Risk
At various times, we use derivative financial instruments to limit exposure to changes in foreign currency exchange rates and interest rates. Because derivative instruments are used solely as hedges and not for speculative trading purposes, fluctuations in the market values of such derivative instruments are generally offset by reciprocal changes in the underlying economic exposures that the instruments are intended to hedge. For further discussion of derivative financial instruments.

Currency exchange rate risk
We are exposed to foreign currency exchange rate risks inherent in our sales commitments, anticipated sales, expenses, assets and liabilities denominated in currencies other than the functional currency of our subsidiaries. We hedge future cash flows denominated in currencies other than the functional currency using sales and expense forecasts on a rolling period of up to twelve months. Our exposure to exchange rate risks is managed on an enterprise-wide basis. This strategy utilizes derivative financial instruments, primarily forward contracts, to hedge certain foreign currency exposures with the intent of offsetting gains and losses that occur on the underlying exposures with gains and losses on the derivative contracts hedging them. We do not currently and do not intend to utilize derivative financial instruments for speculative trading purposes. To the extent that we are required to pay for all, or portions, of an acquisition price in foreign currencies, we may enter into foreign exchange contracts to reduce the risk that currency movements will impact the cost of the transaction.
Our operations generate non-functional currency cash flows such as revenue, third-party vendor payments, and inter-company payments. In anticipation of these foreign currency cash flows and in view of the volatility of the currency market, we enter into foreign exchange contracts as described above to substantially mitigate our currency risk. In 2025, 2024, and 2023, approximately 72 percent, 71 percent, and 75 percent, respectively, of our revenues were generated in U.S. dollars.

The unfavorable effects of changes in foreign currency exchange rates, principally as a result of the strength of the U.S. dollar, had an immaterial impact on our revenue in the year ended October 31, 2025. We calculate the impact of foreign currency exchange rates movements by applying the actual foreign currency exchange rates in effect during the last month of each fiscal quarter of the current fiscal year to both the applicable current and prior year periods. We also performed a sensitivity analysis assuming a hypothetical 10 percent adverse movement in foreign exchange rates to the hedging contracts and the underlying exposures described above. As of October 31, 2025 and 2024, the analysis indicated that these hypothetical market movements would not have a material effect on our consolidated financial position, results of operations, or cash flows.

Interest rate risk
A change in interest rates on long-term debt impacts the fair value of the company's fixed-rate long-term debt but not the company's earnings or cash flow because the interest on such debt is fixed. Generally, the fair market value of fixed-rate debt will increase as interest rates fall and decrease as interest rates rise.
As of October 31, 2025, a hypothetical 10 percent increase in interest rates would have decreased the fair value of the company's fixed-rate debt by approximately $45 million. However, since the company currently has no plans to repurchase its outstanding fixed-rate instruments before their maturity, nor do the investors in our fixed-rate debt obligations have the right to demand we pay off these obligations prior to maturity, the impact of market interest rate fluctuations on the company's fixed-rate long-term debt does not affect the company's results of operations or stockholders' equity.
![]()
Closed Trades
_____________
                                                        Trade   Total     Gain
Date    Sym   Company                        BS Shares  Price   Aft Cm  (-Loss)

260102  ADBE  Adobe Systems Inc              S    113 347.61 $  39,279 $      0
260209  ADBE  Adobe Systems Inc              B    226 265.58 $  60,021 $  9,269
260102  AMCX  AMC Networks Cl A              S   3906   9.48 $  37,028 $      0
260209  AMCX  AMC Networks Cl A              B   7812   7.32 $  57,183 $  8,437
260102  AVGO  Broadcom Ltd                   S     88 357.05 $  31,420 $      0
260204  AVGO  Broadcom Ltd                   B    176 298.25 $  52,492 $  5,174
260203  AXTA  Axalta Coating Systems Ltd     B    871  31.76 $  27,662 $      0
260210  AXTA  Axalta Coating Systems Ltd     S   1742  34.77 $  60,569 $  2,622
260106  BFAM  Bright Horizons Family Solutio S    352 103.41 $  36,400 $      0
260209  BFAM  Bright Horizons Family Solutio B    704  83.81 $  59,002 $  6,899
260102  BG    Bunge Ltd                      B    253  89.59 $  22,666 $      0
260204  BG    Bunge Ltd                      S    506 120.42 $  60,932 $  7,800
260108  BP    BP Plc ADR                     B    811  33.73 $  27,355 $      0
260204  BP    BP Plc ADR                     S   1622  39.11 $  63,436 $  4,363
260102  CAT   Caterpillar Inc                B     40 581.06 $  23,242 $      0
260210  CAT   Caterpillar Inc                S     80 744.48 $  59,558 $  6,537
260108  CCB   Coastal Financial Corp         S    341 118.57 $  40,432 $      0
260205  CCB   Coastal Financial Corp         B    682  84.39 $  57,553 $ 11,656
260102  CELH  Celsius Holdings Inc           B    647  46.23 $  29,910 $      0
260120  CELH  Celsius Holdings Inc           S   1294  57.27 $  74,107 $  7,143
260116  CENTA Central Garden & Pet           B    889  28.71 $  25,523 $      0
260206  CENTA Central Garden & Pet           S   1778  34.16 $  60,736 $  4,845
260114  CHEF  The Chefs Warehouse            B    458  57.96 $  26,545 $      0
260209  CHEF  The Chefs Warehouse            S    916  67.45 $  61,784 $  4,347
260105  EPD   Enterprise Products Partners L B    852  31.87 $  27,153 $      0
260205  EPD   Enterprise Products Partners L S   1704  35.19 $  59,963 $  2,828
260114  FOUR  Shift4 Payments Inc            S    501  67.88 $  34,007 $      0
260203  FOUR  Shift4 Payments Inc            B   1002  53.18 $  53,286 $  7,364
260102  HLX   Helix Energy Solutions Group   B   3546   6.21 $  22,020 $      0
260209  HLX   Helix Energy Solutions Group   S   7092   8.69 $  61,629 $  8,794
260102  INTC  Intel Corp                     B    636  38.14 $  24,257 $      0
260122  INTC  Intel Corp                     S   1272  54.05 $  68,751 $ 10,118
260102  JBHT  J B Hunt Transport             B    130 195.48 $  25,412 $      0
260210  JBHT  J B Hunt Transport             S    260 228.60 $  59,436 $  4,306
260102  KEYS  Keysight Technologies Inc      B    127 205.76 $  26,131 $      0
260210  KEYS  Keysight Technologies Inc      S    254 235.59 $  59,839 $  3,788
260107  KKR   KKR & Company LP               S    279 135.91 $  37,918 $      0
260205  KKR   KKR & Company LP               B    558  98.34 $  54,873 $ 10,482
260121  LEU   Centrus Energy Corp            S    113 342.14 $  38,661 $      0
260204  LEU   Centrus Energy Corp            B    226 232.82 $  52,617 $ 12,353
260102  LHX   L3Harris Technologies Inc      B     86 293.92 $  25,277 $      0
260129  LHX   L3Harris Technologies Inc      S    172 365.89 $  62,933 $  6,189
260102  LVS   Las Vegas Sands                S    526  64.96 $  34,168 $      0
260129  LVS   Las Vegas Sands                B   1052  52.44 $  55,166 $  6,585
260115  MPAA  Motorcar Parts Amer            S   2795  13.60 $  38,012 $      0
260209  MPAA  Motorcar Parts Amer            B   5590   9.38 $  52,434 $ 11,795
260105  PCVX  Vaxcyte Inc                    B    545  44.38 $  24,187 $      0
260203  PCVX  Vaxcyte Inc                    S   1090  58.36 $  63,612 $  7,619
260107  PLTR  Palantir Technologies Inc Cl A S    215 185.41 $  39,863 $      0
260205  PLTR  Palantir Technologies Inc Cl A B    430 129.60 $  55,728 $ 11,999
260108  SNOW  Snowflake Inc Cl A             S    164 233.95 $  38,367 $      0
260205  SNOW  Snowflake Inc Cl A             B    328 157.64 $  51,705 $ 12,515
260106  TMHC  Taylor Morrison Home Corp      B    451  57.82 $  26,076 $      0
260210  TMHC  Taylor Morrison Home Corp      S    902  66.62 $  60,091 $  3,969
260106  TT    Trane Technologies Plc         B     65 351.54 $  22,850 $      0
260210  TT    Trane Technologies Plc         S    130 460.80 $  59,903 $  7,101
260113  VOD   Vodafone Grp Plc ADR           B   1967  13.28 $  26,121 $      0
260204  VOD   Vodafone Grp Plc ADR           S   3934  15.74 $  61,921 $  4,839
260108  VRT   Vertiv Holdings Llc.           B    150 160.36 $  24,054 $      0
260209  VRT   Vertiv Holdings Llc.           S    300 206.35 $  61,905 $  6,898
260109  WDFC  W D 40 Company                 B    125 177.13 $  22,141 $      0
260205  WDFC  W D 40 Company                 S    250 250.71 $  62,677 $  9,197
260129  ZBH   Zimmer Biomet Holdings         B    328  85.44 $  28,024 $      0
260210  ZBH   Zimmer Biomet Holdings         S    656  94.48 $  61,978 $  2,965
260120  ZM    Zoom Communications Inc        B    315  80.57 $  25,379 $      0
260128  ZM    Zoom Communications Inc        S    630  96.60 $  60,857 $  5,049
                                                                      _________
                                                                     $  235,845
Open Positions, Only
_____________________

                                                        Recent  Total     Gain
Date    Sym   Company                        BS Shares  Price   Aft Cm  (-Loss)

260108  SNOW  Snowflake Inc Cl A             S    164 182.58 $  29,943 $  4,049
260210  KEYS  Keysight Technologies Inc      S    127 235.00 $  29,845 $     76
260128  ZM    Zoom Communications Inc        S    315  94.99 $  29,921 $    512
260102  AVGO  Broadcom Ltd                   S     88 340.44 $  29,958 $  3,676
260102  LVS   Las Vegas Sands                S    526  57.02 $  29,992 $  2,385
260203  PCVX  Vaxcyte Inc                    S    545  54.98 $  29,964 $  1,861
260122  INTC  Intel Corp                     S    636  47.13 $  29,974 $  4,445
260204  BP    BP Plc ADR                     S    811  36.97 $  29,982 $  1,753
260210  AXTA  Axalta Coating Systems Ltd     S    871  34.42 $  29,979 $    308
260206  CENTA Central Garden & Pet           S    889  33.74 $  29,994 $    377
260107  KKR   KKR & Company LP               S    279 107.21 $  29,911 $  2,450
260210  TT    Trane Technologies Plc         S     65 461.38 $  29,989 $    -38
260121  LEU   Centrus Energy Corp            S    113 264.99 $  29,943 $  3,599
260210  CAT   Caterpillar Inc                S     40 742.37 $  29,694 $     85
260102  ADBE  Adobe Systems Inc              S    113 264.67 $  29,907 $   -102
260106  BFAM  Bright Horizons Family Solutio S    352  85.04 $  29,934 $    429
260120  CELH  Celsius Holdings Inc           S    647  46.35 $  29,988 $  7,136
260209  VRT   Vertiv Holdings Llc.           S    150 199.62 $  29,942 $  1,020
260205  WDFC  W D 40 Company                 S    125 238.87 $  29,858 $  1,495
260129  LHX   L3Harris Technologies Inc      S     86 345.08 $  29,676 $  1,808
260209  CHEF  The Chefs Warehouse            S    458  65.36 $  29,934 $    967
260114  FOUR  Shift4 Payments Inc            S    501  59.81 $  29,964 $  3,288
260210  ZBH   Zimmer Biomet Holdings         S    328  91.40 $  29,979 $  1,020
260205  EPD   Enterprise Products Partners L S    852  35.19 $  29,981 $      0
260107  PLTR  Palantir Technologies Inc Cl A S    215 139.51 $  29,994 $  2,109
260108  CCB   Coastal Financial Corp         S    341  87.84 $  29,953 $  1,165
260209  HLX   Helix Energy Solutions Group   S   3546   8.46 $  29,999 $    824
260115  MPAA  Motorcar Parts Amer            S   2795  10.73 $  29,990 $  3,736
260204  VOD   Vodafone Grp Plc ADR           S   1967  15.25 $  29,996 $    973
260210  TMHC  Taylor Morrison Home Corp      S    451  66.41 $  29,950 $     96
260102  AMCX  AMC Networks Cl A              S   3906   7.68 $  29,998 $  1,392
260210  JBHT  J B Hunt Transport             S    130 229.05 $  29,776 $    -59
260204  BG    Bunge Ltd                      S    253 118.37 $  29,947 $    524
                                                                      _________
                                                                     $   53,359

                             Grand Total (non-option trades):       $   289,204
Summary (sorted by AVPE/CUPE, desc):
Ticker  Name                                      AVPE/CUPE
AMCX    AMC Networks                                 12.137
BFAM    Bright Horizons Family Solutions              5.721
BP      BP                                            5.406
ZM      Zoom Communications                           4.948
VOD     Vodafone Group                                2.919
ADBE    Adobe                                         2.629
FOUR    Shift4 Payments                               1.572
ZBH     Zimmer Biomet Holdings                        1.462
AXTA    Axalta Coating Systems                        1.222
CENTA   Central Garden & Pet                          1.156
WDFC    WD-40                                         1.150
HLX     Helix Energy Solutions                        1.048
PLTR    Palantir Technologies                         0.978
LVS     Las Vegas Sands                               0.871
TMHC    Taylor Morrison Home                          0.830
AVGO    Broadcom                                      0.793
CELH    Celsius Holdings                              0.772
JBHT    J.B Hunt Transport Services                   0.695
KEYS    Keysight Technologies                         0.673
CHEF    Chefs' Warehouse                              0.620
EPD     Enterprise Products Partners                  0.603
TT      Trane Technologies                            0.577
KKR     KKR                                           0.570
LHX     L3Harris Technologies Inc                     0.567
CCB     Coastal Financial                             0.566
VRT     Vertiv Holdings                               0.483
BG      Bunge Global SA                               0.425
LEU     Centrus Energy                                0.334
CAT     Caterpillar                                   0.298
MPAA    Motorcar Parts Of America                     0.200
INTC    Intel                                         0.009
SNOW    Snowflake                                     0.000
PCVX    Vaxcyte                                       0.000
This is useful in relating recent performance to past valuation.
As one indicator, 1.0 is the break point between potentially weaker and strong stocks.
It should not be used by itself to predict without regard for many other extraneous factors.
Note: 0.000 entries are way down on the list because successive annual losses reported.
![]()
Archive List
02-24-2026: Bright Horizons Family Soluntions, Inc. (BFAM): Childrens' Future in Weak Economy
![]()
Trading in stocks involves risk, and past performance is no guarantee of future profits. Zenith does not sell advice nor does it manage discretionary accounts other
than its own. Readers should be aware of the vested interest that all traders / brokers have in encouraging other traders
to make the same transactions.
No one should follow investment advice blindly. This web site should be used only as a "sounding board" for confirming one's own opinion. Any suggested order placements should
be reviewed and reset to fit current market conditions by individual traders. ![]()


![]()