![]()
Corporate Webpages Under Amour, Inc.
In order to review stocks properly using our system, we need
stock data going back at least five years, or through 2014.
Under Armour Corporation presents a confusing problem in this
regard because there are three classes of stock in existence for
that corporation, only two of which are publicly-traded. They are
Classes A, B, and C.
We are here reviewing Class C stock, traded under the ticker symbol "UA".
That ticker symbol was formerly used for Class A stock up until 03/23/2016.
After that date, "UA" stood for Class C stock, formerly traded under the
symbol "UA.C".
Class A stock has limited voting rights, and hence is considered somewhat
more valuable than Class C. The main distinction between UA and UAA shares
comes down to voting rights. UA stock, formerly trading under the UA.C symbol,
stands for Class C shares, with no voting rights. UAA stock, formerly trading
under the symbol UA, stands for Class A shares, which confer one vote per
share to the owner.
Another small difference between UA stock and UAA stock results from this
discrepancy in voting power. Because Class A shares actually allow shareholders
to vote on governance issues, UAA stock will typically trade at a premium to
UA stock, which doesn't have voting rights.
At the end of the day though, even public shareholders of UAA stock will have
no real power in determining the direction of the company. That's because
founder and CEO Kevin Plank owns tens of millions of Class B shares, which
aren't traded publicly and confer a disproportionate number of votes per share
to him.
The Under Armour stock split of 2016, and subsequent ticker change.
In April 2016, Under Armour shareholders received one share of Class C stock
as a special dividend for every Under Armour share they owned, allowing
Under Armour to cut its stock price in half, just as it would have in a
2-for-1 split, without giving shareholders any additional voting power.
Ticker-wise, shareholders all got one share of UA.C for each share of UA
they owned, and the UA stock price fell by roughly 50 percent due to the
effective doubling of the number of Under Armour shares on the market.
For tax purposes, the cost basis was re-allocated roughly evenly between the
two shares, meaning shareholders couldn't sell UA for a 50 percent loss and
take a tax write-off (nice thinking, though).
Of course, as mentioned, those UA shares – the Class A share class – turned to
UAA shares in December.
At last check, there were over 183 million UAA shares outstanding, giving the
public 183 million votes. While that sounds like a lot, Kevin Plank owns over
34 million Class B shares, conferring more than 340 million votes.
Despite this, Class A shares have, ever since Class C shares were first issued
in the Under Armour stock split, traded at a major premium to their nonvoting
cousins. It hasn't been unusual for that markup to reach 20 percent. This
seems like a very high premium to pay for a vote that has little to no value.
The rationale. Before you go ringing your broker or calling your congressman,
it should be said that Kevin Plank is no corporate tyrant. He is hardly alone
in his decision to consolidate voting power; Alphabet (GOOG, GOOGL),
Facebook (FB) and even Berkshire Hathaway (BRK/A, BRK/B) all have similar
dual-share structures. "The intended purpose of the dual-class shares is to
separate the control from the ownership of the company," says K C Ma,
professor of finance at Stetson University. "The dual-class share structure
is an obvious defense for takeover bids, hostile or not, from inside or not."
That's great news if you're Plank or if you believe in his vision. But
if you'd rather have some checks and balances in place, this isn't so great
for corporate governance. Granted, Plank has proven an excellent steward of
shareholder value over the years, but there's never a guarantee that will
continue.
Why the UA to UAA ticker change? It's understandable why Plank would want to
issue two share classes. One good question, however, is why the company decided
to change its ticker symbol after the Class C shares were already issued.
After all, both Class A and Class C shares had already been trading publicly
for months, under their old symbols UA and UA.C., respectively. But when they
changed to UAA and UA, the company gave no stated reason for the change.
Some might say the ticker symbol change was purely cosmetic – UA looks better
than the clumsy UA.C.
A cynic, however, might say the ticker change was done to encourage more people
to buy the UA non-voting shares. While Class A UA stock previously experienced
far higher trading volume than the Class C UA.C did, as soon as the most recent
change was made, Class A UAA trading volume was dwarfed by Class C UA trading
volume. Much of that likely has to do with the fact that the ticker UA has been
associated with Under Armour for years now, so its liquidity benefits from
investor familiarity.
Still, that cynical view makes little sense in light of Plank's power to vote
65 percent of shares, so cosmetics could be the motivating factor. It's
unclear, really, but as long as investors know the difference, the ticker
itself doesn't much matter.
A company spokeswoman says the change was made because "the Class C stock is
the main stock that we will use going forward and, therefore, we wanted to
align our traditional ticker with the Class C shares."
Now, with that in mind, what did we at Zenith did to get stock data going back
before 2016 was that we took UAA stock data from inception in 2009 (which
corresponds to the current "UA" stock), up until 03/23/2016, the date the new
class of shares was issued, Then we adjusted it to match UA price 03/23/2016
and subsequently tacked on current "UA" stock data from that point on.
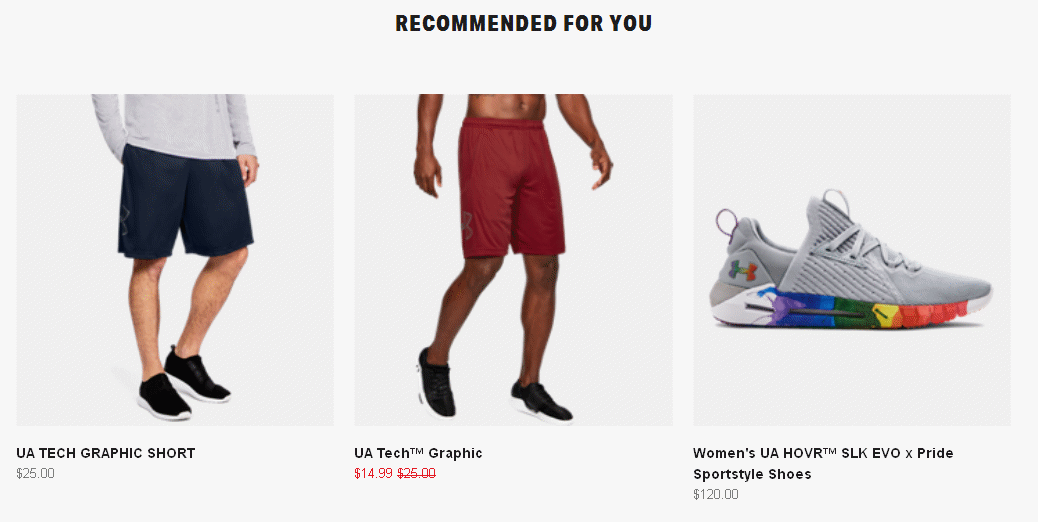
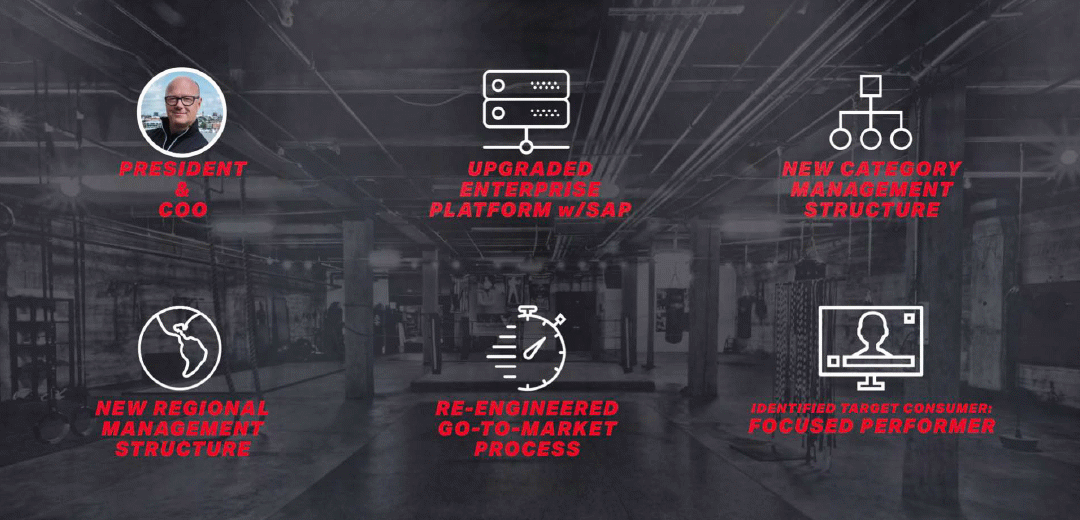
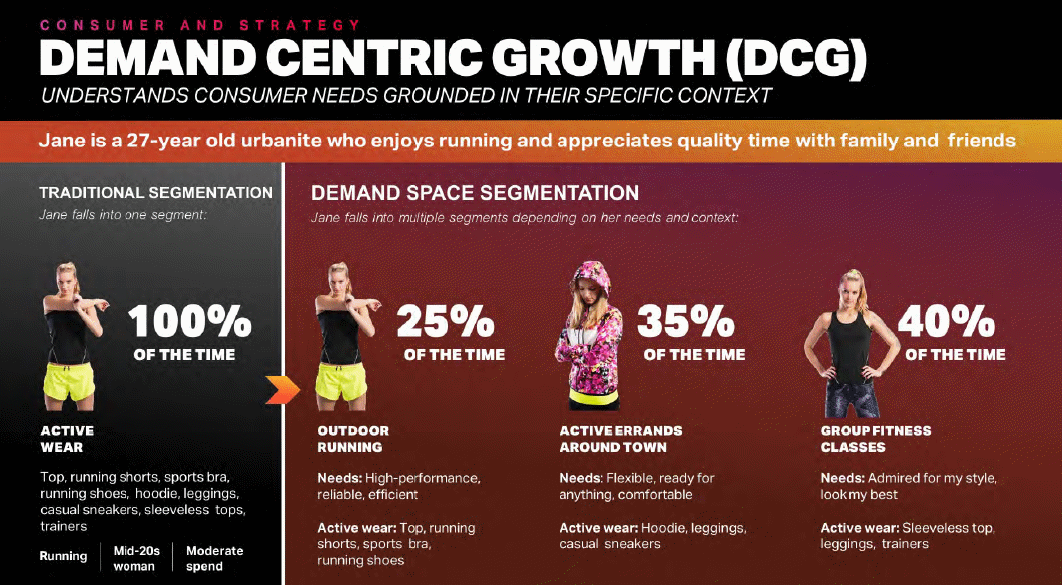
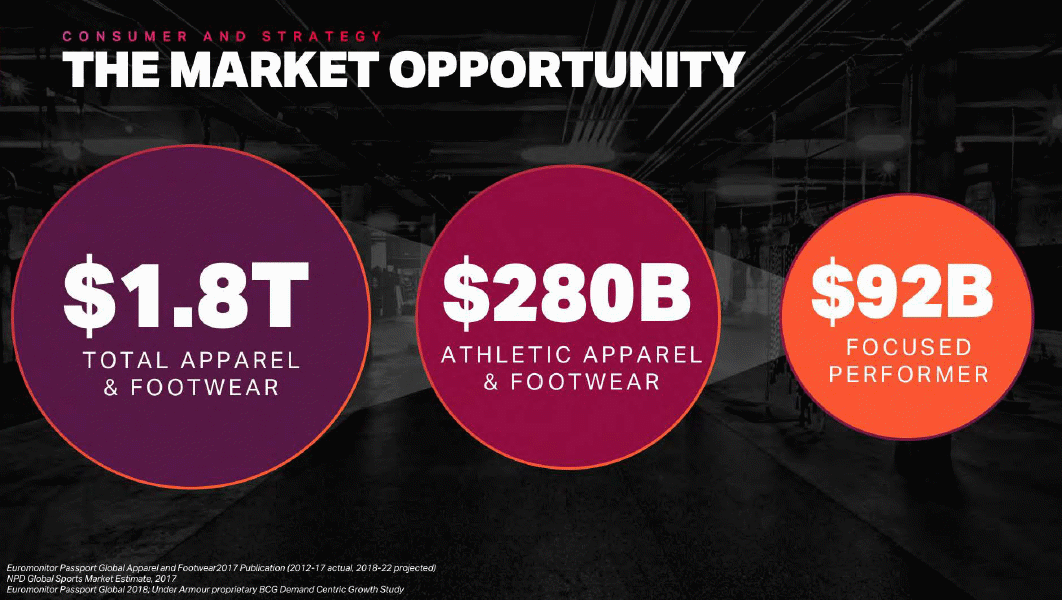
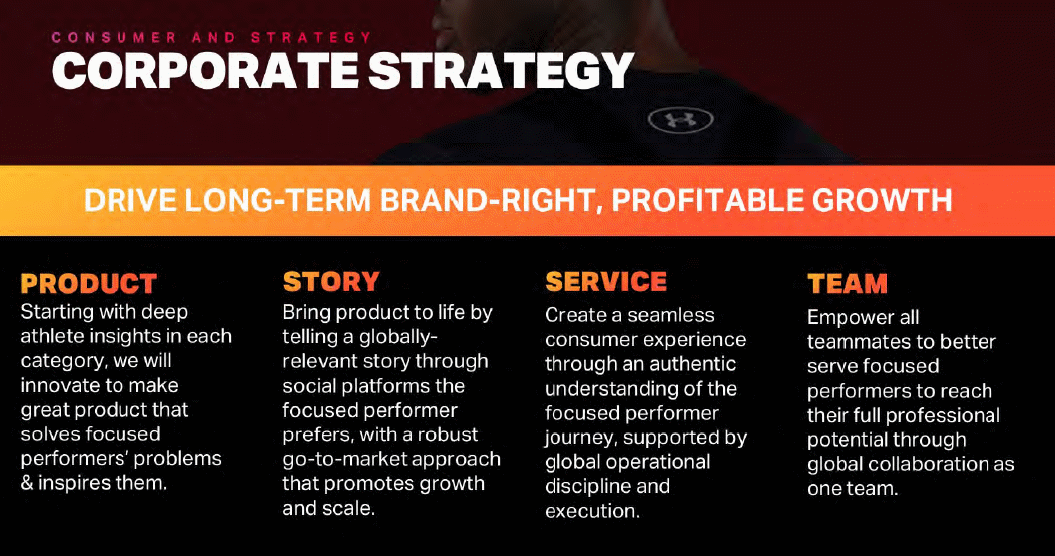
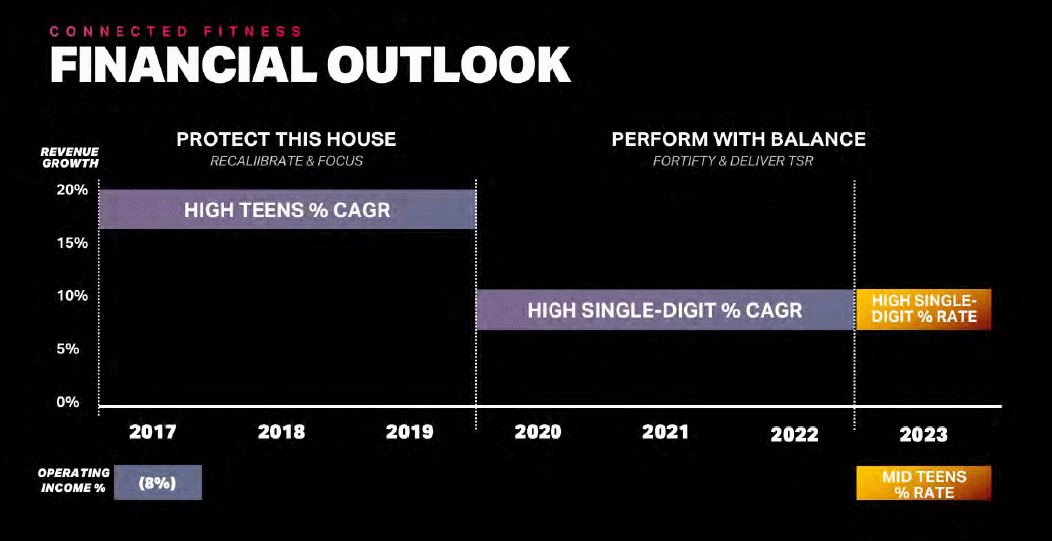
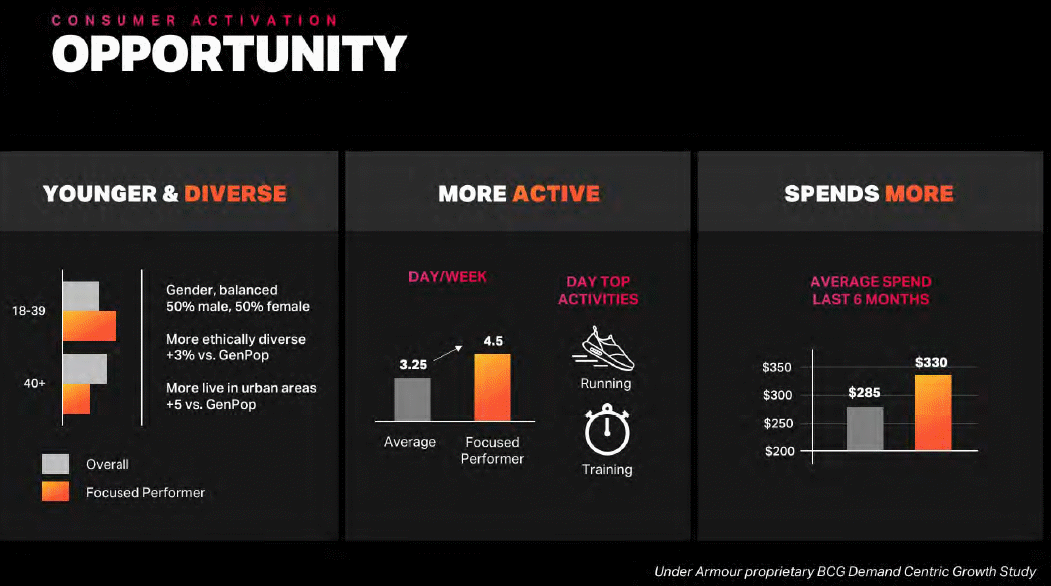
The corporation's website is in our opinion, a mess. It is used
to make internet sales, but descriptions of products and
services is muddled in a bevy of "inspirational slogans" and
meaningless phrases about corporate restructing, strategy,
opportunity, etc., written by people who in our opinion were not
very good at public relations, and incredibly poor at website design.
On the retail end, the company "store locator" will take you to
stores not managed at all by Under Armour but simply carrying
some of its products, stores like Big 5 Sporting Goods, REI,
Finish Line, All Pro Sports, Frontline Uniforms, etc.
Based upon our summary above, one can see we have a rather poor
overall impression of this corporation, and we are joined by not
a few other researchers. In fact, this corporation has the
worst rating by the vast majority of researchers we have ever
seen for any stock. We do like, however, its free
application software, "MyFitnessPal.Com".
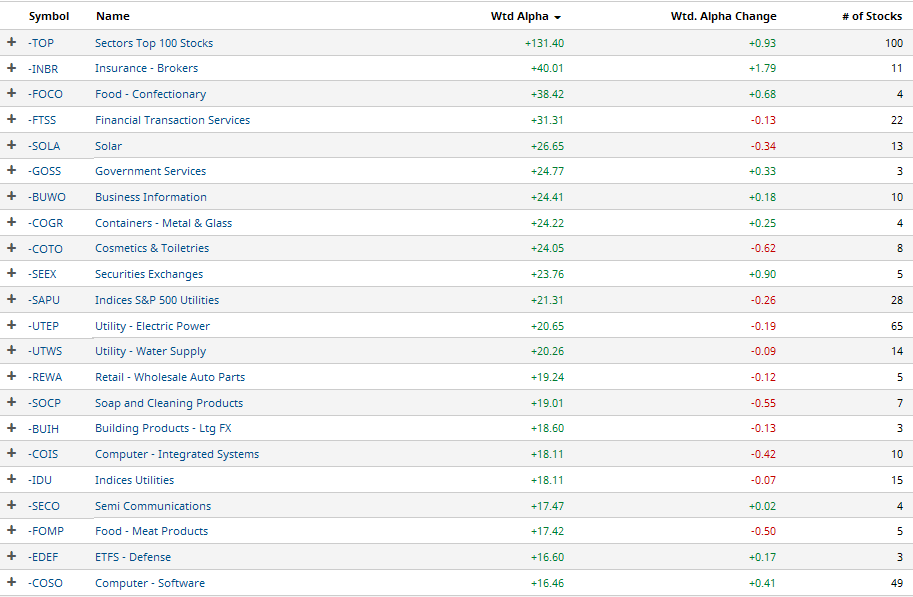
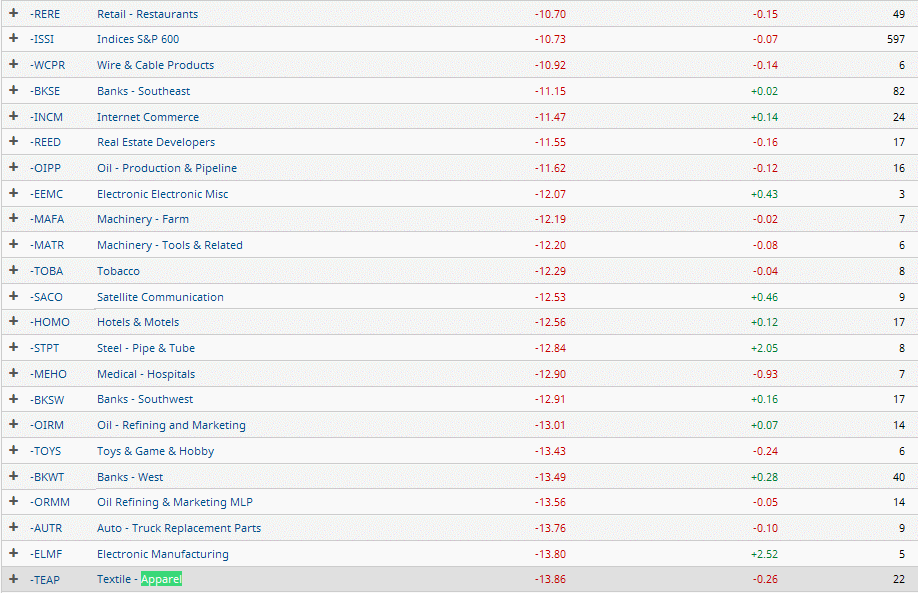
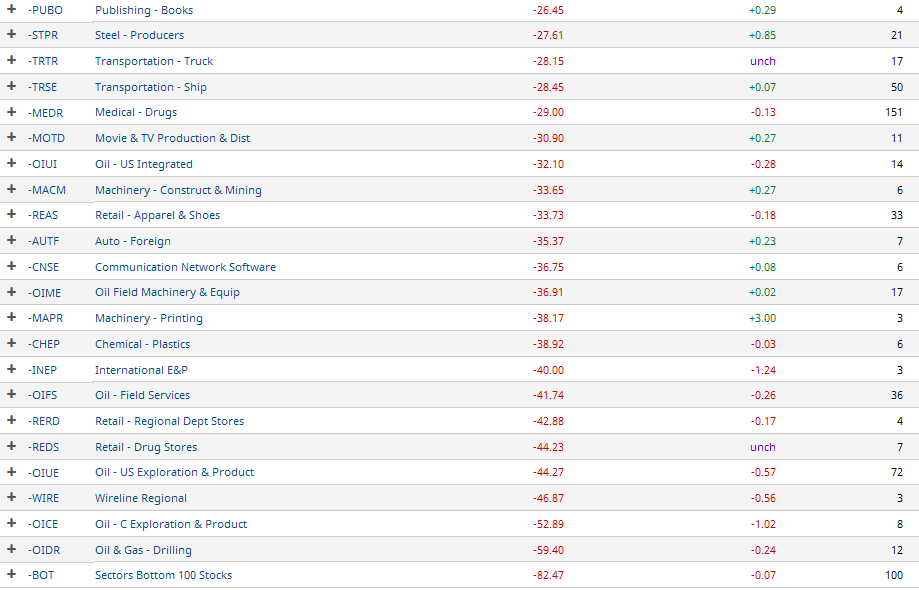
The textile/apparel industry group has been weak for dress clothes but
sporting goods apparel segment has been stronger than other apparel stocks.
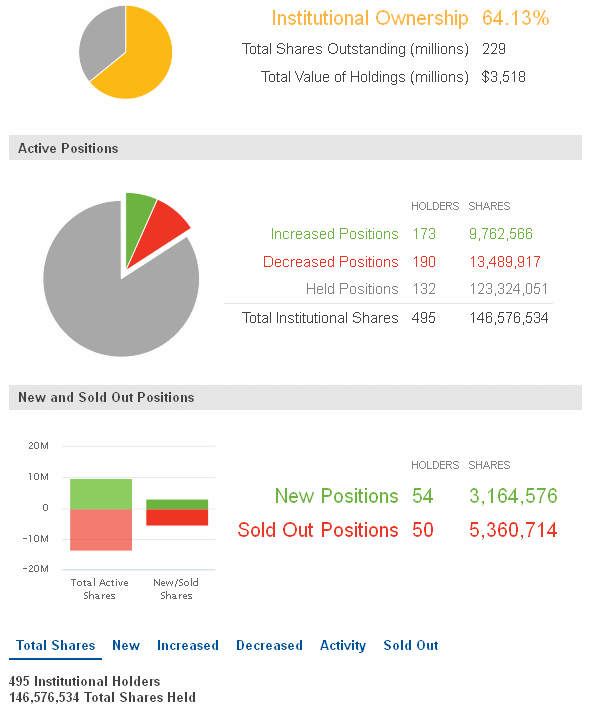
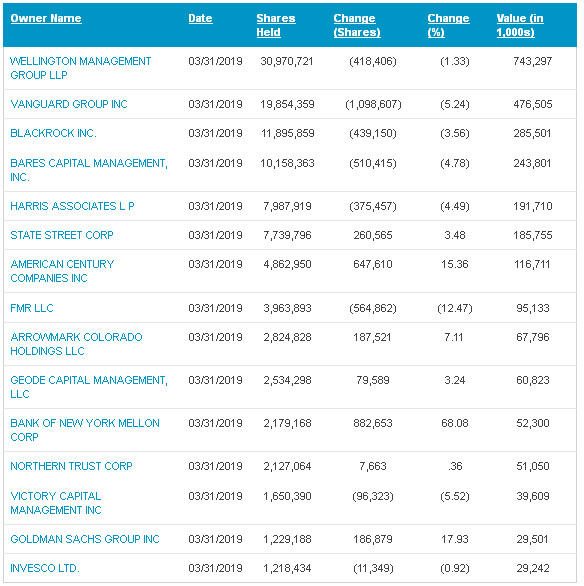
Some other considerations include institutions are strong net sellers, management
and salaries may lack corporate governance, projections by several analysts are a bit
pessimistic, the stock may have been overlooked by historic p/e measures versus the
present, recent sentiment from traders is very strong, and the stock may be classified
as a trading range, channeling, or rolling stock currently in its upper trading range..
(WAIT FOR PAGE TO LOAD COMPLETELY BEFORE LINKS WORK.)
Company Profile
Company History
News
Comparison with Peers
Bond Issue
Zenith Index
Financial Statements
Avg. P/E to Current P/E
Financial Ratios
Intrinsic Value (Disc. CashFlow)
Fair Value Estimator
Projected Earnings
Research Reports
Analysts' Opinions
Insider Activity
Institutional Activity
Sentiment
Short Interest
Standard & Poor's
Management's Discussion
Channel Potential
MACD Histogram
Intraday Chart
Val Idea
Stock Consultant
Point & Figure Chart
Wall Street Analyzer
Marketspace Chart
Time Series Forecast
Neural Network Prediction
Stock Options
Ultimate Trading Systems
Recommendation
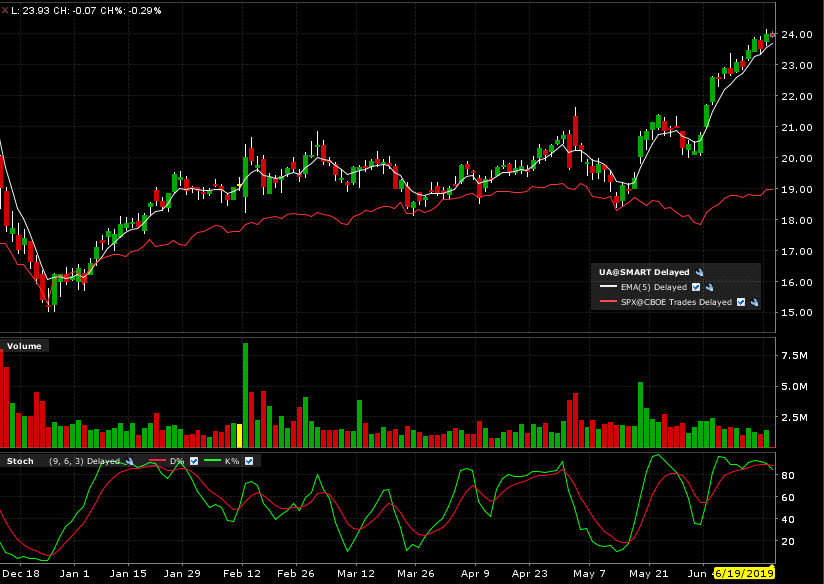





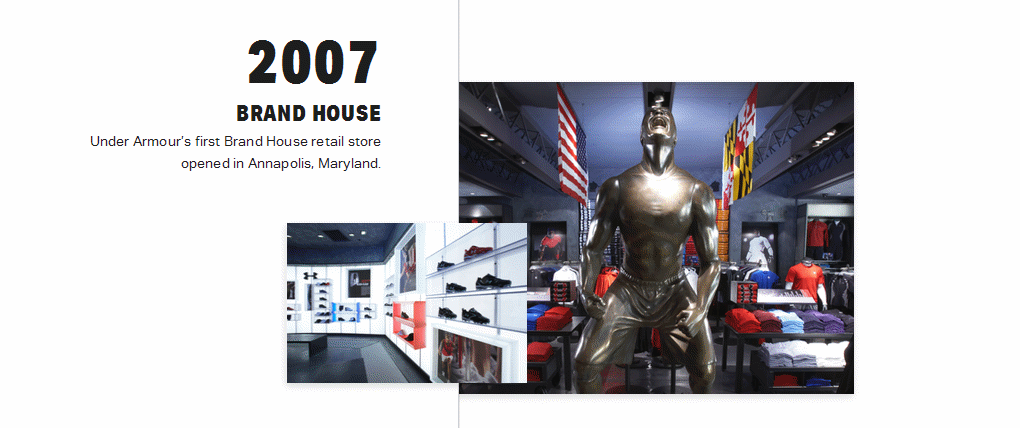
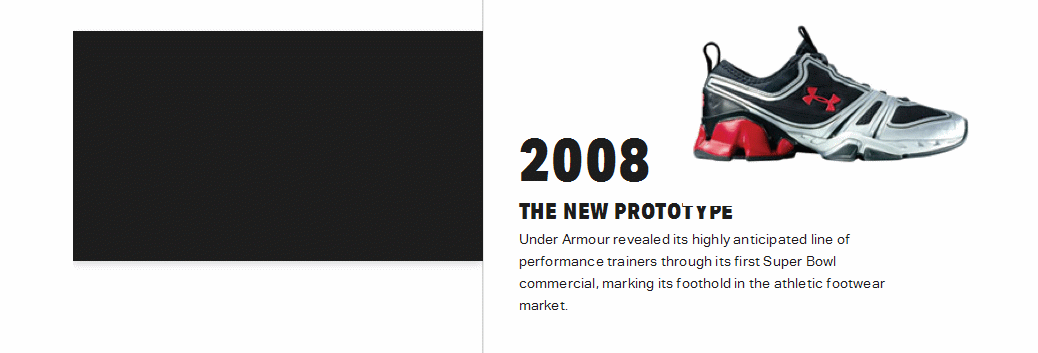

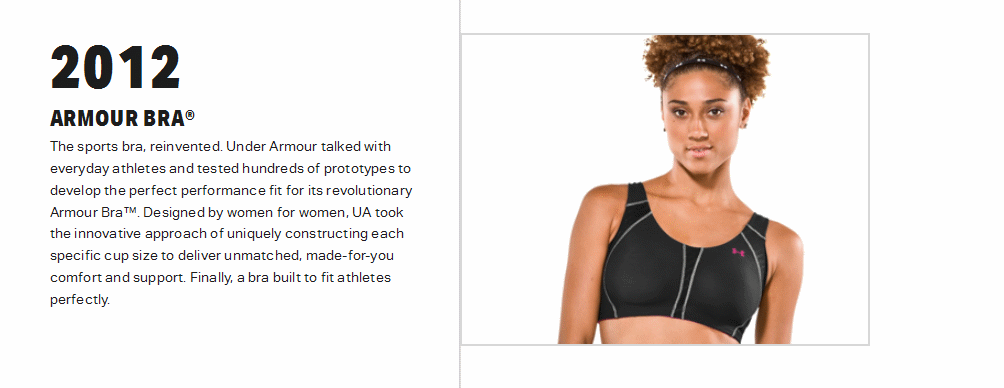


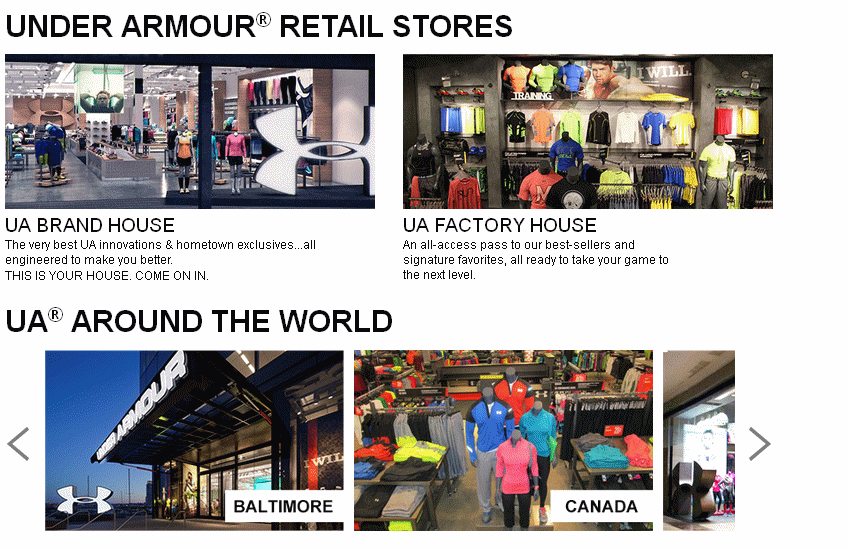
Company Profile |

Company History |
News |
Comparison |
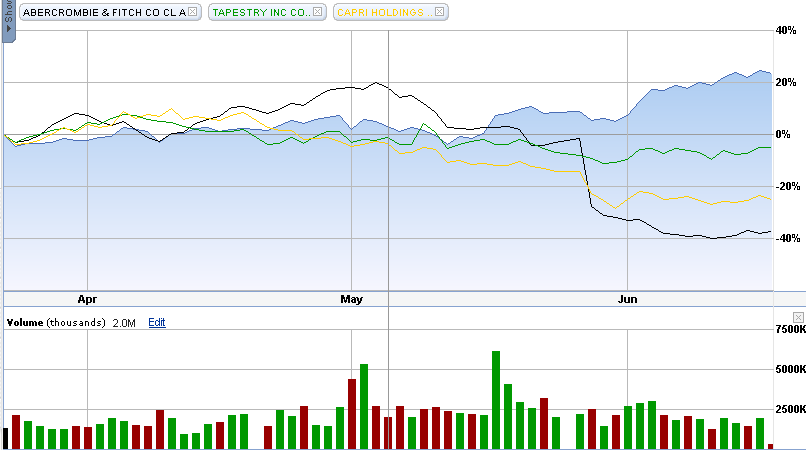
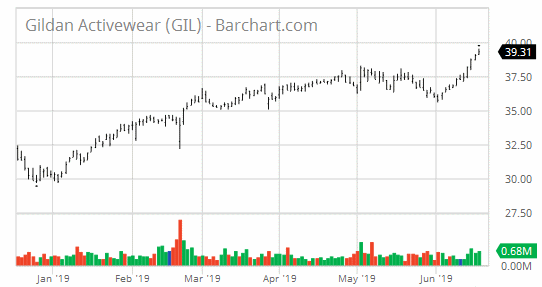
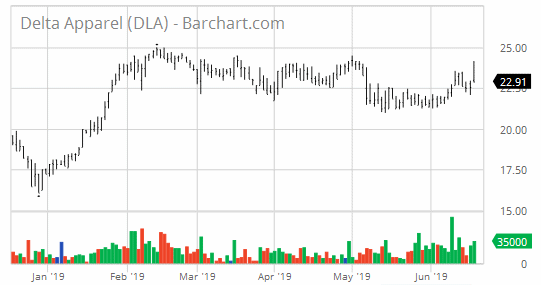
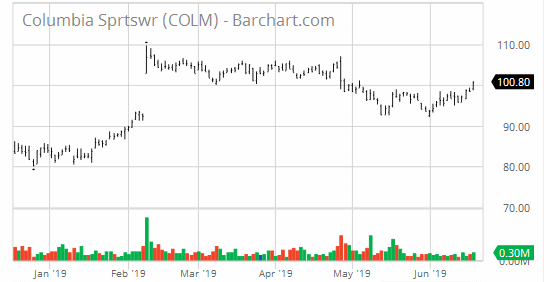
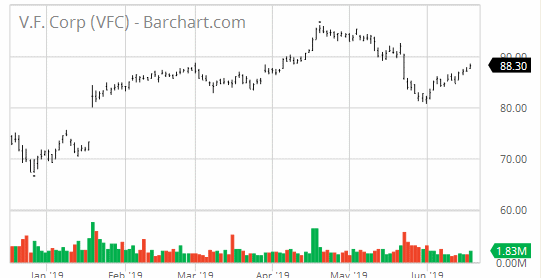
Similar Companies Performance:
Bond Issue |

Zenith Index |
Under current market conditions, a Zenith Index Score of 1.20 or above is required for a positive rating on this factor. 1.21 -1.30 is considered acceptable, 1.30-1.40 is considered strong and
> 1.40 is considered exceptionally strong. Accounting statements in this section often contain mistakes, especially in earlier years' totals, but data is deemed sufficient for us to give a rating. More accurate financial statements follow in the next section.
Under Armour, Inc. (UA)                                   Exchange: NYSE
1020 Hull Street
Baltimore, MD 21230              Sector: Consumer Cyclical
United States                    Industry: Apparel Manufacturing

Under Armour, Inc., together with its subsidiaries, develops, markets,
and distributes branded performance apparel, footwear, and accessories
for men, women, and youth primarily in North America, Europe, the Middle
East, Africa, the Asia-Pacific, and Latin America. The company offers
its apparel in compression, fitted, and loose types to be worn in hot
and cold. It also provides various footwear products, including running,
basketball, cleated, slides and performance training, sportstyle, and
outdoor footwear. In addition, the company offers accessories, which
include gloves, bags, and headwear; and digital fitness subscriptions,
as well as digital advertising through MapMyFitness, MyFitnessPal, and
Endomondo platforms. It primarily offers its products under the
HEATGEAR, COLDGEAR, UA Logo, UNDER ARMOUR, UA, ARMOUR, PROTECT THIS
HOUSE, I WILL, ARMOURBOX, ARMOUR BRA, and ARMOUR FLEECE, as well as
MapMwpya and UNDER ARMOUR CONNECTED FITNESS brands. The company sells its
products through wholesale channels, including national and regional
sporting goods chains, independent and specialty retailers, departmentstore chains,
institutional athletic departments, and leagues and teams,
as well as independent distributors; and directly to consumers through a
network of brand and factory house stores, and Website. Under Armour,
Inc. was founded in 1996 and is headquartered in Baltimore, Maryland.

Last Trade:  23.49                           52-Week Range:  23.91 -  15.05
Employees: 7,000                             Avg.Volume:   2,172,987 Shares

Corporate Governance:
Pillar scores are Audit: 1; Board: 10; Shareholder Rights: 10; Compensation: 6.
         (A lower number means less governance risk.)

EPS:  0.01    Dividend Amount: $ 0.00          Yield:  0.00%
             Ex-Dividend Date: N/A             Payout Ratio:   0.00

Key Statistics:

    Trailing P/E:   1.00              Forward P/E (est.):  45.87
                                           Target Price:  15.00

Qrtly Stock Price Growth (yoy):   8.95%               Beta:   0.00
Qrtly S&P Index   Growth (yoy):   1.60%        Short Ratio:   4.29%
    Qrtly Revenue Growth (yoy):   4.25%         Shares Out:  228550000
   Qrtly Earnings Growth (yoy):   0.00%

          Book Value:   4.55                    Debt/Equity:  63.04%
    Price/Book Value:   5.25        Operating Profit Margin:   3.80%
         Price/Sales:   2.18                  Profit Margin:   0.12%
         Market Cap:  11,362,000,000       Return on Equity:   0.32%
    Enterprise Value:  11,760,000,000      Return on Assets:   2.84%

    Operating Cash Flow:    516,420,000
         Free Cash Flow:    405,400,000


Annual Income Statement:                          (All numbers in thousands)
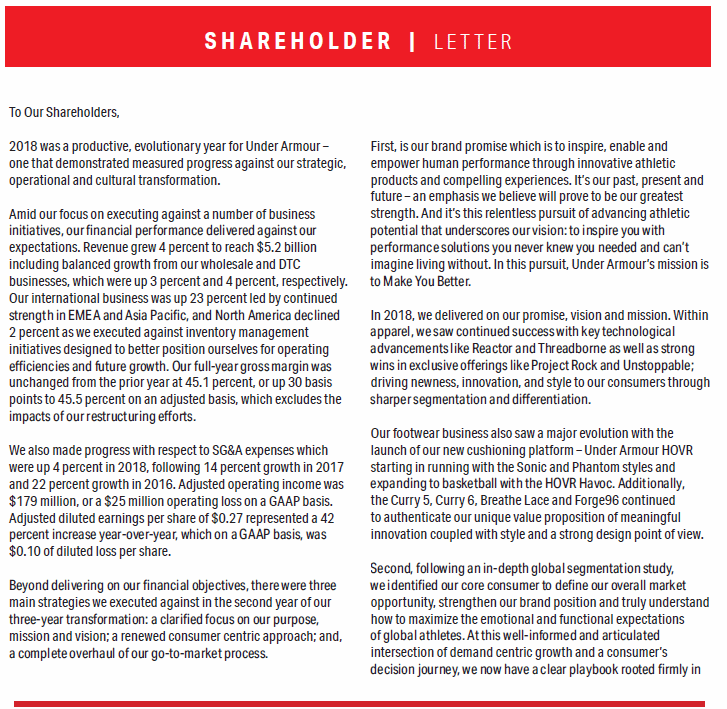
  Period Ending                             12/31/2018  12/31/2017  12/31/2016

  Total Revenue                              5,193,185   4,989,244   4,833,338
  Cost of Revenue                            2,831,913   2,732,753   2,584,724
  Gross Profit                               2,361,272   2,256,491   2,248,614

Operating Expenses:
  Research & Development                             0           0           0
  Selling, General & Administrative          2,176,239   2,091,322   1,818,143
  Non-Recurring Expenses                             0           0           0
  Other Operating Expenses                           0           0           0
  Total Operating Expenses                   5,014,252   4,832,275   4,415,867

Operating Income or Loss                       178,933     156,969     417,471

Income from Continuing Operations:
  Total Other Income/Expenses Net             -245,787    -167,278     -29,189
  Earnings Before Interest & Taxes             178,933     156,969     417,471
  Interest Expense                             -33,568     -34,538     -26,434
  Income Before Taxes                          -66,854     -10,309     388,282
  Income Tax Expense                           -20,552      37,951     131,303
  Minority Interest                                  0           0           0

Net Income from Continuing Op.s                -46,302     -48,260     256,979

Non-recurring Events:
  Discontinued Operations                            0           0           0
  Extraordinary Items                                0           0           0
  Effect of Accounting Changes                       0           0           0
  Other Items                                        0           0           0
  Net Income                                   -46,302     -48,260     256,979
  Preferred Stock & Other Adjustments                0           0           0

Net Income Avail to Common Shares              -46,302     -48,260     197,979


Annual Cash Flow Statement:                   (All numbers in thousands)
  Period Ending                         12/31/2018    12/31/2017    12/31/2016

  Net Income                               -46,302       -48,260       256,979

Operating Activities:
  Depreciation                             181,768       173,747       144,770
  Adjustments to Net Income               -203,333       249,222       132,323
  Changes in Accounts Recv'bls             186,834       -79,106      -249,853
  Changes in Liabilities                    26,413       145,695       202,446
  Changes in Investories                   109,919      -222,391      -148,055
  Changes in other Oper'g Acts             331,880        57,717        44,725

Total Cash Flow f Operations               628,230       237,460       366,623

Investing Activities:
  Capital Exenditures                     -170,385      -281,339      -386,746
  Investments                              -39,207       -39,207         6,482
  Other Cash Flows fr Investing             -4,597        -1,648          -875

Total Cash Flows from Investing           -202,904      -282,987      -381,139

Financing Activities:
  Dividends Paid                                 0             0        -2,927
  Sale of Purchase of Stock                      0             0             0
  Net Borrowings                          -190,000        98,000       156,851
  Other Cash Flows fr Financing                295           295          -875

Total Cash Flows from Financing           -189,868       106,759       146,114

  Effect of Exchange Rate Chg               12,467         4,178        -8,725

Change in Cash & Cash Equiv.               247,925        65,410       122,873


Annual Balance Sheets:                              (All Numbers in Thousands)
  Period Ending                          12/31/2018    12/31/2017    12/31/2016
Current Assets:
  Cash & Cash Equivalents                   557,403       312,483       250,470
  Short Term Investments                          0             0             0
  Net Receivables                           665,646       609,670       622,685
  Inventory                               1,019,496     1,158,548       917,491
  Other Current Assets                      142,057         5,652        15,200
  Total Current Assets                    2,384,602     2,086,353     1,805,846

  Long-Term Investments                       1,600         1,100        11,700
  Property, Plant & Equipt                  826,868       885,774       804,211
  Goodwill                                  546,494       555,674       563,591
  Intangible Assets                          41,793        46,995        64,310
  Accumulated Amortization                        0             0             0
  Other Assets                              234,639       179,145       235,366
  Deferred LT Asset Charges                 112,420        82,801       136,862

Total Assets                              4,245,022     4,006,367     3,644,331

Current Liabilities:
  Accounts Payable                          560,884       561,108       409,679
  Current Portion LT Debt                    25,000        27,000        27,000
  Other Current Liabilities                 389,678        50,426        40,387
  Total Current Liabilities               1,315,977     1,060,375        685,816

  Long Term Debt                            703,834       765,046       790,808
  Other Liabilities                         208,340       162,304       136,807
  Deferred LT Liab. Charges                       0             0        24,200
  Minority Interest                               0             0             0
  Negative Goodwill                               0             0             0

Total Liabilities                         2,228,151     1,987,725     1,613,431

Stockholder Equity:
  Misc. Options, Warrants                         0             0             0
  Redeemable Preferred Stock                      0             0             0
  Preferred Stock                                 0             0             0
  Common Stock                                  148           146           145
  Retained Earnings                       1,139,082     1,184,441     1,259,414
  Treasury Stock                            -38,987       -38,211       -52,143
  Capital Surplus                           916,628       872,266       823,484
  Other Stockhohlder Equity                 -38,987       -38,211       -52,143
  Total Stockholder Equity                2,016,871     2,018,642     2,030,900

Net Tangible Assets                       1,428,584     1,415,973     1,402,999


Under Armour, Inc. (UA)                     [Indices near +3.0, near zero,
                                            or < zero bear special attention.]
P/E Ratio Tests:
P/E Ratio < 28?            3.0000          P/E Ratio > 5?             0.0000
P/E Ratio Vs Growth Rate:  0.0000          Forward P/E Ratio < 28?    0.6104
Price/Sales Ratio < 2.3?   1.0550          Inventory/Sales < 5%?      0.2547
Sales < $1 Billion?        0.1926          Operating Margin < 7.5%?   1.9737

Balance Sheet Tests:
Debt/Equity < 0.40?        0.6345          Long-Term Debt Service:    2.8655
LTD Being Reduced?         3.0000          Short-Term Debt Service:  -3.0000
Current Ratio > 2?         0.9060          Working Capital >= 1.5?    0.8388
Leverage Ratio < 20%?      0.6776          Debt/Assets < 1?           3.0000
Quick Ratio > 1?           3.0000          Inventory Turnover > 1?    0.2033
Share Equity Increase:     1.9931          Market Cap.< 1.5 Billion?  0.1320
                                           Intangibles < 3% Assets?   0.2165
Income Tests:
Profit Margin < 7.5%?      0.0160          EPS Annual Growth > 10%?   0.1042
Dividend Yield > 2.0%?     0.0000          EPS 3-yr Growth > 15?     -0.6414
Enterprise Value/Revenue   2.1879          EPS Growth Consistent?     0.0000
Enterprise Value/EBITDA:   3.0000          Collection < 45 days?      0.9619
EPS Qrtly Growth > 10%?    0.0000          Gross Pft/Cur. LTD > 1?    3.0000
                                           Borrowing Int. Rate < 6%? -1.2580
Stock Performance Tests:
Volatility > 25%?          1.4822          % Held by Insiders < 5%?   0.3213
Beta > 1.25?               0.0000          % Held by Institut. < 50?  0.7365
50 Da MA > 200 Da MA?      0.1788          % Held by Institut. > 30?  2.2630
52-Wk Change vs. S&P 500:  2.1059          Short Ratio > 5?           0.8580
Price/Book Value < 3?      0.5811          Short % of Float > 20?     0.0000
Return on Assets > 17%?    0.1671          Average Volume > 100,000?  3.0000

Cash Flow Tests:
Oper. C.F. > Lever'd C.F:  1.2739          Positive Free Cash Flow?   3.0000
Positive Oper. Cash Flow?  3.0000          Price to C.F.Ratio < 14?:  1.2581
                                           Cash Flow / Assets > 10%?  2.4052

UA     Under Armour, Inc.                  Overall Zenith Index:      1.0541
Financial Statements |
UNDER ARMOUR INC C (UA) INCOME STATEMENT Fiscal year ends in December. USD in thousan 2014-12 2015-12 2016-12 2017-12 2018-12 TTM Revenue 3,084,370 3,963,313 4,825,335 4,976,553 5,193,185 5,212,537 Cost of revenue 1,572,164 2,057,766 2,584,724 2,737,830 2,852,714 2,850,732 Gross profit 1,512,206 1,905,547 2,240,611 2,238,723 2,340,471 2,361,805 Operating expenses Sales, General and administrative 1,158,251 1,497,000 1,823,140 2,086,831 2,182,339 2,177,233 Restructuring, merger and acquisition 0 0 0 52,671 183,149 145,669 Other operating expenses 0 0 0 -52,671 -183,149 -145,669 Total operating expenses 1,158,251 1,497,000 1,823,140 2,086,831 2,182,339 2,177,233 Operating income 353,955 408,547 417,471 151,892 158,132 184,572 Other income (expense) -11,745 -21,862 -29,189 -162,201 -225,920 -187,669 Income before taxes 342,210 386,685 388,282 -10,309 -67,788 -3,097 Provision for income taxes 134,168 154,112 131,303 37,951 -20,552 -8,328 Other income 0 0 0 0 934 1,188 Net income from continuing operations 208,042 232,573 256,979 -48,260 -46,302 6,419 Net income 208,042 232,573 256,979 -48,260 -46,302 6,419 Preferred dividend 0 0 59,000 0 0 0 Net income available to common shareholders 208,042 232,573 197,979 -48,260 -46,302 6,419 Earnings per share Basic 0.49 0.54 0.45 -0.11 -0.10 0.02 Diluted 0.47 0.53 0.45 -0.11 -0.10 0.02 Weighted average shares outstanding Basic 426,454 430,996 436,330 440,729 445,815 447,489 Diluted 438,760 441,736 444,848 440,729 445,815 448,360 ____________________________________________________________________________________________________________________________________________ UNDER ARMOUR INC C (UA) BALANCE SHEET Fiscal year ends in December. USD in thousan 2014-12 2015-12 2016-12 2017-12 2018-12 Assets Current assets Cash Total cash 593,175 129,852 250,470 312,483 557,403 Receivables 279,835 433,638 622,685 609,670 652,546 Inventories 536,714 783,031 917,491 1,158,548 1,019,496 Deferred income taxes 52,498 0 0 0 0 Prepaid expenses 87,177 152,242 174,507 256,978 364,183 Total current assets 1,549,399 1,498,763 1,965,153 2,337,679 2,593,628 Non-current assets Property, plant and equipment Gross property, plant and equipment 522,376 831,764 1,201,267 1,412,758 1,482,463 Accumulated Depreciation -216,812 -293,233 -397,056 -526,984 -655,595 Net property, plant and equipment 305,564 538,531 804,211 885,774 826,868 Goodwill 123,256 585,181 563,591 555,674 546,494 Intangible assets 26,230 75,686 64,310 46,995 41,793 Deferred income taxes 33,570 92,157 136,862 82,801 112,420 Other long-term assets 57,064 78,582 110,204 97,444 123,819 Total non-current assets 545,684 1,370,137 1,679,178 1,668,688 1,651,394 Total assets 2,095,083 2,868,900 3,644,331 4,006,367 4,245,022 Liabilities and stockholders' equity Liabilities Current liabilities Short-term debt 28,951 42,000 27,000 152,000 25,000 Accounts payable 210,432 200,460 409,679 561,108 560,884 Accrued liabilities 147,681 192,935 208,750 296,841 340,415 Other current liabilities 34,563 43,415 40,387 50,426 389,678 Total current liabilities 421,627 478,810 685,816 1,060,375 1,315,977 Non-current liabilities Long-term debt 255,250 627,000 790,388 765,046 703,834 Other long-term liabilities 67,906 94,868 137,227 162,304 208,340 Total non-current liabilities 323,156 721,868 927,615 927,350 912,174 Total liabilities 744,783 1,200,678 1,613,431 1,987,725 2,228,151 Stockholders' equity Common stock 71 72 145 146 148 Additional paid-in capital 508,350 636,630 823,484 872,266 916,628 Retained earnings 856,687 1,076,533 1,259,414 1,184,441 1,139,082 Accumulated other comprehensive income -14,808 -45,013 -52,143 -38,211 -38,987 Total stockholders' equity 1,350,300 1,668,222 2,030,900 2,018,642 2,016,871 Total liabilities and stockholders' equity 2,095,083 2,868,900 3,644,331 4,006,367 4,245,022 ____________________________________________________________________________________________________________________________________________ UNDER ARMOUR INC C (UA) Statement of CASH FLOW Fiscal year ends in December. USD in thousan 2014-12 2015-12 2016-12 2017-12 2018-12 TTM Cash Flows From Operating Activities Net income 208,042 232,573 256,979 -48,260 -46,302 6,419 Depreciation & amortization 72,093 100,940 144,770 173,747 181,768 182,134 Investment/asset impairment charges 0 0 0 71,378 9,893 7,645 Deferred income taxes -17,584 -4,426 -43,004 55,910 -38,544 -29,413 Stock based compensation 50,812 60,376 46,149 39,932 41,783 46,139 Change in working capital -137,680 -507,866 -184,802 -140,646 696,097 274,265 Accounts receivable -101,057 -191,876 -249,853 -79,106 186,834 46,089 Inventory -84,658 -278,524 -148,055 -222,391 109,919 250,102 Prepaid expenses -33,345 -76,476 -25,284 -55,503 -107,855 30,260 Accounts payable 49,137 -22,583 202,446 145,695 26,413 -85,121 Accrued liabilities 28,856 64,126 52,656 109,823 134,594 39,022 Other working capital 3,387 -2,533 -16,712 -39,164 346,192 -6,087 Other non-cash items 43,350 74,299 84,395 82,002 -216,465 29,228 Net cash provided by operating activities 219,033 -44,104 304,487 234,063 628,230 516,417 Cash Flows From Investing Activities Investments in property, plant, and equipmen -140,528 -298,928 -386,746 -281,339 -170,385 -150,366 Property, plant, and equipment reductions 0 0 0 0 11,285 0 Acquisitions, net -10,924 -539,460 0 0 -39,207 0 Purchases of investments 0 -103,144 -24,230 0 0 0 Sales/Maturities of investments 0 96,610 30,712 0 0 0 Other investing activities -860 -2,553 -875 -1,648 -4,597 -32,519 Net cash used for investing activities -152,312 -847,475 -381,139 -282,987 -202,904 -182,885 Cash Flows From Financing Activities Debt issued 250,000 650,000 1,327,601 763,000 505,000 365,000 Debt repayment -118,722 -265,202 -1,170,750 -665,000 -695,000 -694,500 Excess tax benefit from stock based compe 0 0 0 75 0 0 Dividend paid 0 0 -2,927 0 0 0 Other financing activities 51,028 55,280 52,071 8,684 132 -5,802 Net cash provided by (used for) financing 182,306 440,078 205,995 106,759 -189,868 -335,302 Effect of exchange rate changes -3,341 -11,822 -8,725 4,178 12,467 9,741 Net change in cash 245,686 -463,323 120,618 62,013 247,925 7,971 Cash at beginning of period 347,489 593,175 129,852 250,470 318,135 290,185 Cash at end of period 593,175 129,852 250,470 312,483 566,060 298,156 Free Cash Flow Operating cash flow 219,033 -44,104 304,487 234,063 628,230 516,417 Capital expenditure -140,528 -298,928 -386,746 -281,339 -170,385 -150,366 Free cash flow 78,505 -343,032 -82,259 -47,276 457,845 366,051 ____________________________________________________________________________________________________________________________________________
Average to Current P/E Ratios |
              (UA)     Under Armour Inc. Cl C

                               2014    2015    2016    2017    2018

          Annual Earnings:     0.95    0.53    0.45   -0.11   -0.10
Average Price During Year:    29.20   42.31   36.87   17.87   17.17

                P/E Ratio:    30.74   79.83   81.94  162.50  171.67

 Average 5-Year P/E Ratio  = 105.34
             Current Price =  23.85

Previous 5 Quarter Earnings:  -0.07   -0.21    0.17    0.01    0.05

          Current Annualized (Last Four Quarters) Earnings =   0.23
                                                           ________
                                 Average PE / Current PE =     1.02
                                                           --------

                                      ...a number above 1.00 is good
                                                1.00 or below is bad
Financial Ratios |
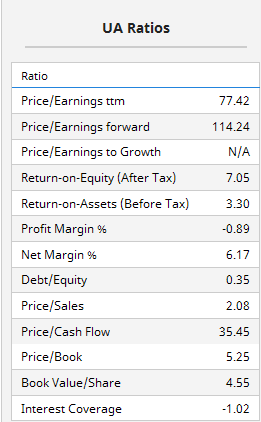
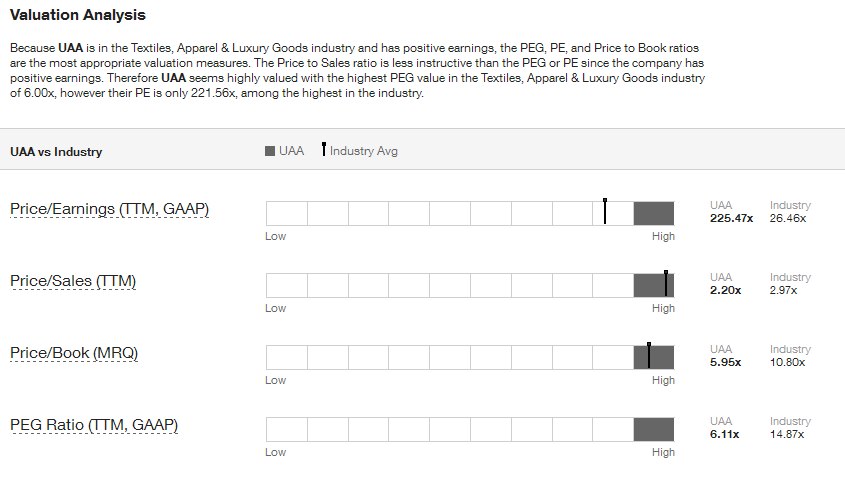
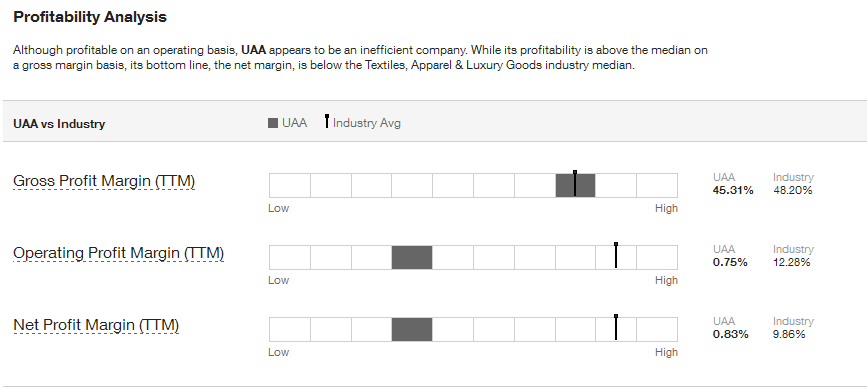
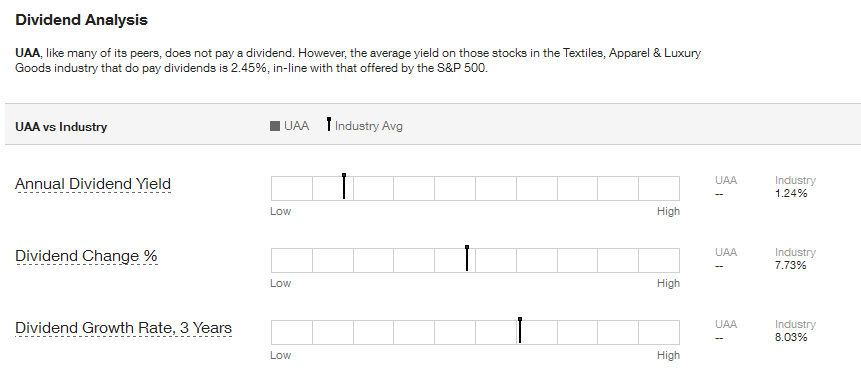
. . . . . . . . . . . . Lowest to Highest, Compared to Industry
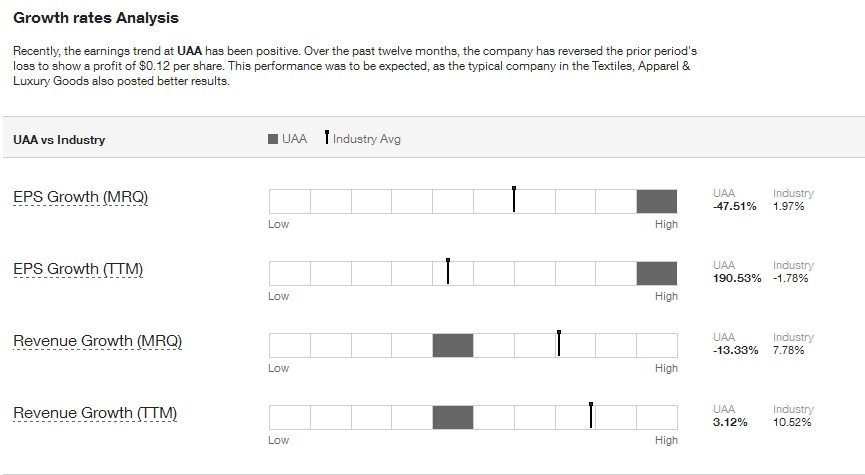
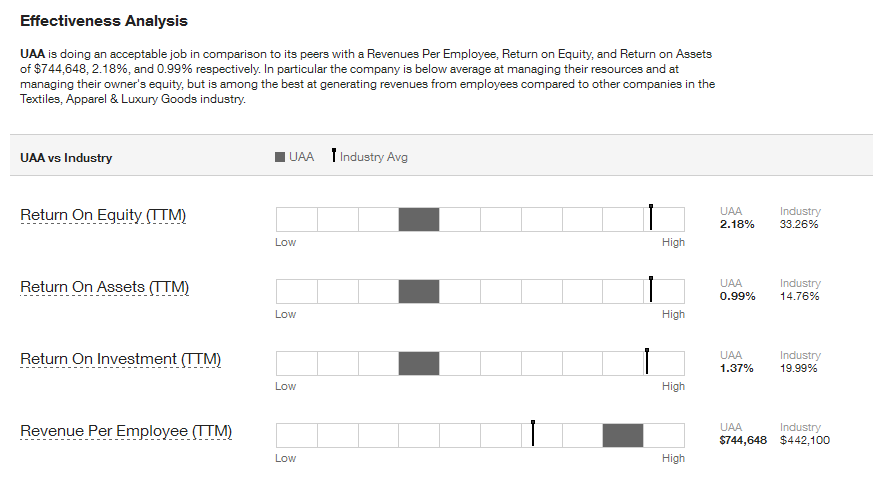
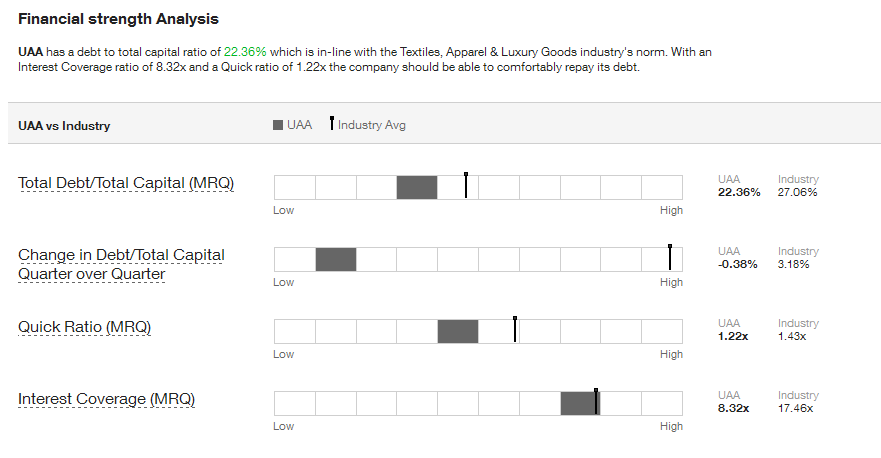
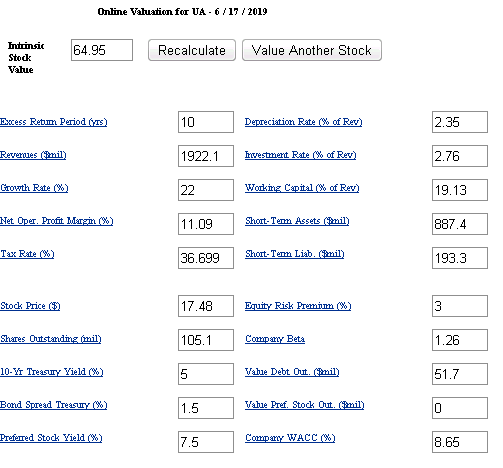
Intrinsic Value (DCF) |
Intrinsic Value by Discounted Cash Flow Method:
Fair Value Estimator |
Fair Value Estimate:

Projected Earnings |

Research Reports |
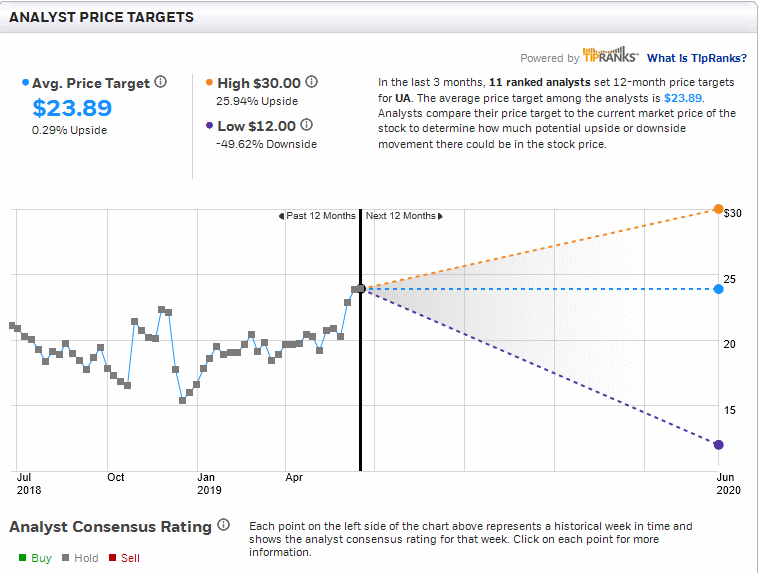
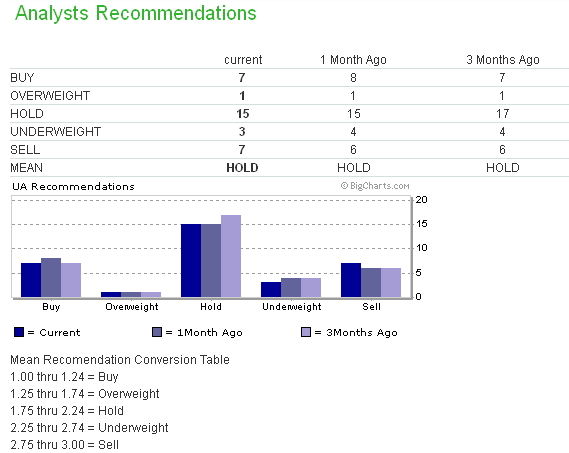
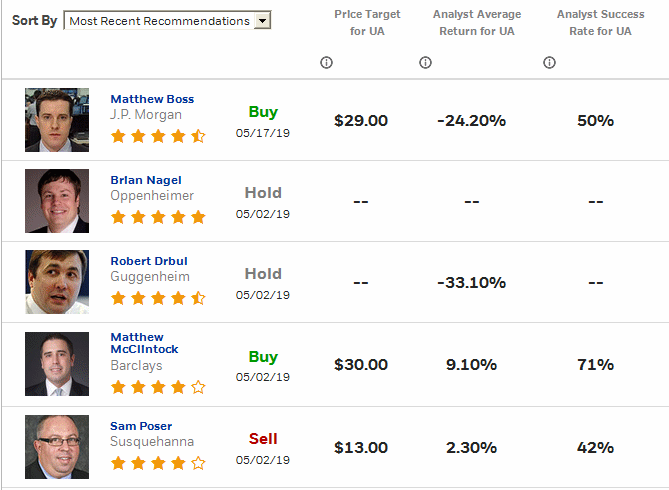
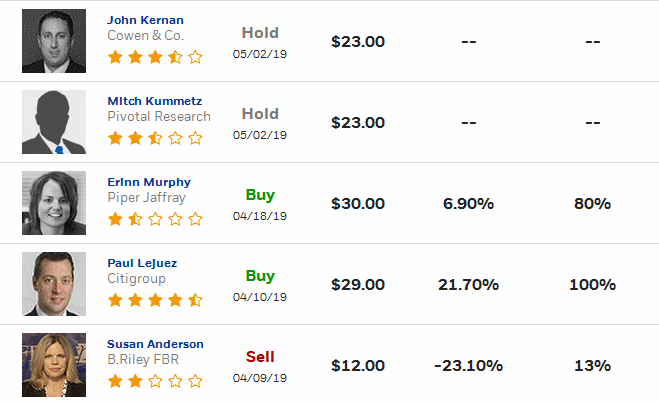
Analysts' Opinions |

Insider Activity |
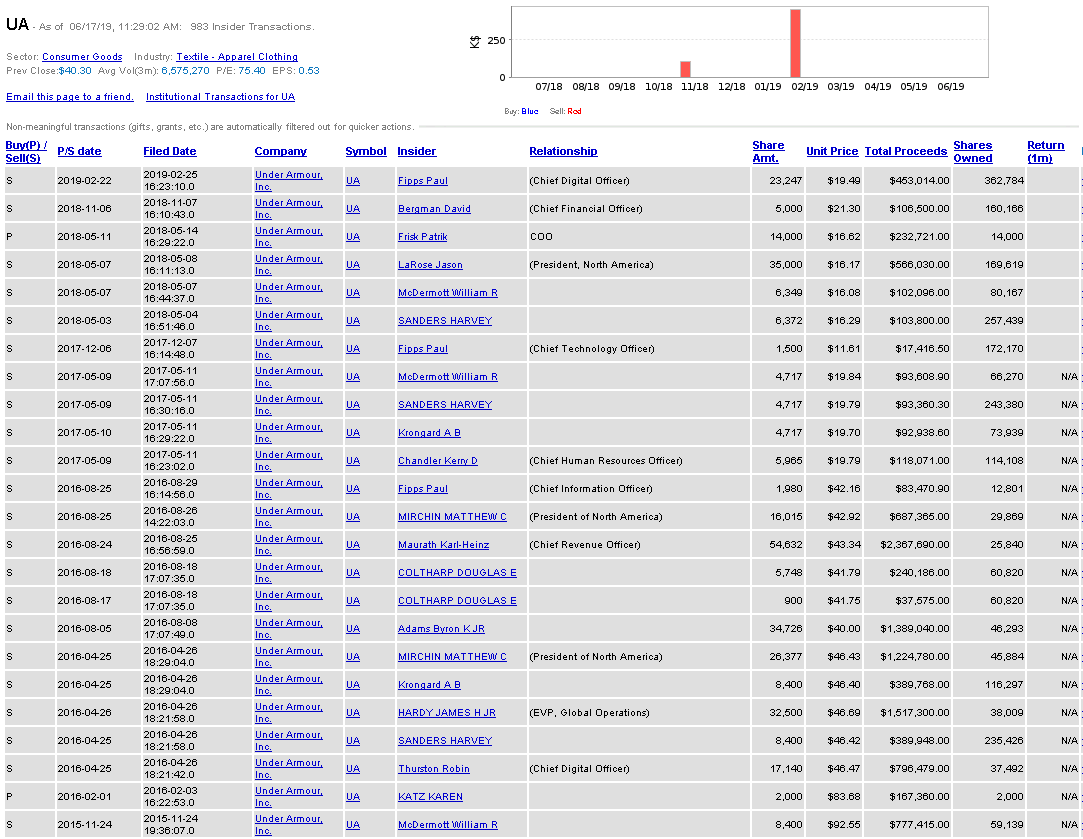

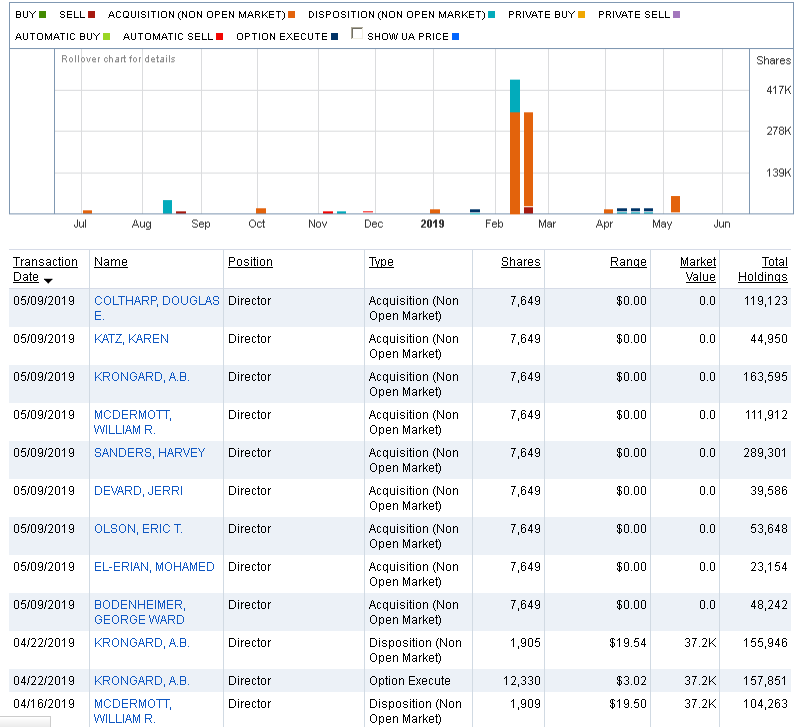
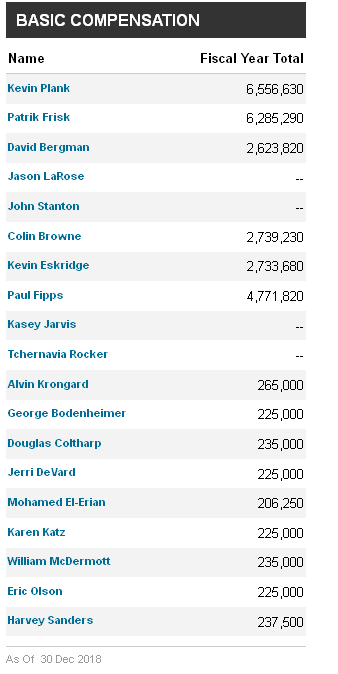
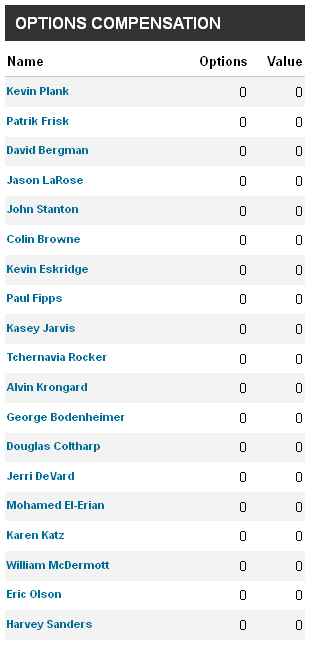
Institutional Activity |
Institutional Orders to Buy or Sell:
Sentiment |
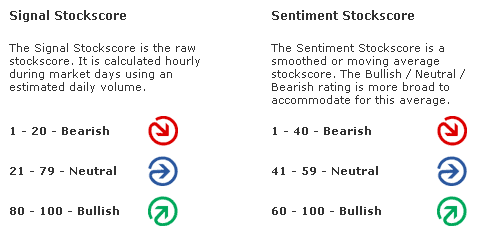
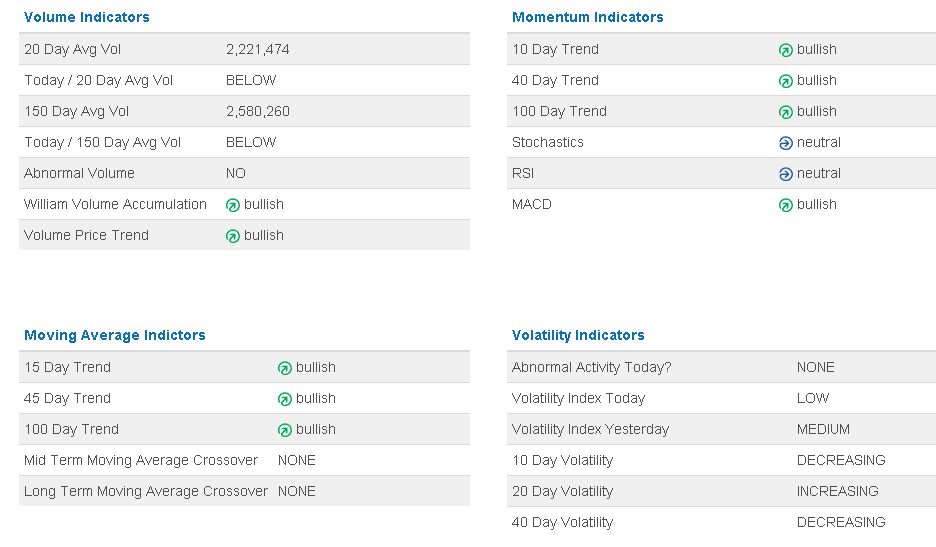
Zenith uses the "sentiment" score above or below 50 to award a positive or negative point in the Decision Matrix.


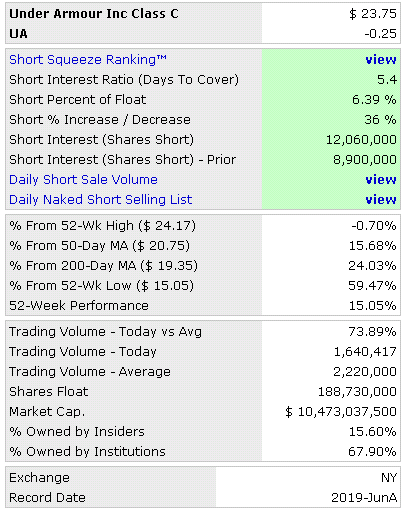
Short Interest Ratio |
As the short interest rises as a percentage of average daily share volume (Days to Cover), this is considered a measure of negative sentiment. Similarly, a decrease in that percentage is considered positive sentiment.

Standard & Poor's |
Management's Discussion of Results of Operations Excerpts |
Channeling Potential |
The summary below includes a value for `Degree,' which refers on a
scale of 1 to 10 the range of a channel in the period under consi-
deration compared to the total range of price movement. It also looks
for the last closing price to be within the channel, otherwise zeroed.
The `Index' is the `Degree' weighted for volatility.  Generally, the
the higher the index, the more suitable is the stock for trading as
a `rolling stock' between channel high and low points.

Results for UNDER ARMOUR INC.:
Symbol? UA
Total Months Available:  39
       Months in Cycle?   4

Months Covered by Periods:  12

Period 1           Period 2          Period 3
   H1      L1        H2      L2        H3      L3
  22.68   17.04     23.28   15.05     23.39   18.16

RANGE   =  23.39  TO   15.05            Close =  23.49
CHANNEL =  22.68  TO   18.16           Degree =   5
Volatility =  19.24%                    Index =   9
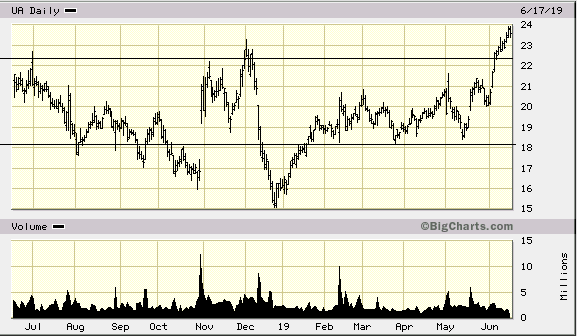
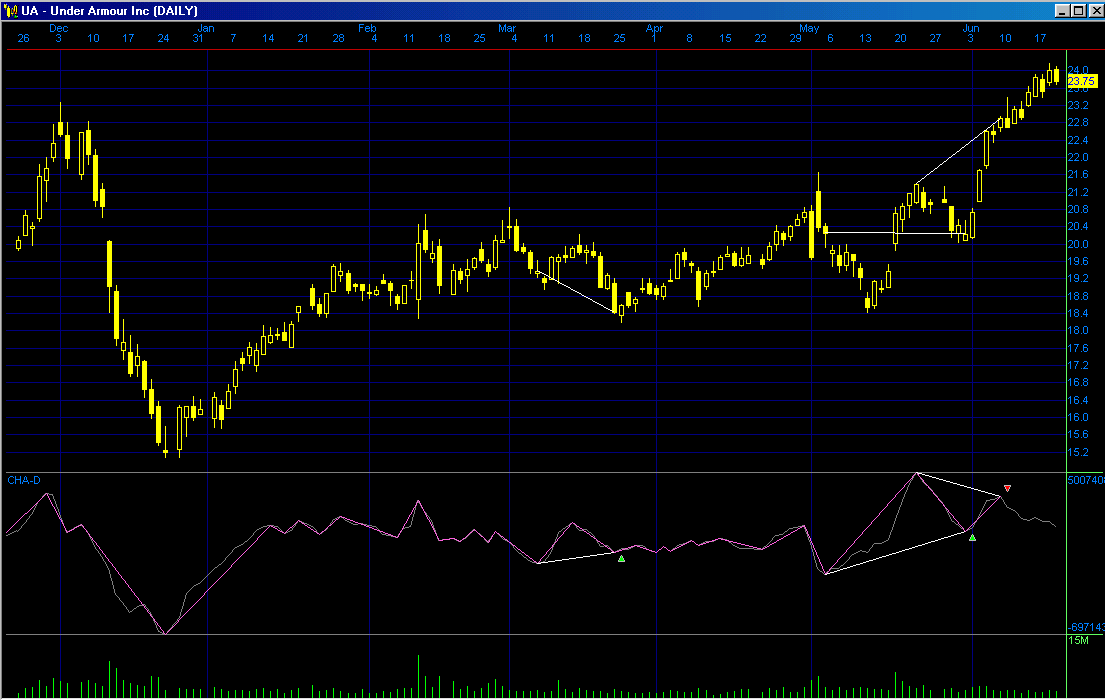
MACD Histogram Divergence |
The theory is that connecting the two most recent peaks or valleys of the MACD histogram will signal the direction of the next major move.
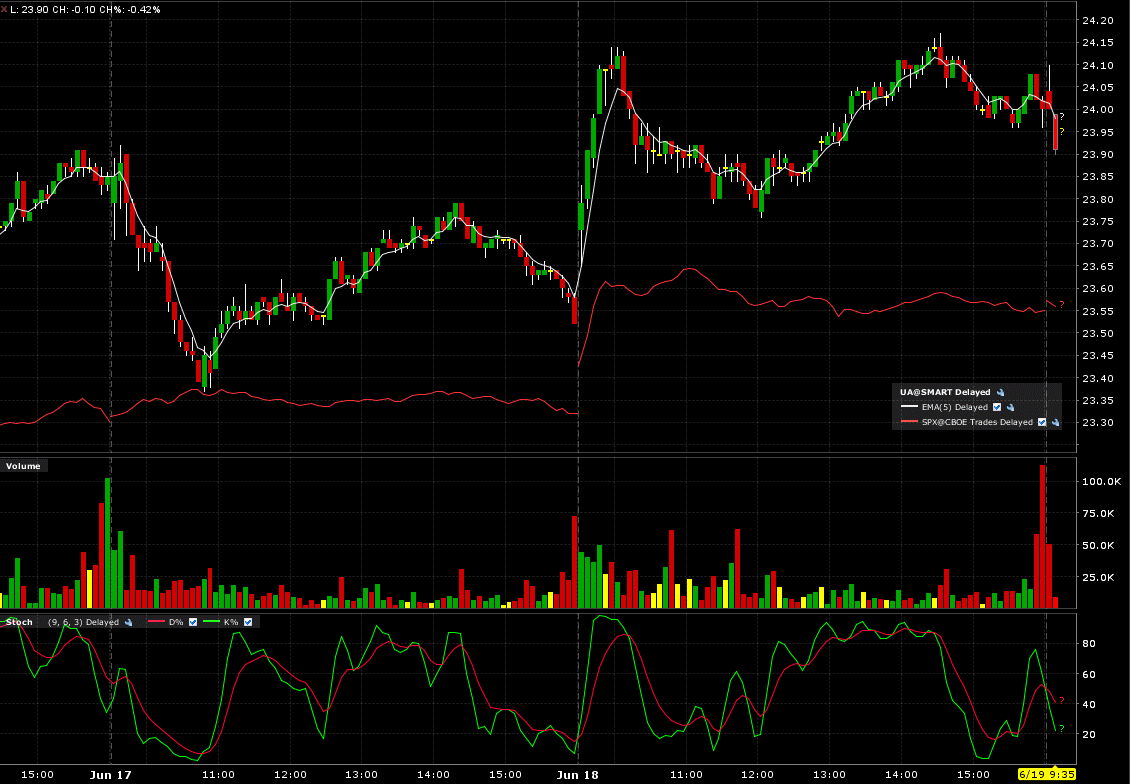
Intraday Chart |
2 Days:
Val Idea |
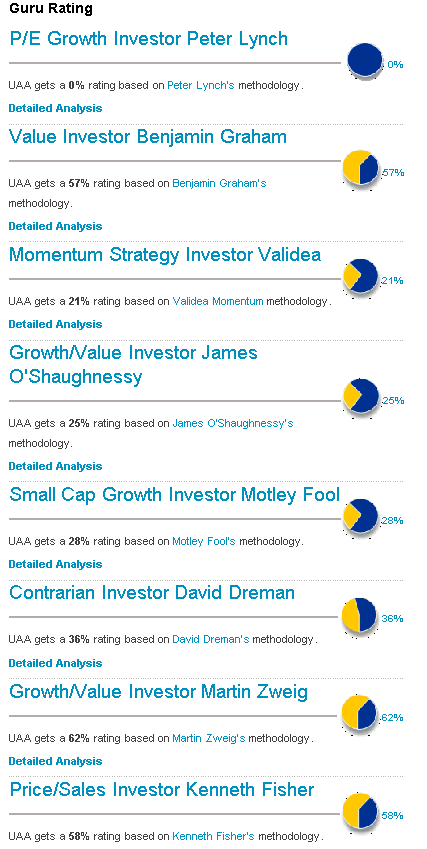
3out of 8 favorable, (negative opinion.)
Stock Consultant |
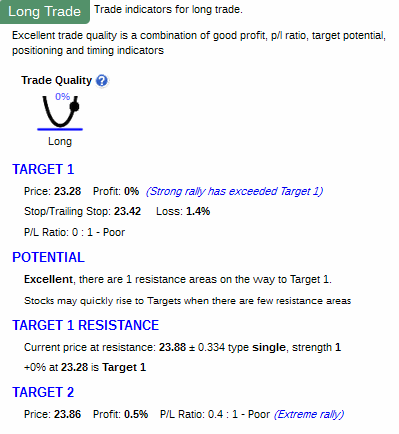
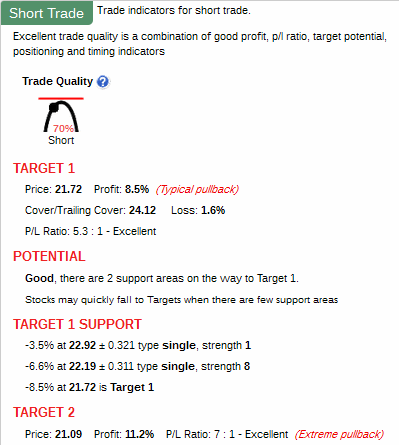
Point & Figure Chart |
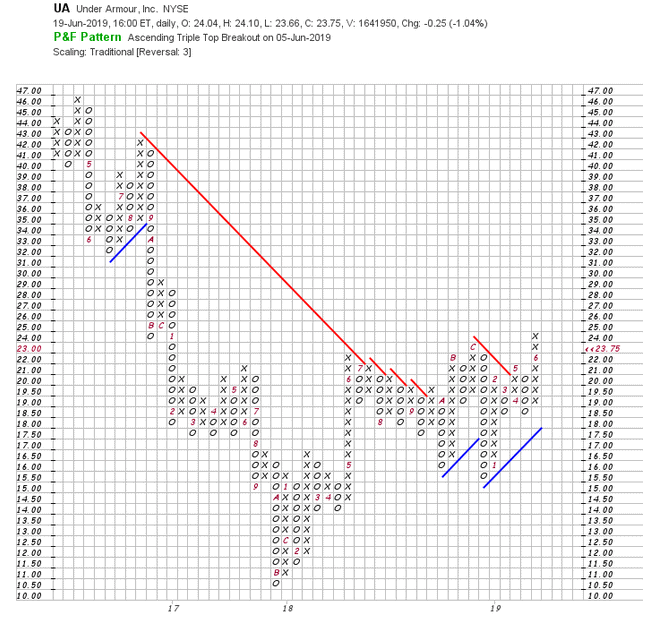
Wall Street Analyzer |
Marketspace Chart |
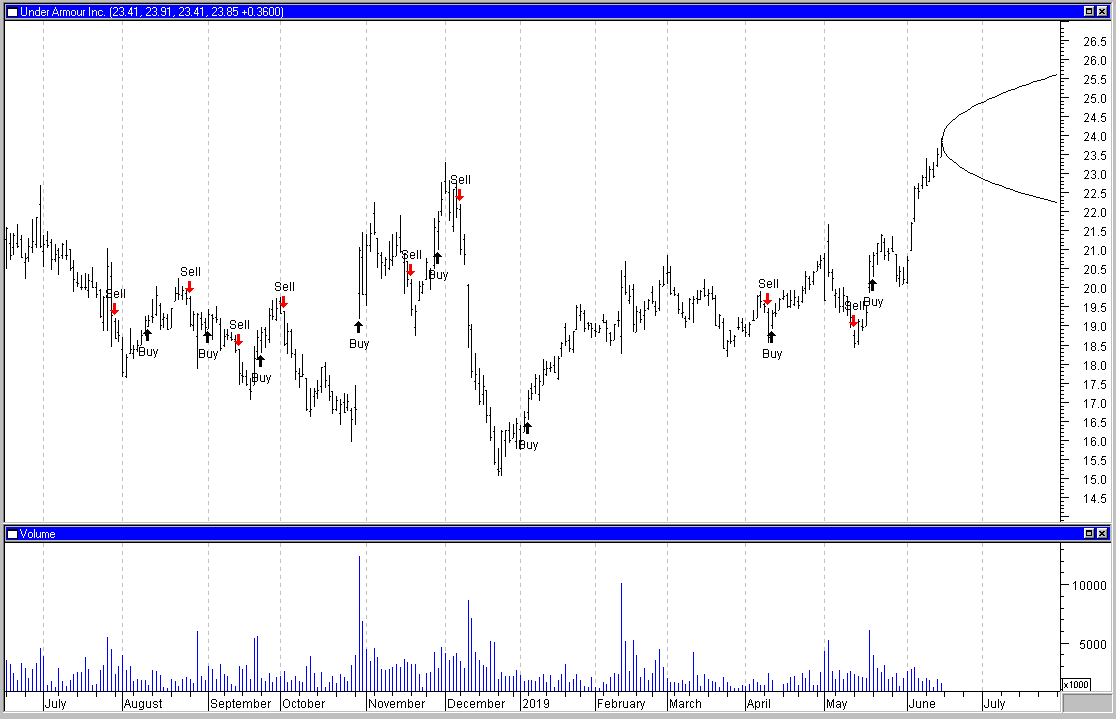
Time Series Forecast |
Neural Network Prediction |
"Neurostock" can only track long trades. Therefore its performance, as tracked by itself on stocks which are consistently falling, may not appear as good as it could if each "sell" signal were a "short sale."

![]()
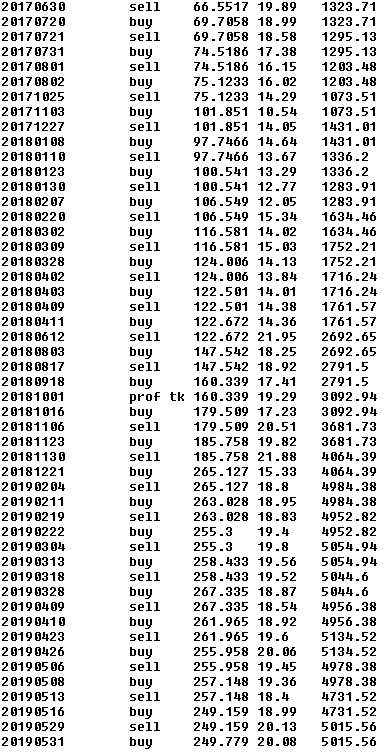

Ultimate Trading Systems |
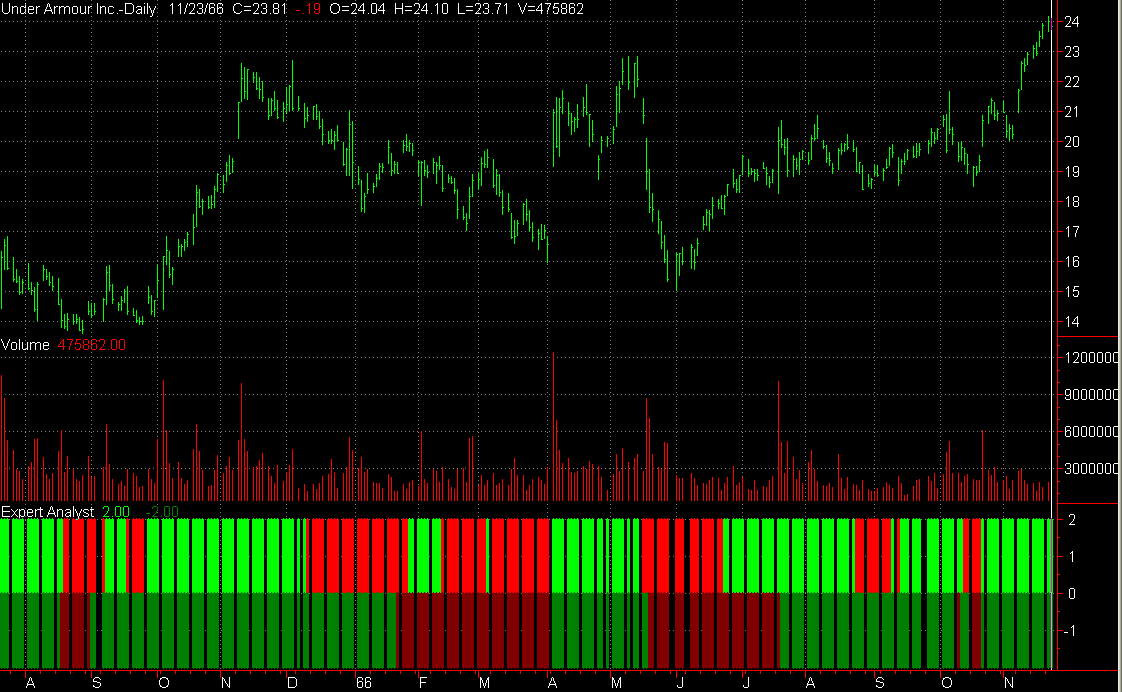
2 out of 3 of the ultimate systems favor an upmove.
System Below:
Short term outlook: Positive: Bright Green, Negative: Bright Red
Long term outlook: Postive: Dark Green, Negative: Dark Red.

Recommendation |
| Factors | Weighted Points |
|---|---|
| News | + 1 |
| Comparison | - 1 |
| Industry | - 1 |
| Bond Issue | 0 |
| Zenith Index | - 1 |
| Non-GAAP vs. GAAP Earnings | + 1 |
| Cash Flow | + 1 |
| Average to Current P/E | + 1 |
| Ratios | - 1 |
| Intrinsic Value DCF | + 1 |
| Fair Value Estimator | - 1 |
| Projected Earnings | + 1 |
| Research Reports | - 1 |
| Analysts | - 1 |
| Executive Perquisites | - 1 |
| Insider Activity | - 1 |
| Institutional Activity | - 1 |
| Management Reporting | + 1 |
| Short Interest | - 1 |
| Sentiment | + 1 |
| Standard & Poor's | - 1 |
| MACD Histogram Divergence | + 1 |
| Val Idea | - 1 |
| Stock Consultant | - 1 |
| Point & Figure | + 1 |
| Wall Street Analyzer | - 1 |
| Marketspace Chart | + 1 |
| Time Series Chart | - 1 |
| Neural Network | + 1 |
| Stock Options | + 1 |
| Ultimate Trading Systems | + 1 |
| Total | - 2 |
Place 1,260 shares of Under Armour, Inc. (UA) on the Active List.