![]()
Corporate Webpages Paysign, Inc.
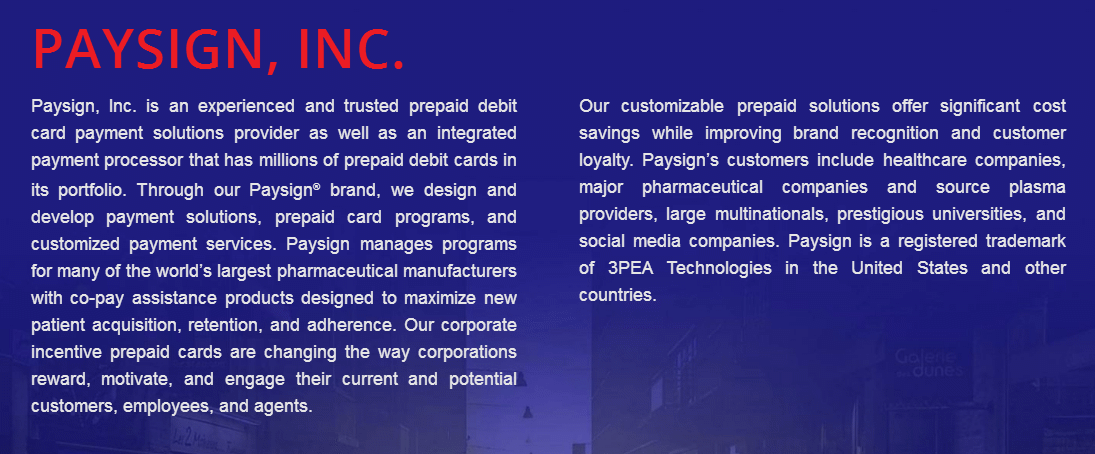
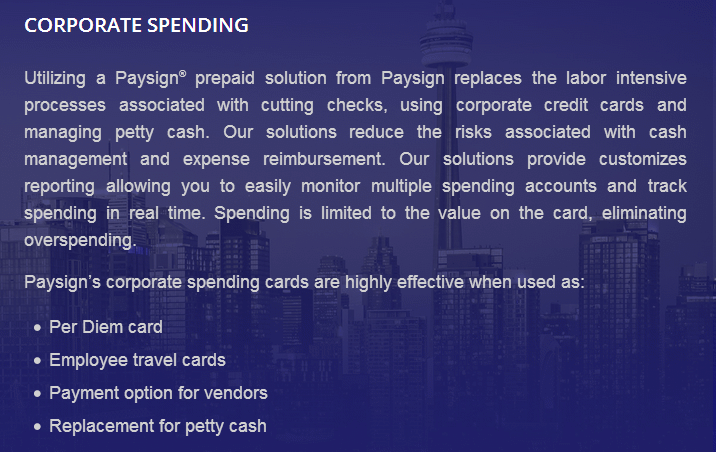
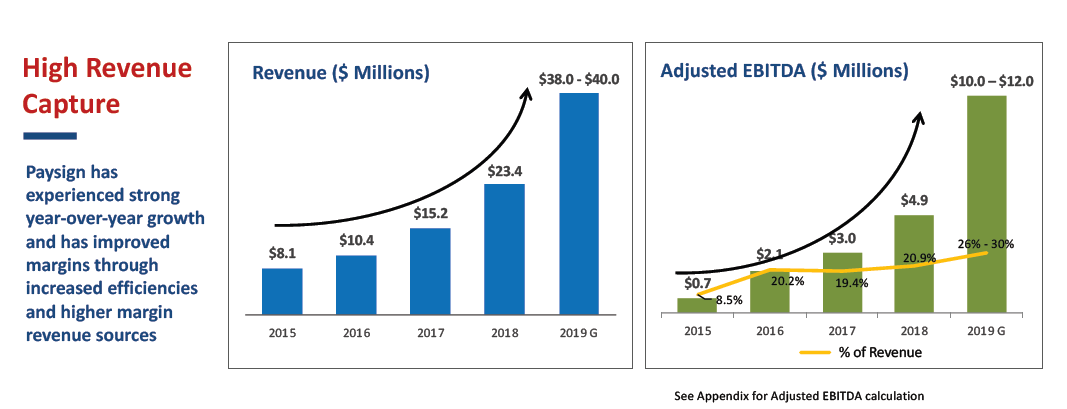
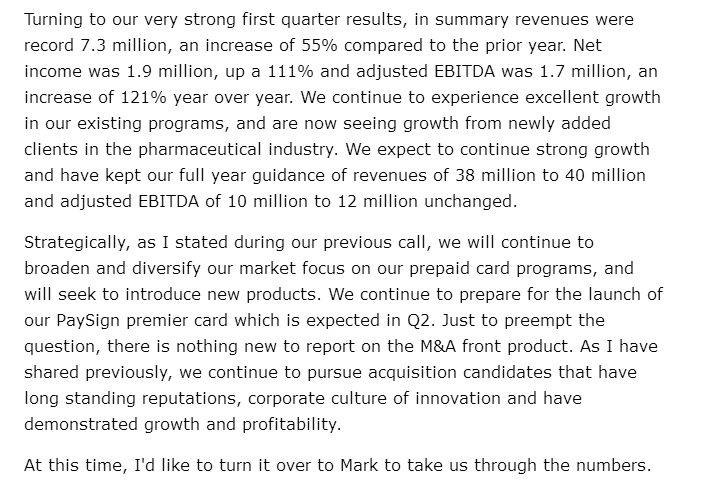
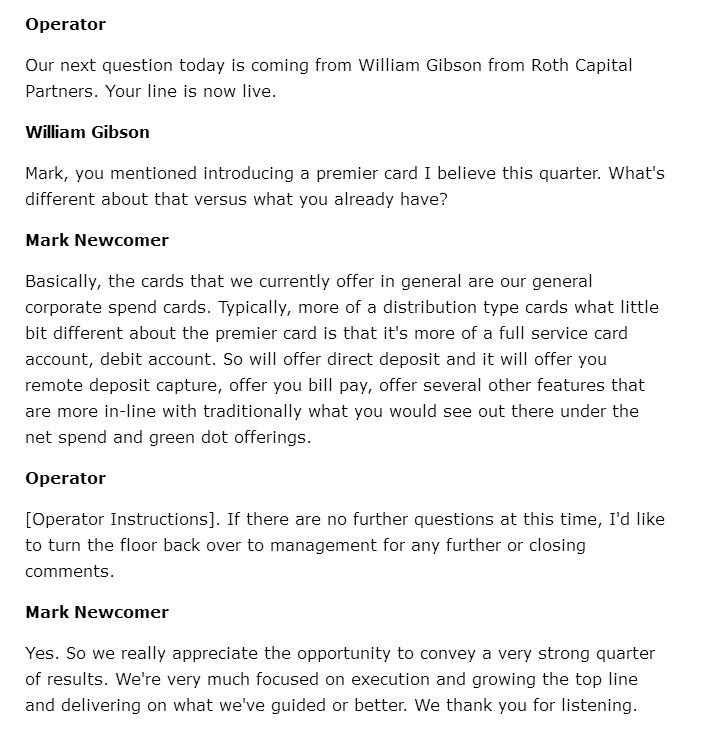
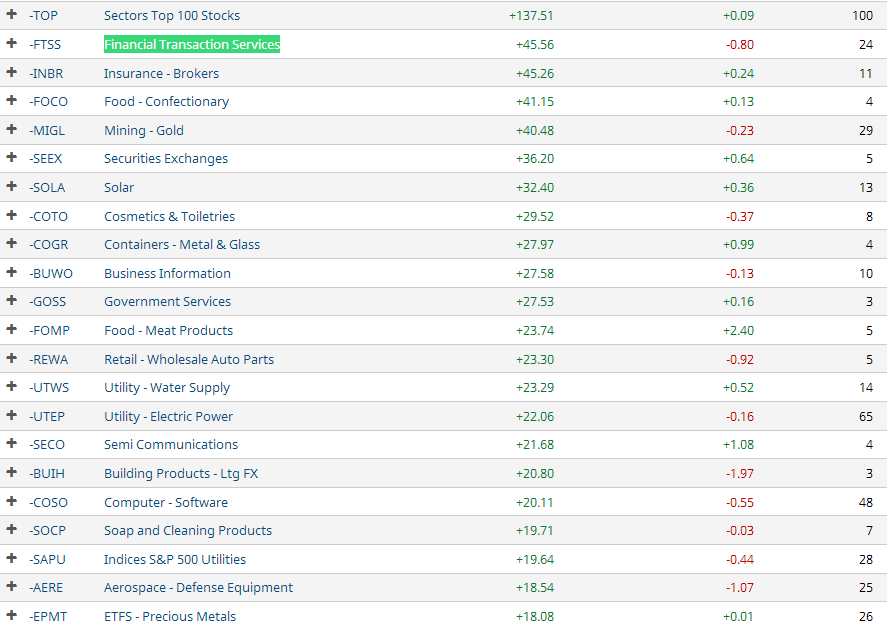
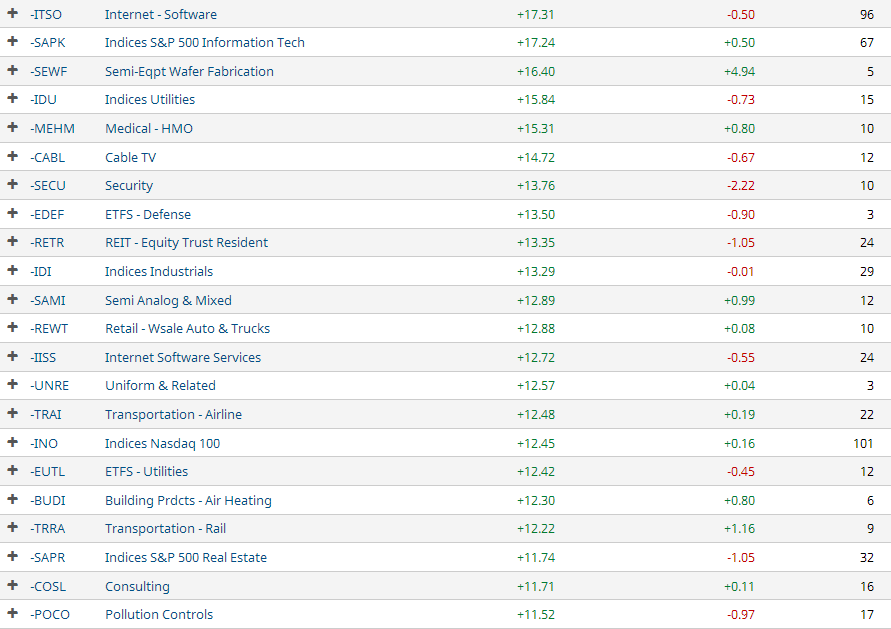
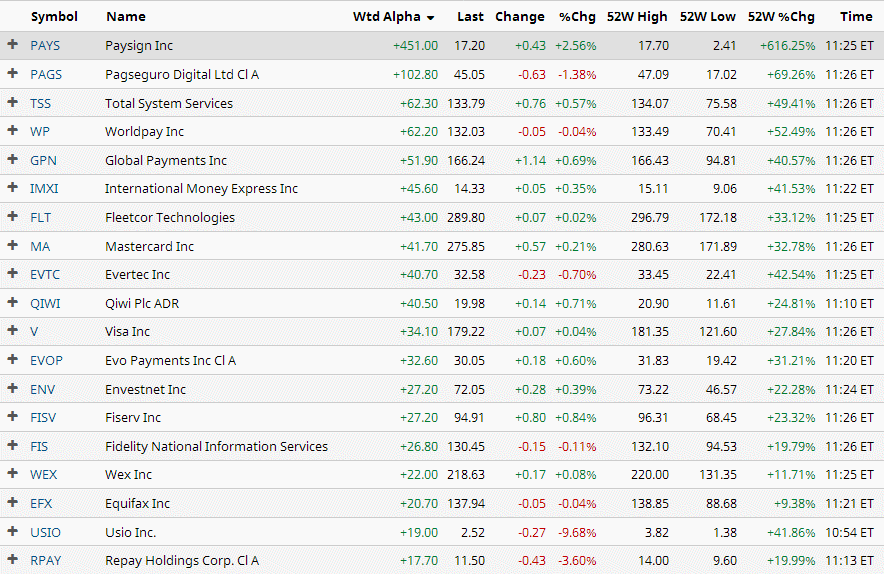
Paysign Inc. (PAYS) is in the financial transaction services industry
group which has been a leading performer for many similar stocks
of late. It provides prepaid charge card and processing
services working with partners like VISA, encouraging people to
use their charge cards. It offers innovative services related
to rebate programs, reloadable cards, incentive programs,
targeting prepaid and private label card issuers.
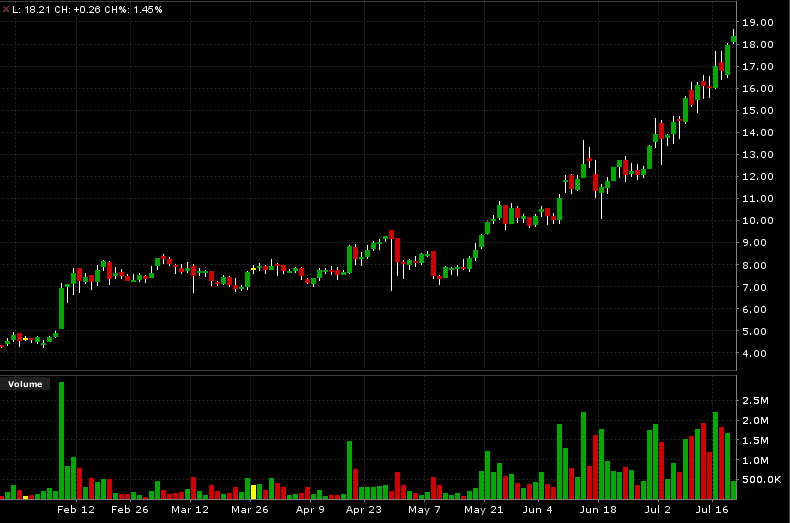
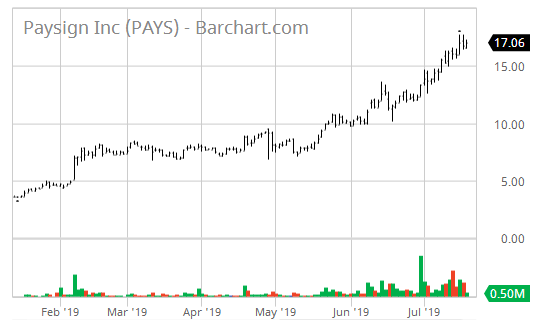
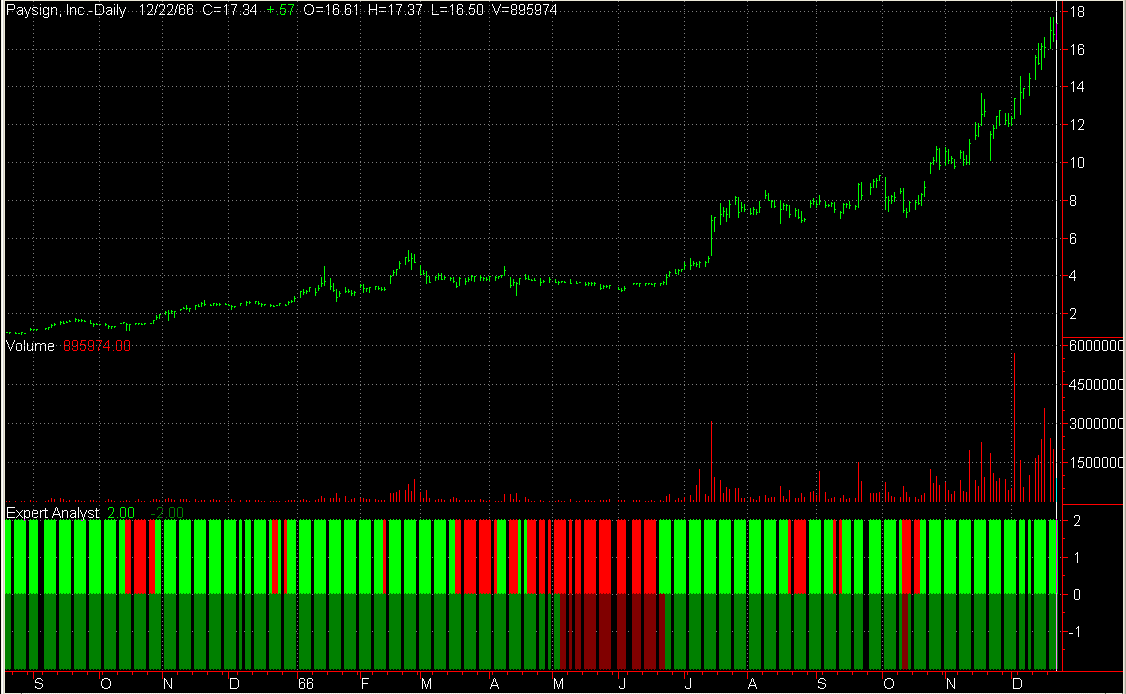
The stock of PAYS is off the charts with a huge gain in recent
months. Although researchers and analysts are generally
favorable, this has prompted at least one recently to issue a
warning that the stock rise is due more to chart action
attracting traders than to fundamentals. However, the stock has
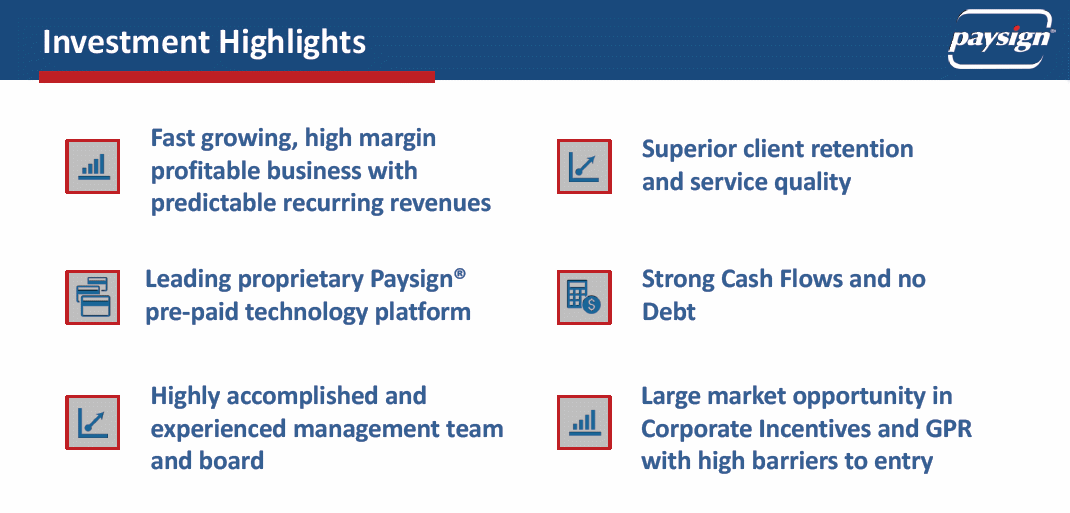
a very strong Zenith Index, perhaps due more than anything to
the fact that this company has no debt.
News and opinions on this stock are limited by the fact that
when a company changes its name and ticker symbol, not once, but
often, it confuses the standard resources upon which others
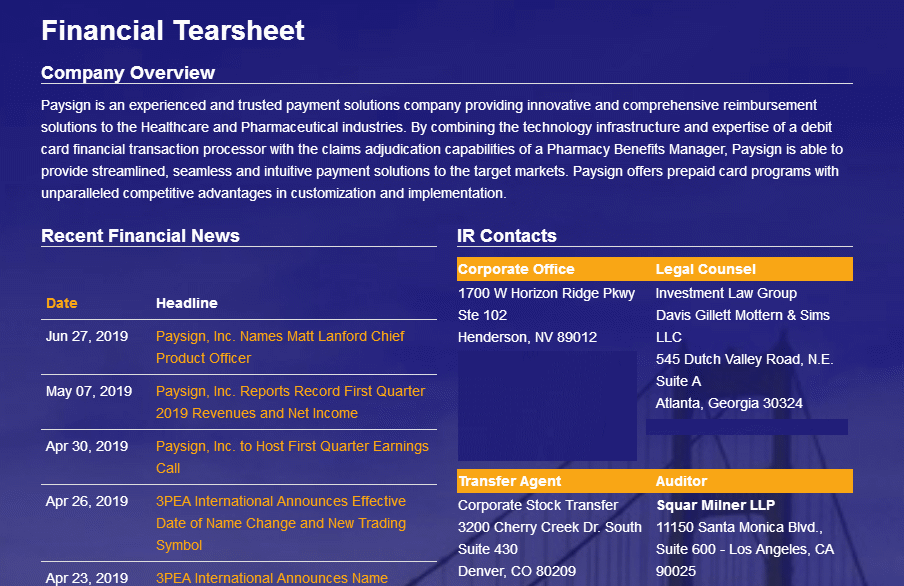
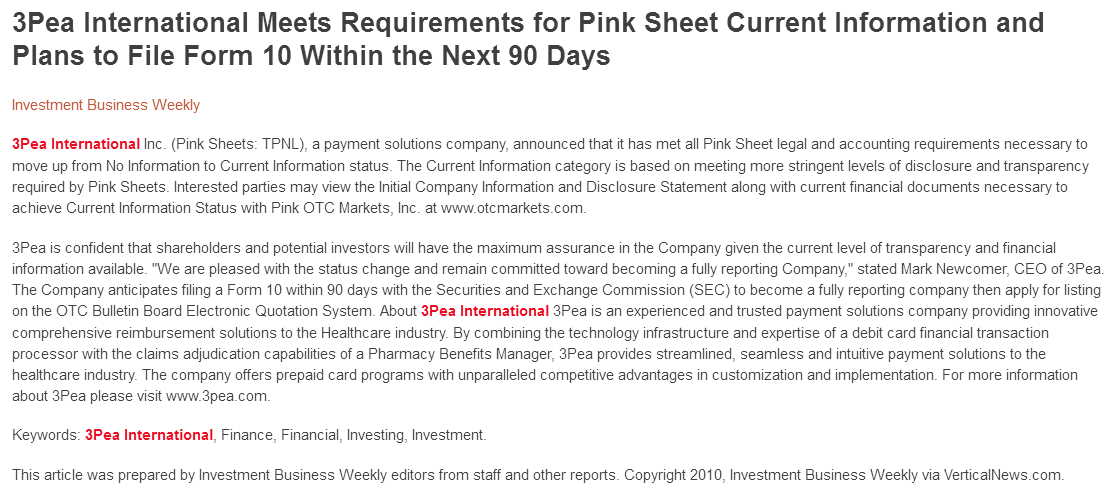
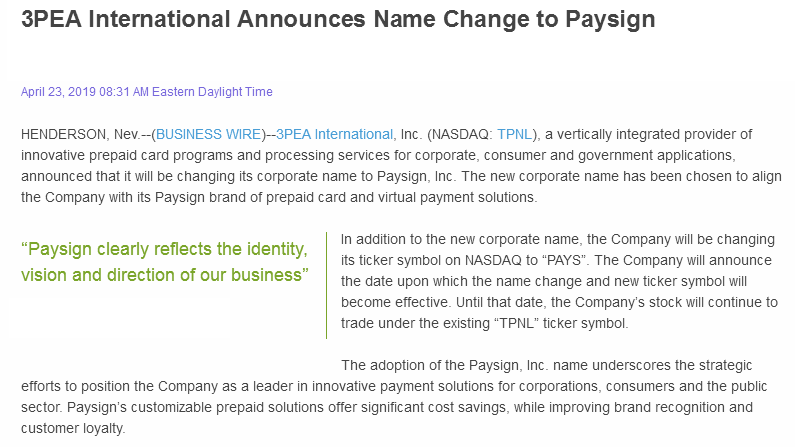
rely. This company very recently changed its name from 3PEA
International, Inc. to Paysign, Inc. We did not feel it was
worth the effort to go after previous news under its previous
ticker symbol because news is sparse and limited on this
corporation as are researchers and analysts willing to dabble in
it.
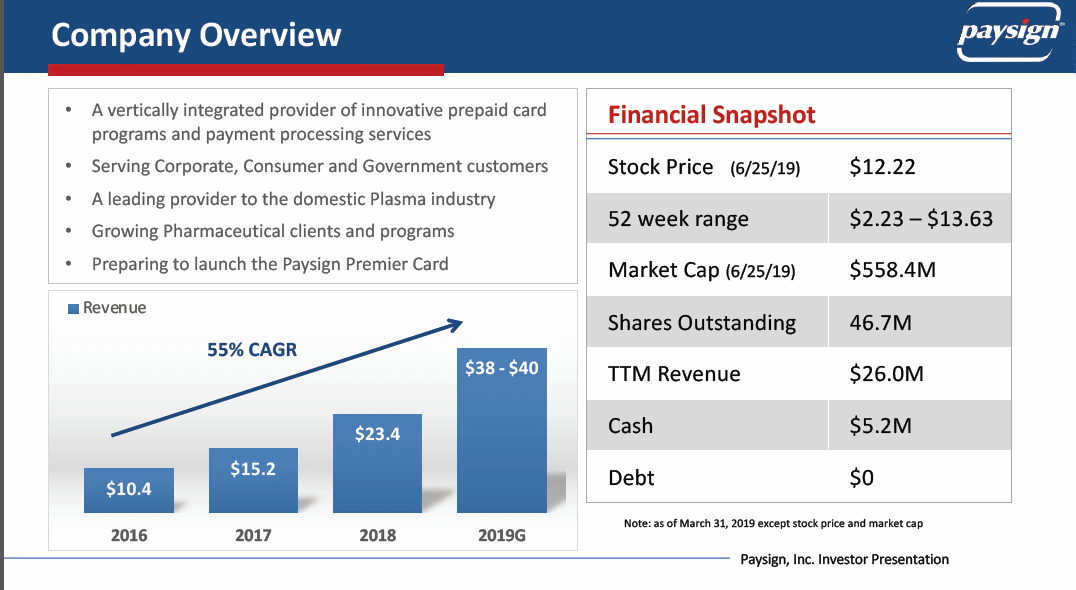
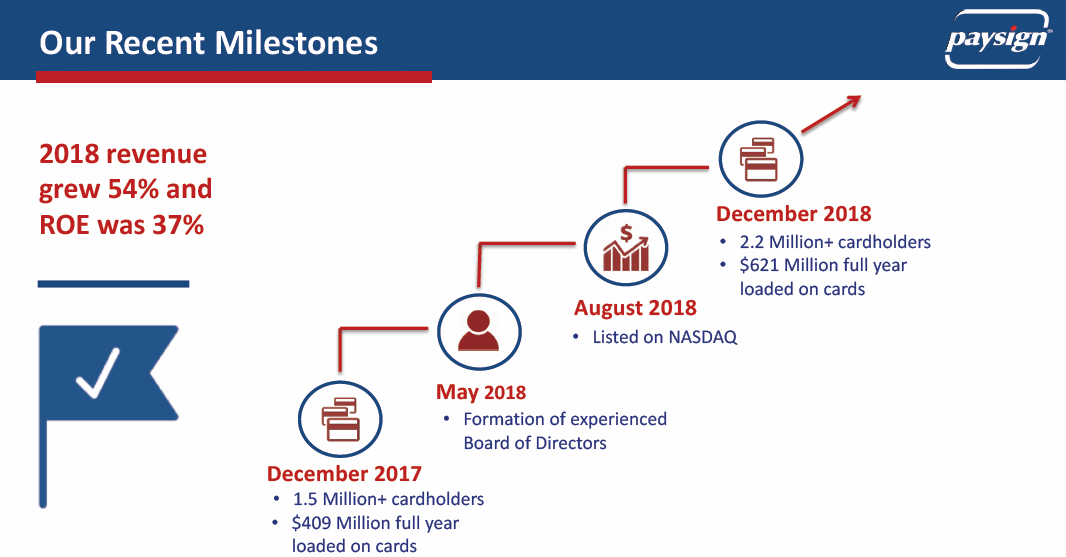
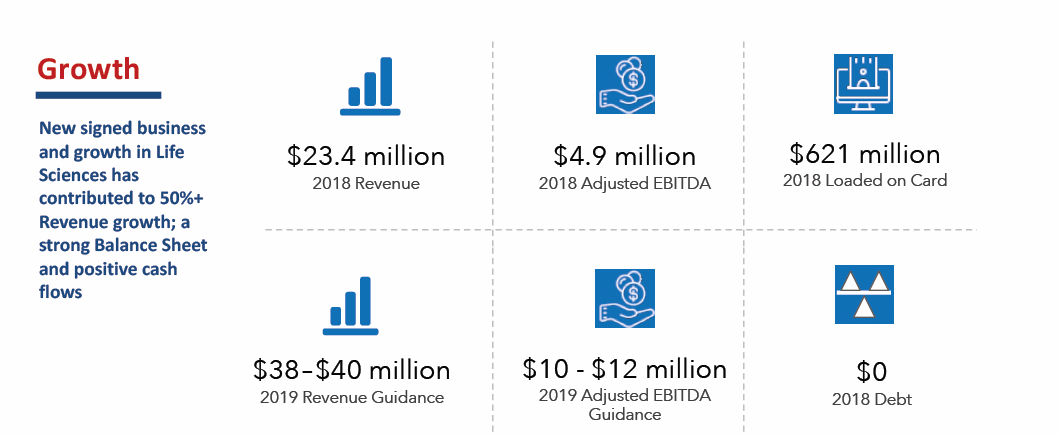
What is drawing the most attention to PAYS is an explosion in
revenues which is not matched by an explosion in earnings.
Although it has a strong profit margin, it may be inefficient in
use of its resources according to one analyst. We feel that
when you "give stuff away" to attract a large amount of
business, revenues are not matched by earnings power.
Because the stock rise appears to us to be largely "technical",
we feel this stock is very vulnerable to a correction. Short
interest is way up on the stock, which means a "short squeeze"
could push it even higher, but also means many traders agree
about the vulnerability.
This appears to be a well-run company with somewhat of a deficit
of easily-obtainable information on insider workings, no glitzy
annual report nor any CEO Letter to Shareholders, relying
instead as do most American corporations on conference calls.
It pays no dividend, and growth appears to be the key to its future.
In that regard, it has a lot of competitors.
(WAIT FOR PAGE TO LOAD COMPLETELY BEFORE LINKS WORK.)
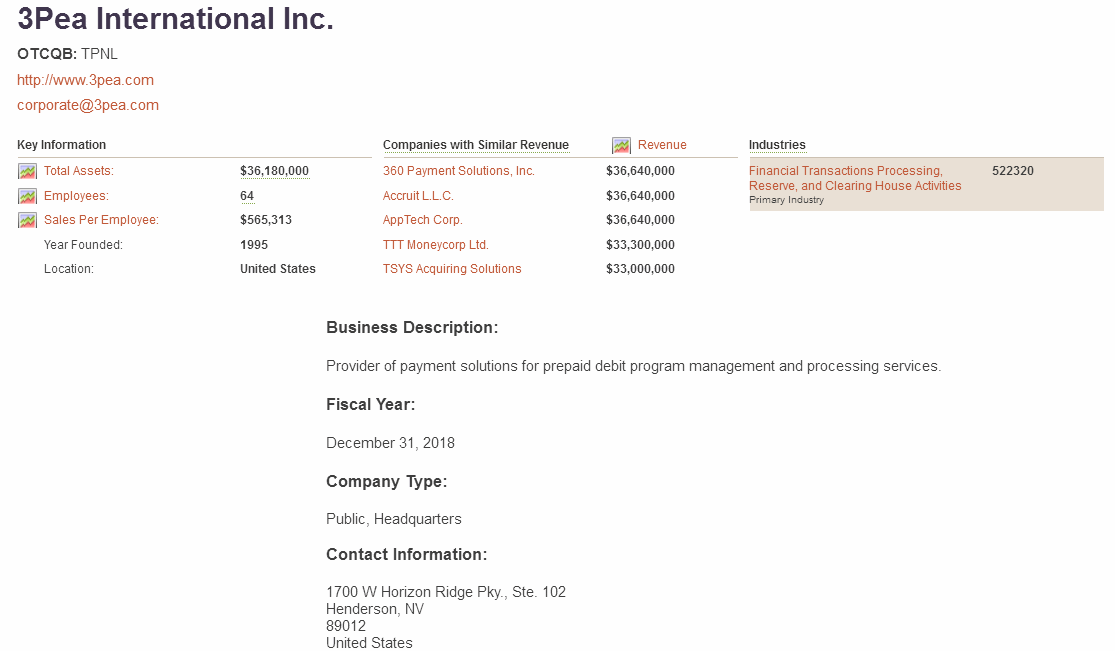
Company Profile
Company History
News
Comparison with Peers
Bond Issue
Zenith Index
Financial Statements
Avg. P/E to Current P/E
Financial Ratios
Intrinsic Value (Disc. CashFlow)
Fair Value Estimator
Projected Earnings
Research Reports
Analysts' Opinions
Insider Activity
Institutional Activity
Sentiment
Short Interest
Standard & Poor's
Management's Discussion
Channel Potential
MACD Histogram
Intraday Chart
Val Idea
Stock Consultant
Point & Figure Chart
Wall Street Analyzer
Marketspace Chart
Time Series Forecast
Neural Network Prediction
Stock Options
Ultimate Trading Systems
Recommendation







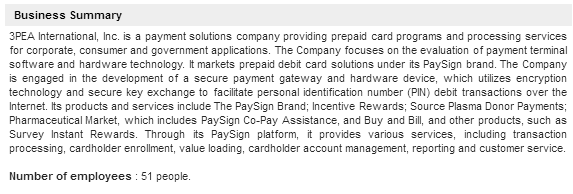
Company Profile |
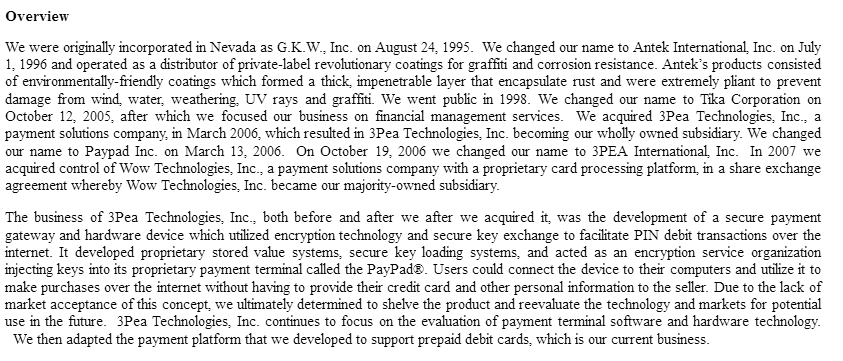
Company History |



News |
Comparison |
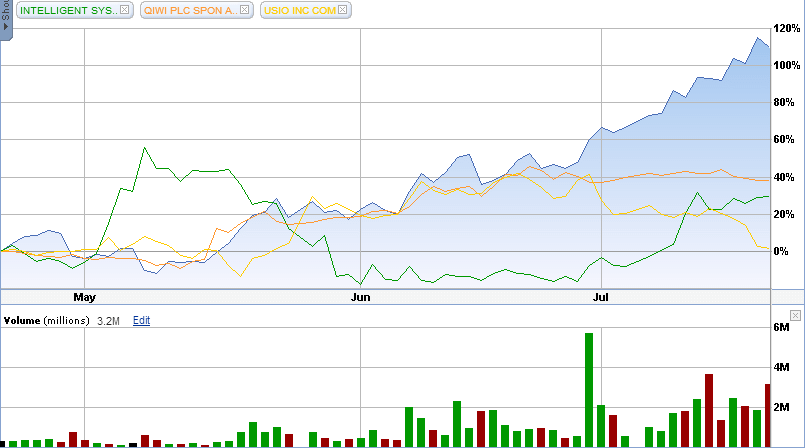
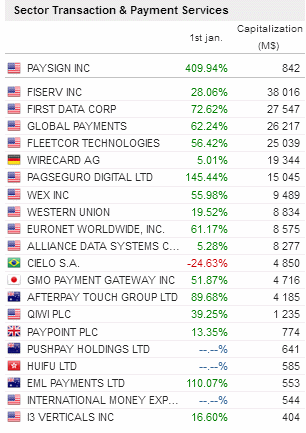
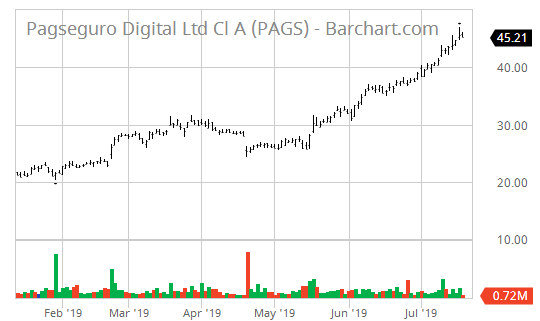
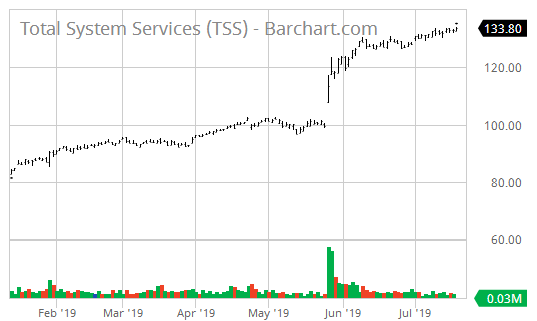
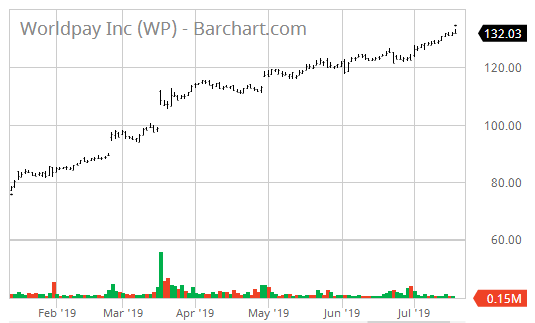
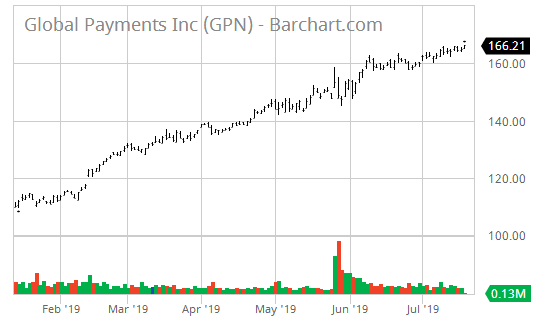
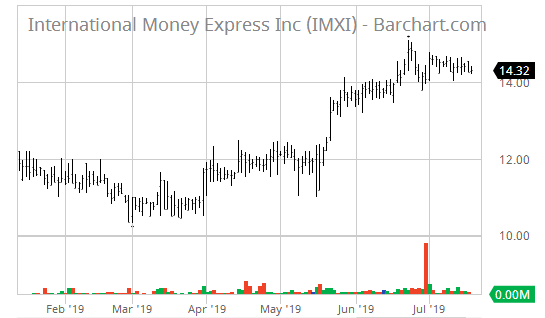
Similar Companies Performance:
Bond Issue |

Zenith Index |
Under current market conditions, a Zenith Index Score of 1.20 or above is required for a positive rating on this factor. 1.21 -1.30 is considered acceptable, 1.30-1.40 is considered strong and
> 1.40 is considered exceptionally strong. Accounting statements in this section often contain mistakes, especially in earlier years' totals, but data is deemed sufficient for us to give a rating. More accurate financial statements follow in the next section.
PaySign, Inc. (PAYS)                                      Exchange: Nasdaq
1700 West Horizon Ridge Parkway
Suite 102                        Sector: Industrials
Henderson, NV 89012              Industry: Business Services

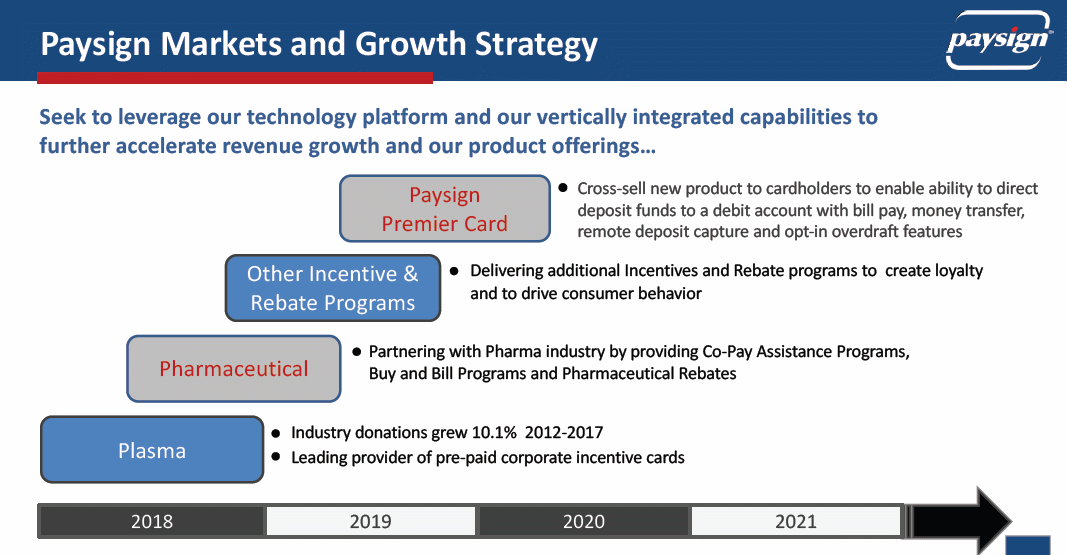
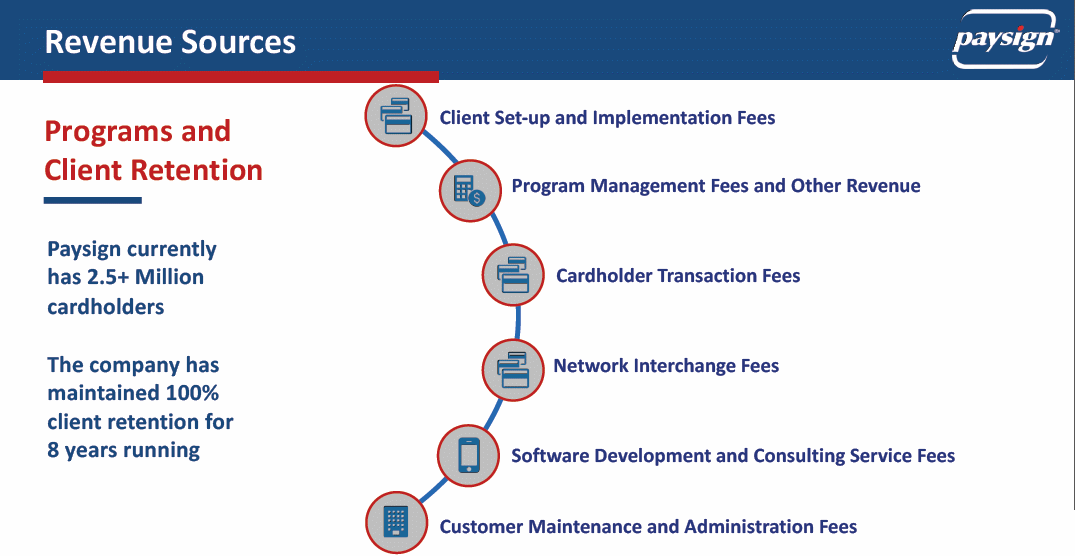
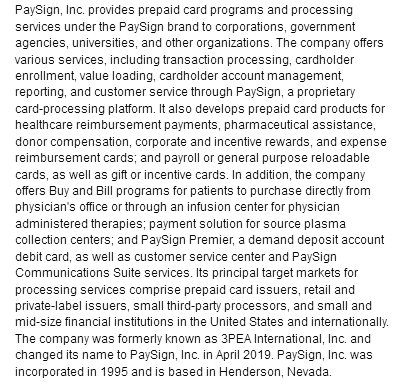
PaySign, Inc. provides prepaid card programs and processing services
under the PaySign brand to corporations, government agencies,
universities, and other organizations. The company offers various
services, including transaction processing, cardholder enrollment, value
loading, cardholder account management, reporting, and customer service
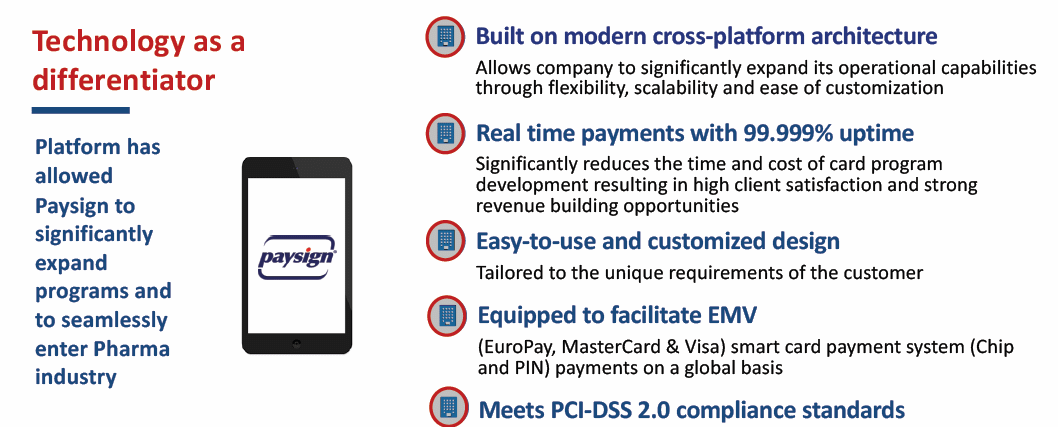
through PaySign, a proprietary card-processing platform. It also
develops prepaid card products for healthcare reimbursement payments,
pharmaceutical assistance, donor compensation, corporate and incentive
rewards, and expense reimbursement cards; and payroll or general purpose
reloadable cards, as well as gift or incentive cards. In addition, the
company offers Buy and Bill programs for patients to purchase directly
from physician's office or through an infusion center for physician
administered therapies; payment solution for source plasma collection
centers; and PaySign Premier, a demand deposit account debit card, as
well as customer service center and PaySign Communications Suite
services. Its principal target markets for processing services comprise
prepaid card issuers, retail and private-label issuers, small
third-party processors, and small and mid-size financial institutions in
the United States and internationally. The company was formerly known as
3PEA International, Inc. and changed its name to PaySign, Inc. in April
2019. PaySign, Inc. was incorporated in 1995 and is based in Henderson,
Nevada.

Last Trade:  16.77                           52-Week Range:  17.70 -   2.41
Employees: 64                                Avg.Volume:     958,829 Shares

Corporate Governance:
Pillar scores are Audit: N/A; Board: N/A; Shareholder Rights: N/A;
         (A lower number means less governance risk.)

EPS:  0.06    Dividend Amount: $ 0.00          Yield:  0.00%
             Ex-Dividend Date: N/A             Payout Ratio:   0.00

Key Statistics:

    Trailing P/E: 290.00              Forward P/E (est.):  51.18
                                           Target Price:  13.38

Qrtly Stock Price Growth (yoy): 598.75%               Beta:   0.00
Qrtly S&P Index   Growth (yoy):   0.00%        Short Ratio:   2.20%
    Qrtly Revenue Growth (yoy):   6.00%         Shares Out:  43670000
   Qrtly Earnings Growth (yoy):   0.00%

          Book Value:   0.00                    Debt/Equity:   0.00%
    Price/Book Value:  75.98        Operating Profit Margin:   0.00%
         Price/Sales:  31.60                  Profit Margin:   0.00%
         Market Cap:     821,835,000       Return on Equity:   0.00%
    Enterprise Value:     781,570,000      Return on Assets:   0.00%

    Operating Cash Flow:         15,996
         Free Cash Flow:         14,301


Annual Income Statement:                          (All numbers in thousands)
  Period Ending                             12/31/2018  12/31/2017  12/31/2016

  Total Revenue                                 23,424      15,234      10,417
  Cost of Revenue                               12,026       8,534       5,879
  Gross Profit                                  11,397       6,700       4,537

Operating Expenses:
  Research & Development                             0           0           0
  Selling, General & Administrative              7,835       4,056       2,607
  Non-Recurring Expenses                             0           0           0
  Other Operating Expenses                           0           0           0
  Total Operating Expenses                      20,951      13,466       9,058

Operating Income or Loss                         2,473       1,768       1,359

Income from Continuing Operations:
  Total Other Income/Expenses Net                  109          24         -61
  Earnings Before Interest & Taxes               2,473       1,768       1,359
  Interest Expense                                   0         -32         -77
  Income Before Taxes                            2,581       1,792       1,298
  Income Tax Expense                                 0           6           0
  Minority Interest                               -207        -200        -195

Net Income from Continuing Op.s                  2,581       1,786       1,298

Non-recurring Events:
  Discontinued Operations                            0           0           0
  Extraordinary Items                                0           0           0
  Effect of Accounting Changes                       0           0           0
  Other Items                                        0           0           0
  Net Income                                     2,588       1,791       1,401
  Preferred Stock & Other Adjustments                0           0           0

Net Income Avail to Common Shares                2,588       1,791       1,401


Annual Cash Flow Statement:                   (All numbers in thousands)
  Period Ending                         12/31/2018    12/31/2017    12/31/2016

  Net Income                                 2,581         1,786         1,298

Operating Activities:
  Depreciation                               1,090           876           572
  Adjustments to Net Income                  1,360           303           -10
  Changes in Accounts Recv'bls                -172           -55           -94
  Changes in Liabilities                       182           379           416
  Changes in Investories                         0             0             0
  Changes in other Oper'g Acts              10,948         3,857         1,920

Total Cash Flow f Operations                15,996             0         4,205

Investing Activities:
  Capital Exenditures                         -257          -707          -110
  Investments                                    0             0             0
  Other Cash Flows fr Investing                  0             0             0

Total Cash Flows from Investing             -1,595             0          -887

Financing Activities:
  Dividends Paid                                 0             0             0
  Sale of Purchase of Stock                      0             0             0
  Net Borrowings                                 0          -152          -137
  Other Cash Flows fr Financing                  0             0             0

Total Cash Flows from Financing                100          -102          -137

  Effect of Exchange Rate Chg                    0             0             0

Change in Cash & Cash Equiv.                14,501         5,530         3,181


Annual Balance Sheets:                              (All Numbers in Thousands)
  Period Ending                          12/31/2018    12/31/2017    12/31/2016
Current Assets:
  Cash & Cash Equivalents                     5,615         2,748         1,632
  Short Term Investments                          0             0             0
  Net Receivables                               337           166           110
  Inventory                                       0             0             0
  Other Current Assets                       26,051        14,416        10,003
  Total Current Assets                       32,003        17,330        11,745

  Long-Term Investments                           0             0             0
  Property, Plant & Equipt                      883           854           301
  Goodwill                                        0             0             0
  Intangible Assets                           2,116         1,640         1,550
  Accumulated Amortization                        0             0             0
  Other Assets                                    0             6             6
  Deferred LT Asset Charges                       0             0             0

Total Assets                                 36,178        20,403        13,872

Current Liabilities:
  Accounts Payable                            1,327         1,145           766
  Current Portion LT Debt                         0             0            22
  Other Current Liabilities                  25,961        14,416        10,257
  Total Current Liabilities                  27,288        15,562         11,147

  Long Term Debt                                  0             0            28
  Other Liabilities                               0             0             0
  Deferred LT Liab. Charges                       0             0             0
  Minority Interest                            -207          -200          -195
  Negative Goodwill                               0             0             0

Total Liabilities                            27,288        15,562        11,175

Stockholder Equity:  Misc. Options, Warrants                         0             0             0
  Redeemable Preferred Stock                      0             0             0
  Preferred Stock                                 0             0             0
  Common Stock                                   46            44            43
  Retained Earnings                             580        -2,008        -3,800
  Treasury Stock                               -150          -150          -150
  Capital Surplus                             8,620         7,156         6,798
  Other Stockhohlder Equity                       0             0             0
  Total Stockholder Equity                    9,096         5,041         2,891

Net Tangible Assets                           6,980         3,402         1,341


PaySign, Inc. (PAYS)                        [Indices near +3.0, near zero,
                                            or < zero bear special attention.]
P/E Ratio Tests:
P/E Ratio < 28?            0.0966          P/E Ratio > 5?             1.0000
P/E Ratio Vs Growth Rate:  0.0000          Forward P/E Ratio < 28?    0.5471
Price/Sales Ratio < 2.3?   0.0728          Inventory/Sales < 5%?      1.0000
Sales < $1 Billion?        3.0000          Operating Margin < 7.5%?   0.0000

Balance Sheet Tests:
Debt/Equity < 0.40?        1.0000          Long-Term Debt Service:    3.0000
LTD Being Reduced?         0.0000          Short-Term Debt Service:   3.0000
Current Ratio > 2?         0.5864          Working Capital >= 1.5?    1.2961
Leverage Ratio < 20%?      3.0000          Debt/Assets < 1?           3.0000
Quick Ratio > 1?           3.0000          Inventory Turnover > 1?    1.0000
Share Equity Increase:     3.0000          Market Cap.< 1.5 Billion?  1.8252
                                           Intangibles < 3% Assets?   0.5129
Income Tests:
Profit Margin < 7.5%?      0.0000          EPS Annual Growth > 10%?   0.0692
Dividend Yield > 2.0%?     0.0000          EPS 3-yr Growth > 15?      0.0812
Enterprise Value/Revenue   3.0000          EPS Growth Consistent?     2.0000
Enterprise Value/EBITDA:   3.0000          Collection < 45 days?      3.0000
EPS Qrtly Growth > 10%?    0.0000          Gross Pft/Cur. LTD > 1?    3.0000
                                           Borrowing Int. Rate < 6%?  3.0000
Stock Performance Tests:
Volatility > 25%?          3.0000          % Held by Insiders < 5%?   1.1494
Beta > 1.25?               0.0000          % Held by Institut. < 50?  0.5928
50 Da MA > 200 Da MA?      0.7728          % Held by Institut. > 30?  2.8117
52-Wk Change vs. S&P 500:  3.0000          Short Ratio > 5?           0.4400
Price/Book Value < 3?      3.0000          Short % of Float > 20?     0.4240
Return on Assets > 17%?    0.0000          Average Volume > 100,000?  3.0000

Cash Flow Tests:
Oper. C.F. > Lever'd C.F:  1.1185          Positive Free Cash Flow?   3.0000
Positive Oper. Cash Flow?  3.0000          Price to C.F.Ratio < 14?:  0.3014
                                           Cash Flow / Assets > 10%?  3.0000

PAYS   PaySign, Inc.                       Overall Zenith Index:      1.5449
Financial Statements |
PAYSIGN INC (PAYS) INCOME STATEMENT Fiscal year ends in December. 2014-12 2015-12 2016-12 2017-12 2018-12 TTM Revenue 5,496,950 4,042,344 5,142,195 6,723,737 23,423,676 26,103,218 Cost of revenue 0 0 0 0 12,026,452 0 Gross profit 5,496,950 4,042,344 5,142,195 6,723,737 11,397,223 26,103,218 Operating expenses Sales, General and administrative 2,715,316 3,734,187 3,288,373 4,055,836 7,835,074 10,009,930 Other operating expenses -2,715,316 -3,734,187 -3,288,373 -4,055,836 1,089,521 -10,009,930 Total operating expenses 0 0 0 0 8,924,595 0 Operating income 5,496,950 4,042,344 5,142,195 6,723,737 2,472,628 26,103,218 Interest Expense 141,515 45,683 77,107 31,623 0 0 Other income (expense) -2,745,395 -6,546,238 -3,767,437 -4,900,404 108,613 -23,077,012 Income before taxes 2,610,040 -2,549,577 1,297,651 1,791,710 2,581,241 3,026,205 Provision for income taxes 0 0 0 6,000 0 -15,490 Net income from continuing operations 2,610,040 -2,549,577 1,297,651 1,785,710 2,581,241 3,041,695 Other 444 139,240 103,148 5,431 6,813 5,482 Net income 2,610,484 -2,410,337 1,400,799 1,791,141 2,588,054 3,047,177 Net income available to common shareholders 2,610,484 -2,410,337 1,400,799 1,791,141 2,588,054 3,047,177 Earnings per share Basic 0.07 -0.06 0.03 0.04 0.06 0.07 Diluted 0.06 -0.06 0.03 0.04 0.05 0.06 Weighted average shares outstanding Basic 38,808,084 39,641,176 42,875,520 43,397,476 45,483,692 45,976,272 Diluted 42,405,848 39,641,176 43,867,228 44,934,976 52,347,736 53,254,752 ____________________________________________________________________________________________________________________________________________ PAYSIGN INC (PAYS) BALANCE SHEET Fiscal year ends in December. 2014-12 2015-12 2016-12 2017-12 2018-12 Assets Current assets Cash Total cash 3,891,419 1,393,045 1,637,494 2,753,864 5,615,073 Receivables 86,658 16,742 110,269 165,523 337,303 Prepaid expenses 214,502 254,225 270,634 572,789 1,175,241 Other current assets -4,192,579 -1,664,012 -2,018,397 -3,492,176 26,050,668 Total current assets 0 0 0 0 33,178,284 Non-current assets Property, plant and equipment Gross property, plant and equipment 758,723 897,055 1,006,920 1,714,142 1,970,798 Accumulated Depreciation -551,794 -625,088 -706,159 -859,740 -1,087,308 Net property, plant and equipment 206,929 271,967 300,761 854,402 883,490 Intangible assets 765,719 1,264,151 1,550,044 1,639,557 2,115,933 Other long-term assets -972,648 -1,536,118 -1,850,805 -2,493,959 0 Total non-current assets 0 0 0 0 2,999,423 Total assets 0 0 0 0 36,177,708 Liabilities and stockholders' equity Liabilities Current liabilities Short-term debt 325,446 174,098 124,168 0 0 Accounts payable 0 1,254,658 254,900 0 0 Accrued liabilities 680,159 465,318 765,596 0 0 Other current liabilities -1,005,605 -1,894,074 -1,144,664 0 27,288,472 Total current liabilities 0 0 0 0 27,288,472 Non-current liabilities Long-term debt 100,000 0 27,892 0 0 Minority interest 47,702 -91,538 -194,686 -200,117 -206,930 Other long-term liabilities -100,000 0 -27,892 0 0 Total non-current liabilities 47,702 -91,538 -194,686 -200,117 -206,930 Total liabilities 47,702 -91,538 -194,686 -200,117 27,081,540 Stockholders' equity Common stock 36,669 42,511 43,186 43,671 46,441 Additional paid-in capital 5,634,886 6,579,508 6,726,173 7,155,970 8,620,144 Retained earnings 0 -5,200,412 -3,799,613 -2,008,472 579,582 Treasury stock -150,000 -150,000 -150,000 -150,000 -150,000 Accumulated other comprehensive income -2,790,075 0 0 0 0 Total stockholders' equity 2,731,480 1,271,607 2,819,746 5,041,169 9,096,167 Total liabilities and stockholders' equity 2,779,182 1,180,069 2,625,060 4,841,052 36,177,708 ____________________________________________________________________________________________________________________________________________ PAYSIGN INC (PAYS) Statement of CASH FLOW Fiscal year ends in December. USD. 2014-12 2015-12 2016-12 2017-12 2018-12 TTM Cash Flows From Operating Activities Net income 2,610,484 -2,410,337 1,400,799 1,791,141 2,588,054 3,047,177 Depreciation & amortization 171,594 362,712 572,320 876,191 1,089,521 1,177,244 Stock based compensation 600,641 202,550 92,939 308,696 1,366,944 1,876,253 Change in working capital -299,740 1,276,148 -696,190 4,181,117 10,958,263 28,251,024 Accounts receivable 291,055 69,916 -93,527 -55,254 -171,780 -503,151 Prepaid expenses 13,346 -44,723 -16,409 -302,155 -596,901 -74,836 Accrued liabilities 0 -130,590 415,504 379,487 0 0 Other working capital -604,141 1,381,545 -1,001,758 4,159,039 11,726,944 28,829,012 Other non-cash items -444 -150,577 -103,145 -5,431 -6,813 -5,482 Net cash provided by operating activities 3,082,535 -719,504 1,266,723 7,151,714 15,995,969 34,346,216 Cash Flows From Investing Activities Investments in property, plant, and equipmen -140,853 -138,332 -109,865 -707,224 -257,062 -399,312 Purchases of intangibles -387,059 -787,850 -777,144 -812,121 -1,337,923 0 Other investing activities 0 0 0 0 0 -1,402,555 Net cash used for investing activities -527,912 -926,182 -887,009 -1,519,345 -1,594,985 -1,801,867 Cash Flows From Financing Activities Debt issued 817,890 0 44,753 0 0 0 Debt repayment -512,784 -851,788 -182,018 -152,060 0 0 Other financing activities 0 0 0 50,000 100,000 0 Net cash provided by (used for) financing 305,106 -851,788 -137,265 -102,060 100,000 0 Net change in cash 2,859,729 -2,497,474 242,449 5,530,309 14,500,984 32,544,350 Cash at beginning of period 1,027,239 3,886,968 1,389,494 11,634,448 17,164,756 18,494,948 Cash at end of period 3,886,968 1,389,494 1,631,943 17,164,756 31,665,740 51,039,296 Free Cash Flow Operating cash flow 3,082,535 -719,504 1,266,723 7,151,714 15,995,969 34,346,216 Capital expenditure -527,912 -926,182 -887,009 -1,519,345 -1,594,985 -1,801,867 Free cash flow 2,554,623 -1,645,686 379,714 5,632,369 14,400,984 32,544,350 ____________________________________________________________________________________________________________________________________________
Average to Current P/E Ratios |
              (PAYS)     Paysign Inc.

                               2014    2015    2016    2017    2018

          Annual Earnings:     0.06   -0.06    0.03    0.04    0.05
Average Price During Year:     0.22    0.39    0.31    0.79    4.11

                P/E Ratio:     3.68    6.42   10.36   19.81   82.12

 Average 5-Year P/E Ratio  =  24.48
             Current Price =  17.34

Previous 5 Quarter Earnings:   0.01    0.02    0.02    0.01    0.02

          Current Annualized (Last Four Quarters) Earnings =   0.05
                                                           ________
                                 Average PE / Current PE =     0.07
                                                           --------

                                      ...a number above 1.00 is good
                                                1.00 or below is bad
Financial Ratios |
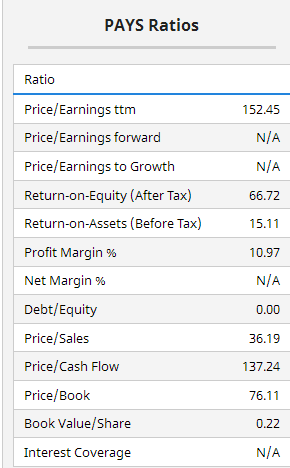
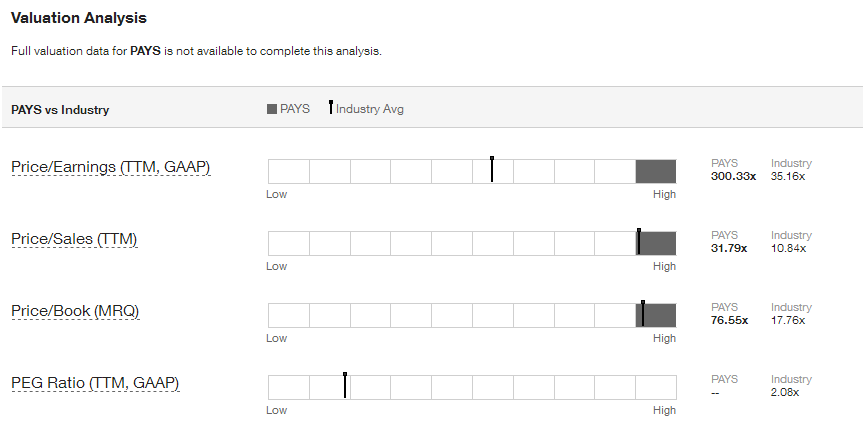
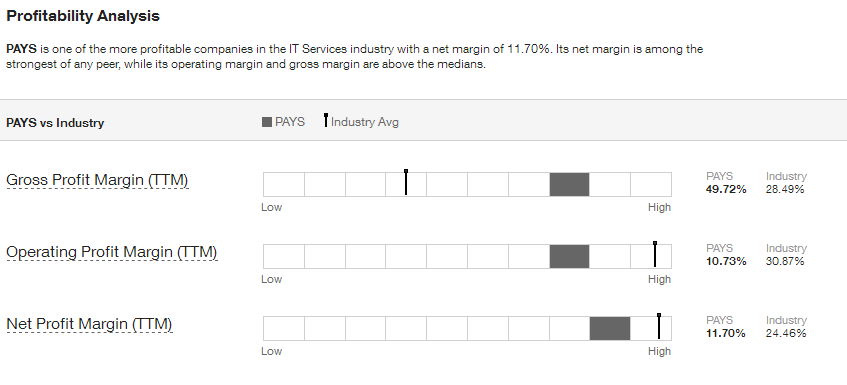
. . . . . . . . . . . . Lowest to Highest, Compared to Industry
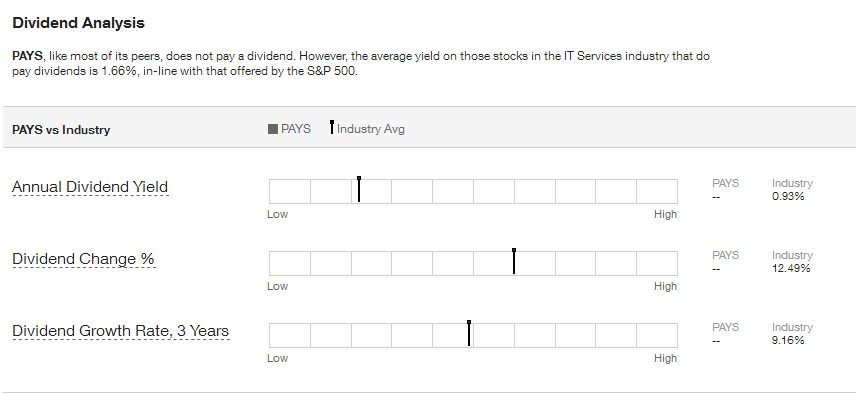
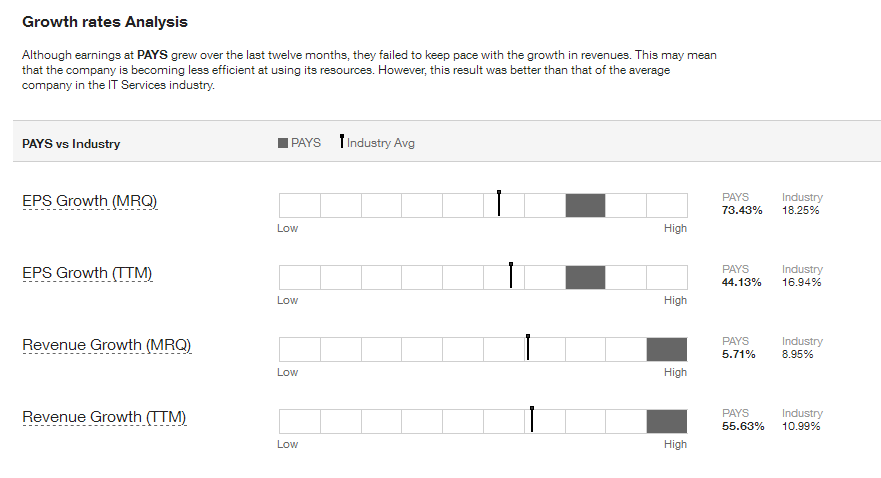
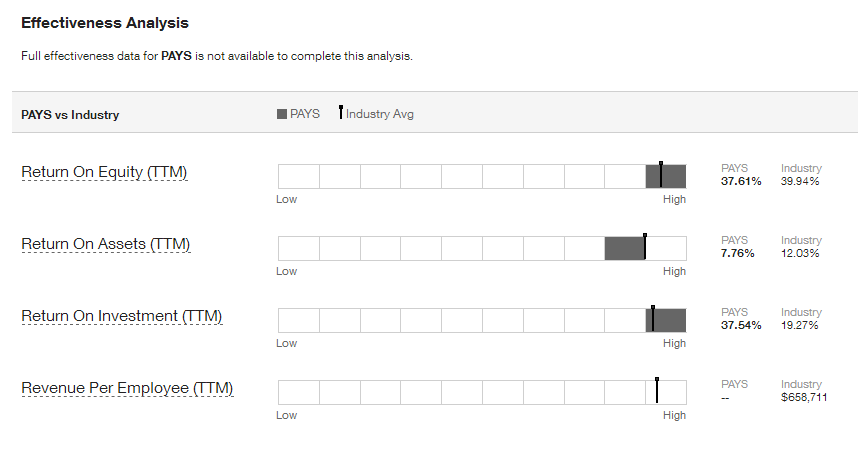
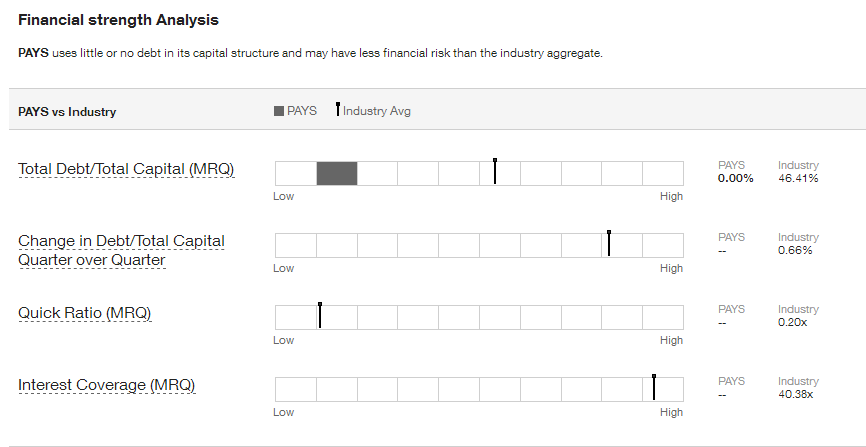
Intrinsic Value (DCF) |
Intrinsic Value by Discounted Cash Flow Method:

Fair Value Estimator |
Fair Value Estimate:

Projected Earnings |

Research Reports |
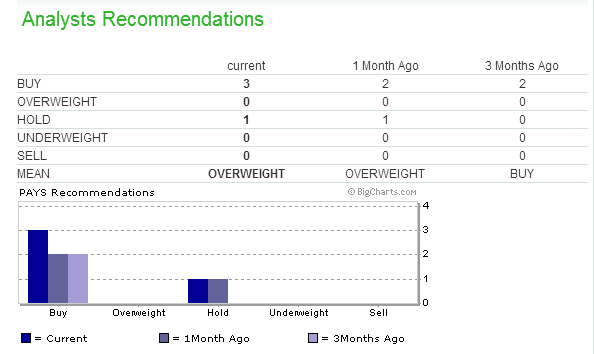
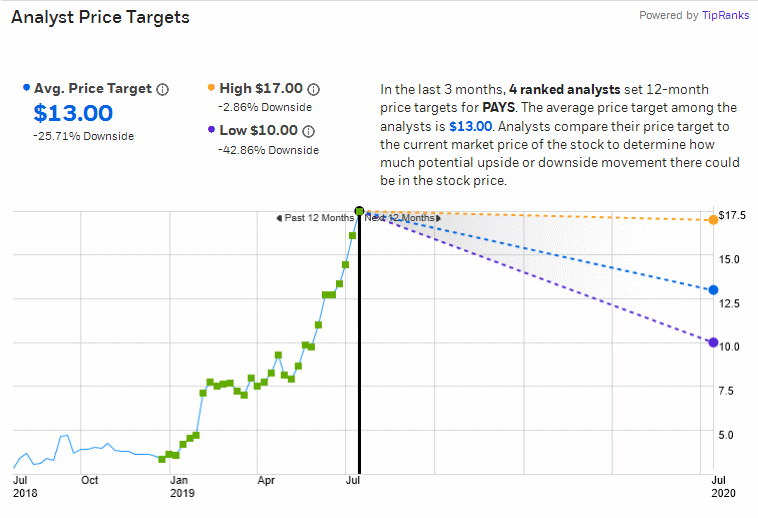
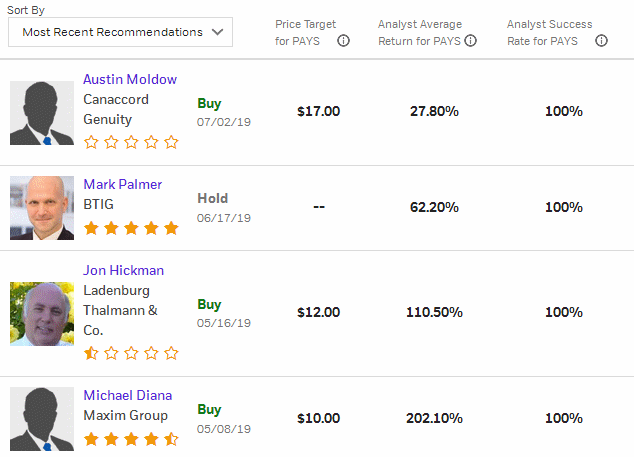
Analysts' Opinions |

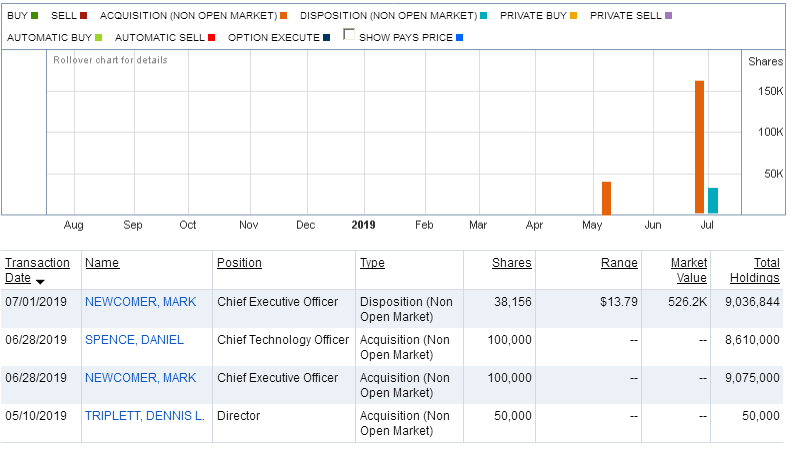
Insider Activity |

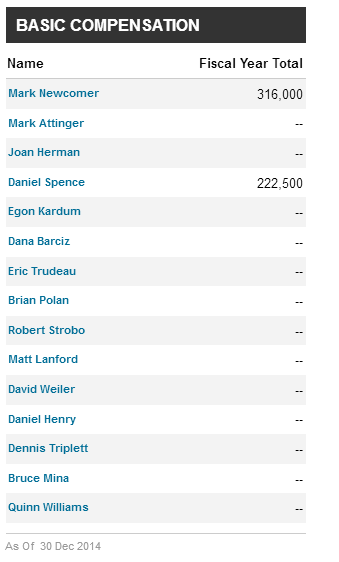
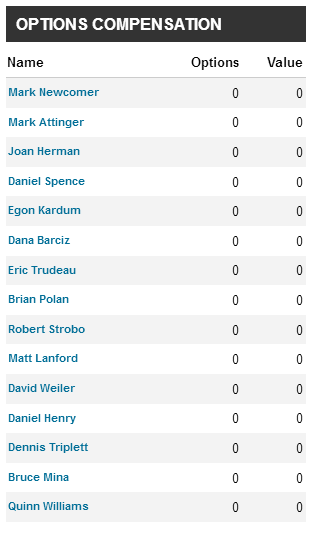
Institutional Activity |
Institutional Orders to Buy or Sell:
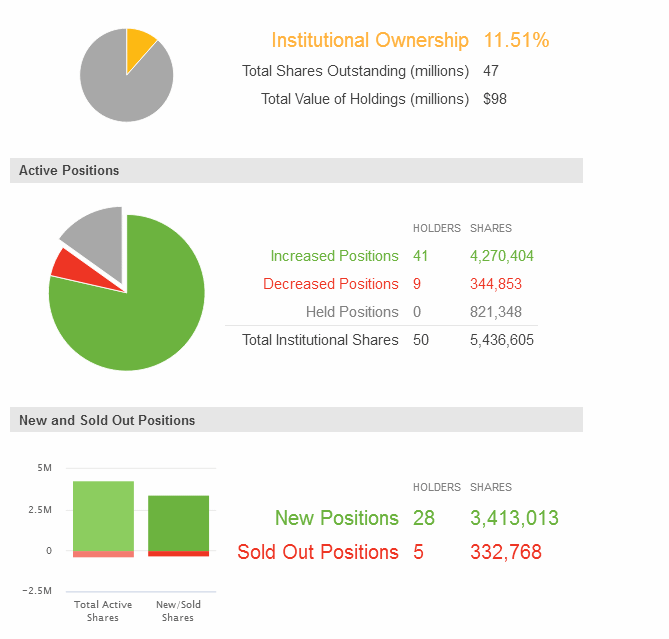
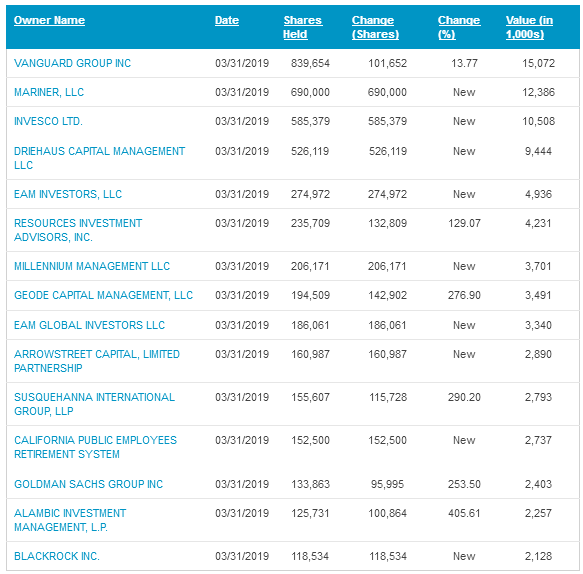
Sentiment |
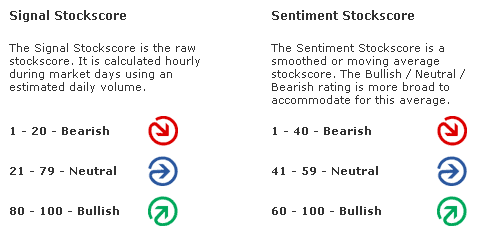
Zenith uses the "sentiment" score above or below 50 to award a positive or negative point in the Decision Matrix.


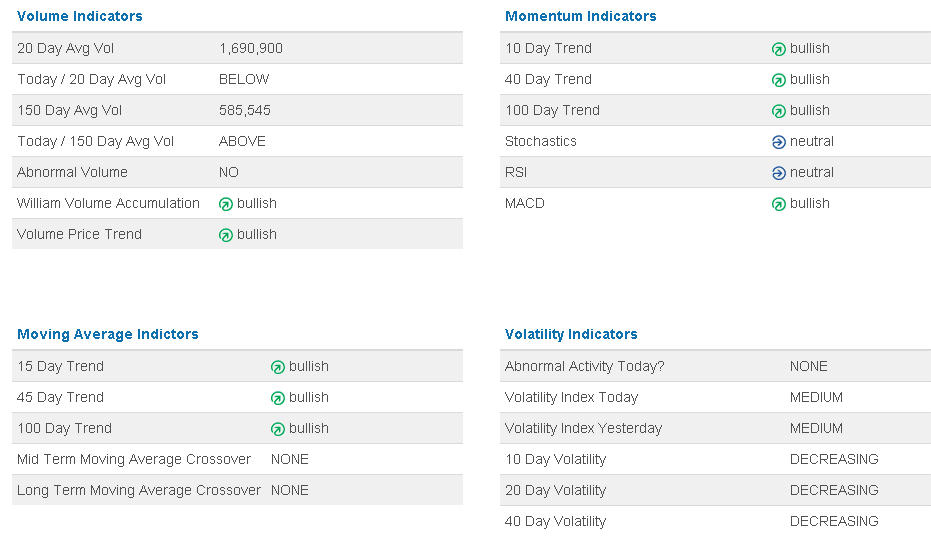
Short Interest Ratio |
As the short interest rises as a percentage of average daily share volume (Days to Cover), this is considered a measure of negative sentiment. Similarly, a decrease in that percentage is considered positive sentiment.
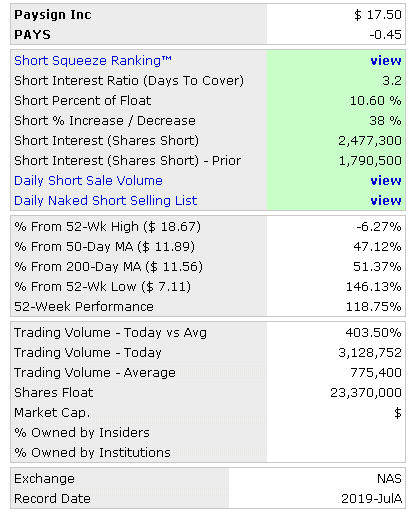

Standard & Poor's |
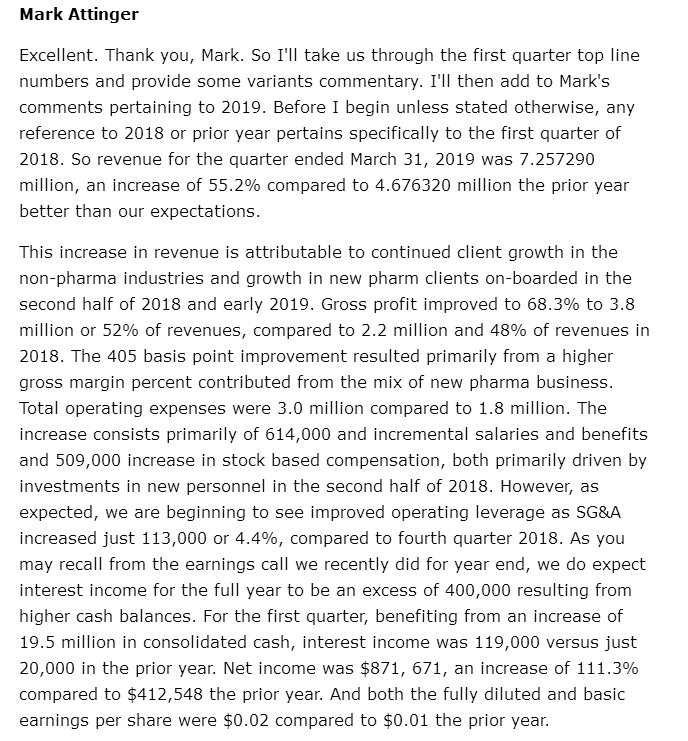
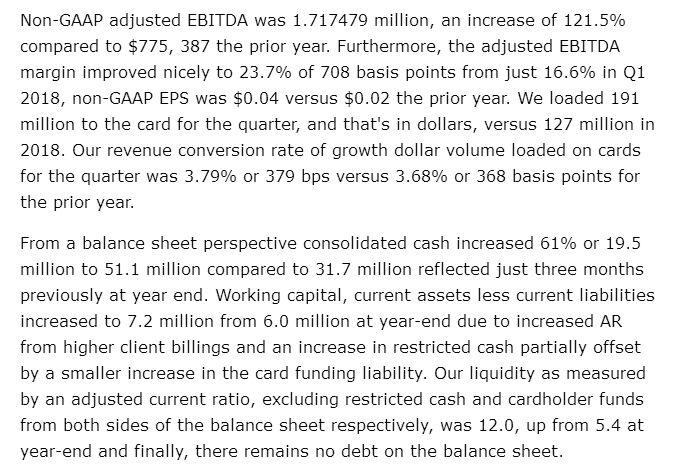
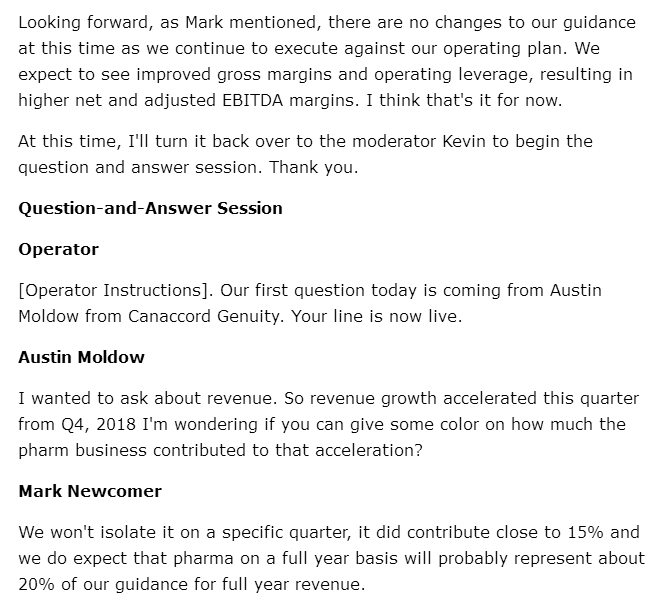
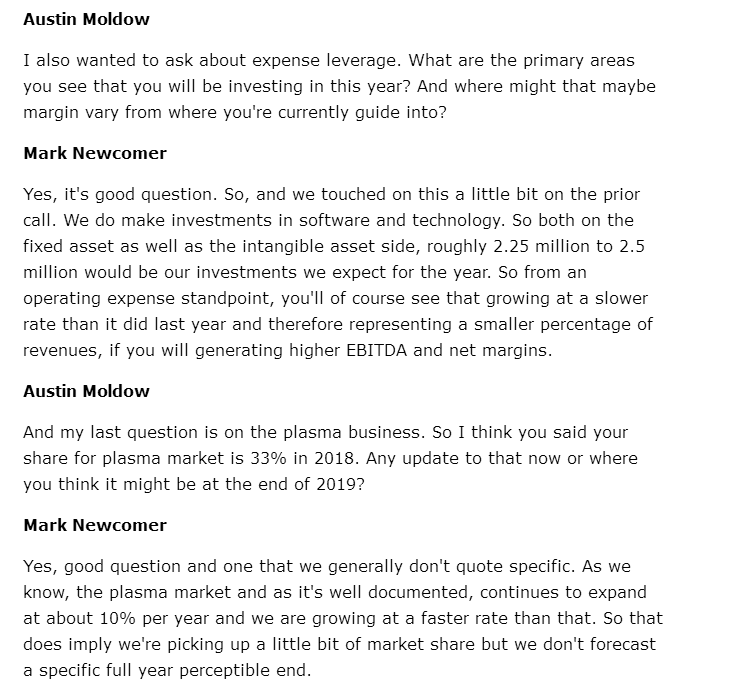
Management's Discussion of Results of Operations Excerpts |
Channeling Potential |
The summary below includes a value for `Degree,' which refers on a
scale of 1 to 10 the range of a channel in the period under consi-
deration compared to the total range of price movement. It also looks
for the last closing price to be within the channel, otherwise zeroed.
The `Index' is the `Degree' weighted for volatility.  Generally, the
the higher the index, the more suitable is the stock for trading as
a `rolling stock' between channel high and low points.

Results for PAYSIGN INC.:
Symbol? PAYS
Total Months Available:  77
       Months in Cycle?   4

Months Covered by Periods:  12

Period 1           Period 2          Period 3
   H1      L1        H2      L2        H3      L3
   5.33    2.40      8.49    3.15     17.70    6.80

RANGE   =  17.70  TO    2.40            Close =  17.34
CHANNEL =   6.80  TO    5.33           Degree =   1
Volatility =   8.48%                    Index =   0
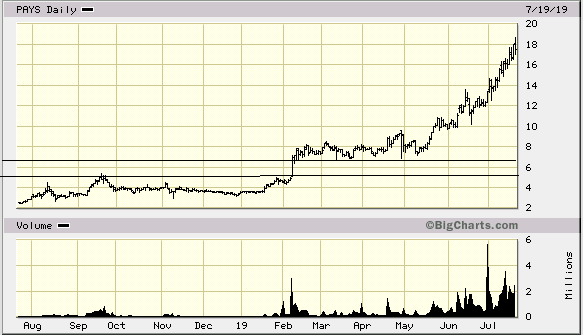
MACD Histogram Divergence |
The theory is that connecting the two most recent peaks or valleys of the MACD histogram will signal the direction of the next major move.
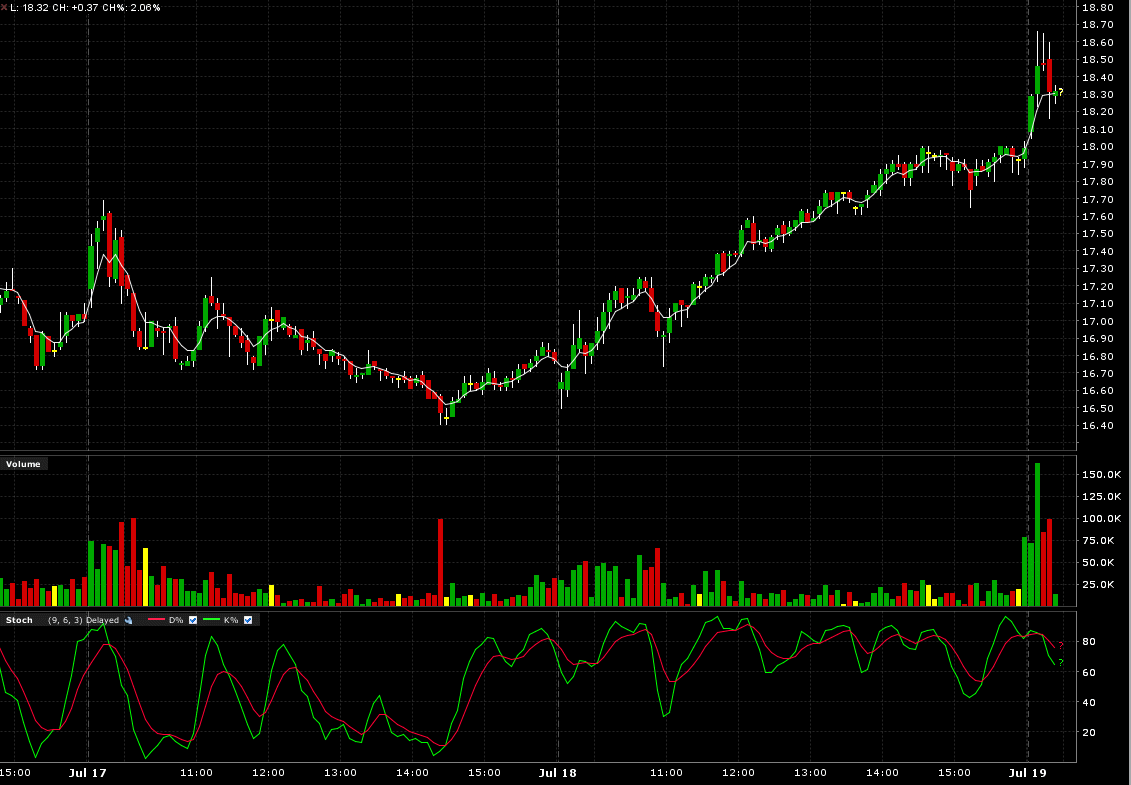
Intraday Chart |
2 Days:
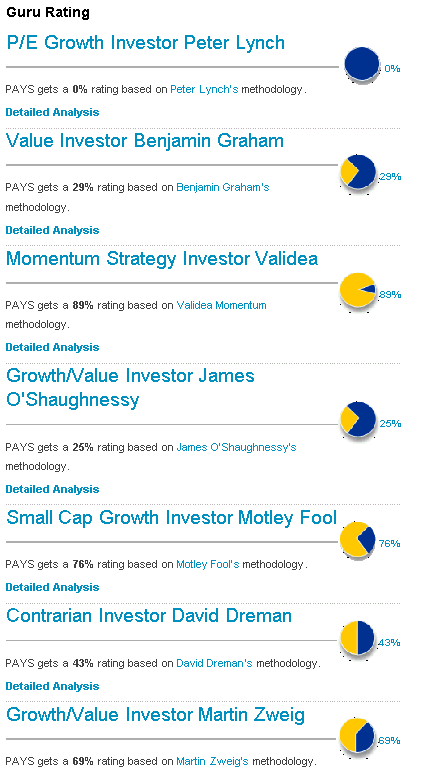
Val Idea |
4 out of 8 favorable, (neutral opinion.)

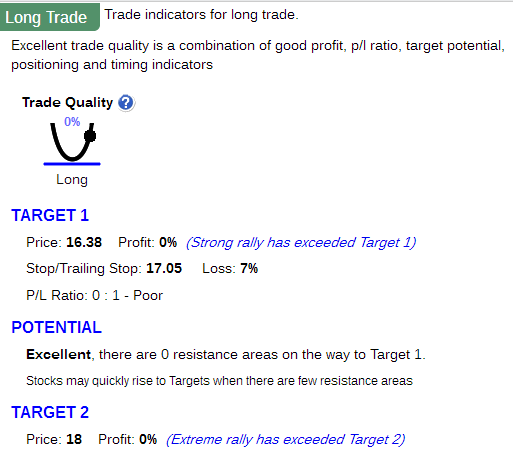
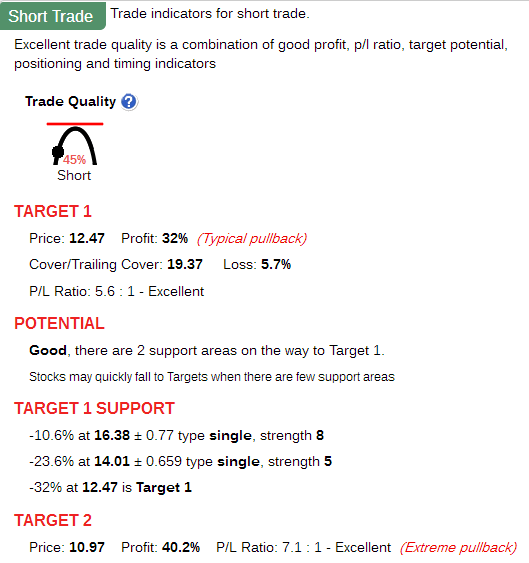
Stock Consultant |
Point & Figure Chart |
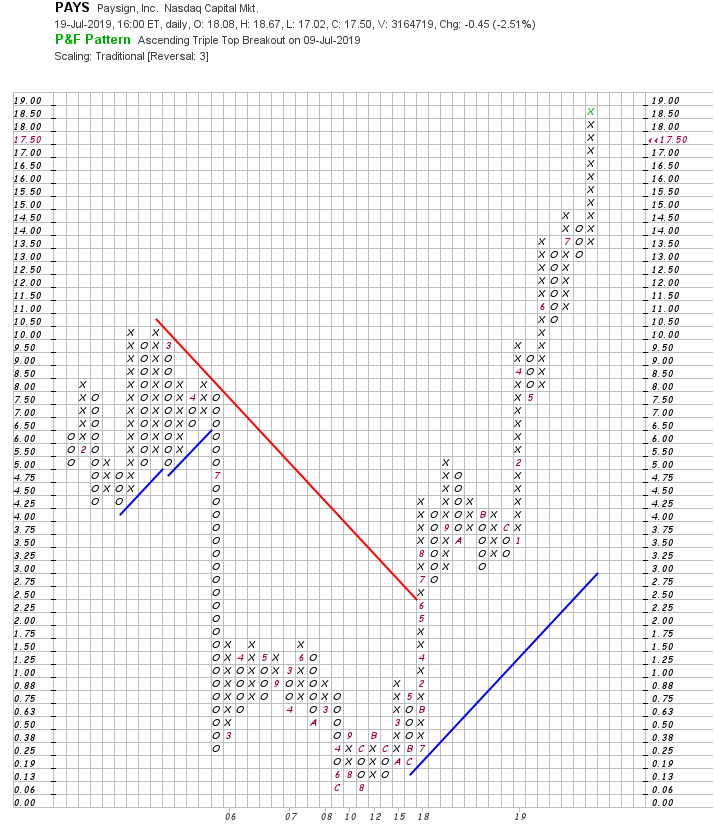
Wall Street Analyzer |
Marketspace Chart |
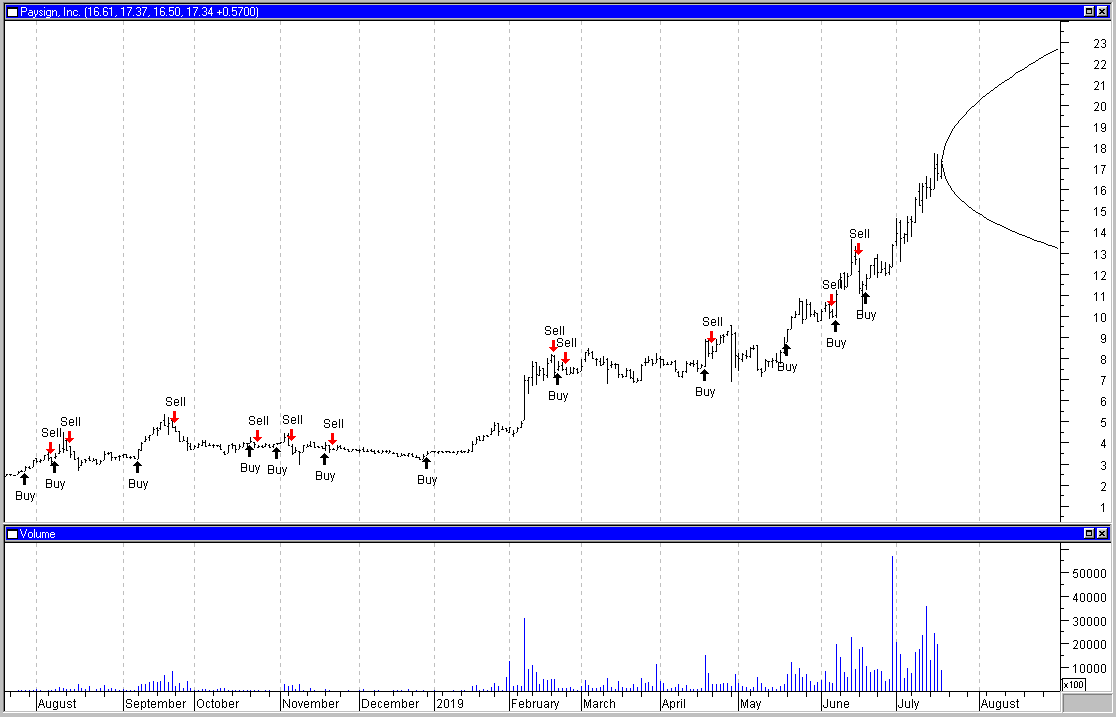
Time Series Forecast |
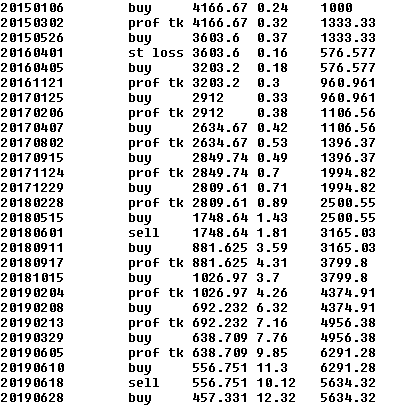
Neural Network Prediction |
"Neurostock" can only track long trades. Therefore its performance, as tracked by itself on stocks which are consistently falling, may not appear as good as it could if each "sell" signal were a "short sale."

![]()

Ultimate Trading Systems |
2 out of 3 of the ultimate systems favor an upmove.
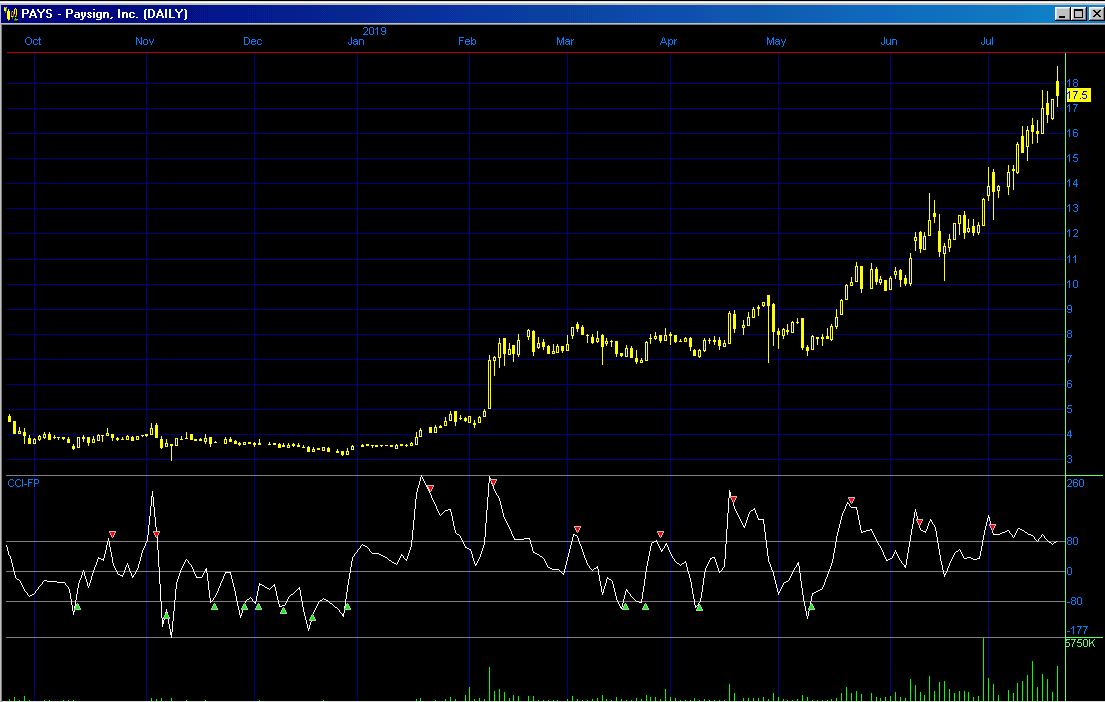
System Below:
Short term outlook: Positive: Bright Green, Negative: Bright Red
Long term outlook: Postive: Dark Green, Negative: Dark Red.

Recommendation |
| Factors | Weighted Points |
|---|---|
| News | + 1 |
| Comparison | - 1 |
| Industry | + 1 |
| Bond Issue | 0 |
| Zenith Index | + 1 |
| Non-GAAP vs. GAAP Earnings | - 1 |
| Cash Flow | + 1 |
| Average to Current P/E | - 1 |
| Ratios | - 1 |
| Intrinsic Value DCF | 0 |
| Fair Value Estimator | - 1 |
| Projected Earnings | + 1 |
| Research Reports | + 1 |
| Analysts | + 1 |
| Executive Perquisites | + 1 |
| Insider Activity | + 1 |
| Institutional Activity | + 1 |
| Management Reporting | + 1 |
| Short Interest | - 1 |
| Sentiment | + 1 |
| Standard & Poor's | + 1 |
| MACD Histogram Divergence | + 1 |
| Val Idea | - 1 |
| Stock Consultant | - 1 |
| Point & Figure | + 1 |
| Wall Street Analyzer | - 1 |
| Marketspace Chart | + 1 |
| Time Series Chart | - 1 |
| Neural Network | + 1 |
| Stock Options | + 1 |
| Ultimate Trading Systems | + 1 |
| Total | + 9 |
Place 1,715 shares of Paysign, Inc. (PAYS) on the Active List.