![]()
Corporate Webpages Universal Display Corporation
Universal Display Corporation (OLED) derives its ticker symbol
from its main area of focus and niche in specialized
electronics, namely "organic light emitting diode" technology.
This is such a hot area that in the section of this report,
average to current p/e ratios, this company has one of the
highest scores due to a blowout upcoming earnings year 2018,
when earings are anticipated to to $14. The share price hasn't
caught up with that yet.
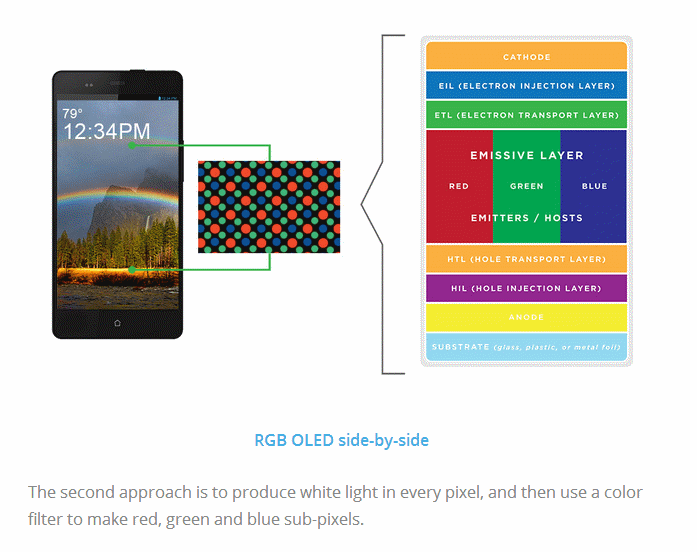
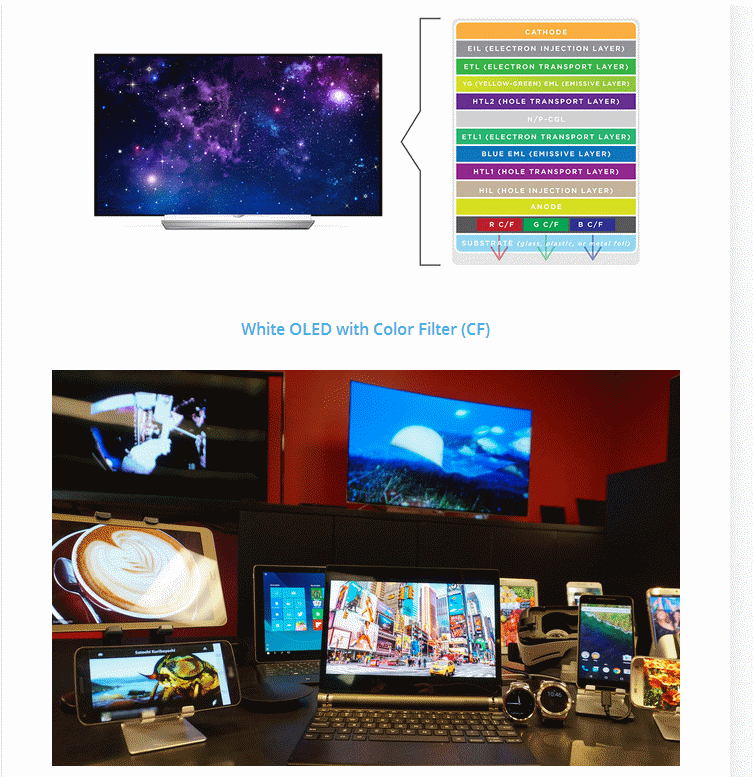
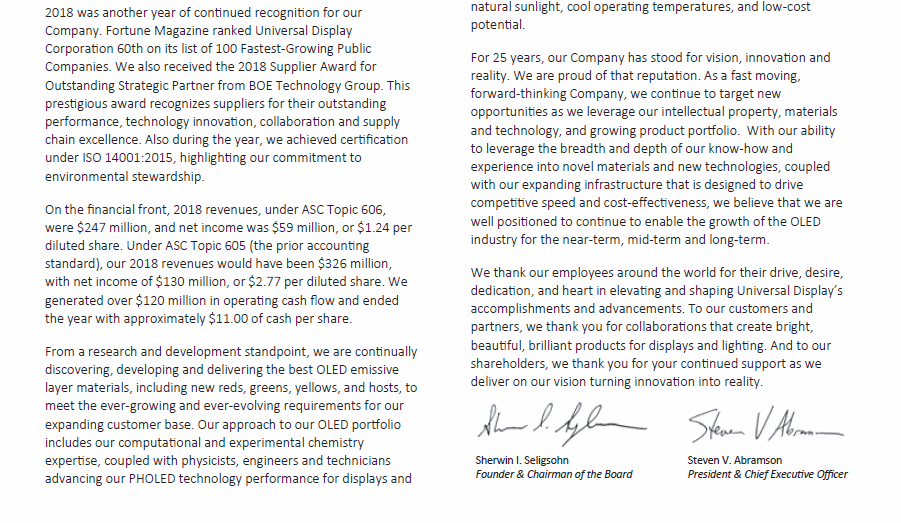
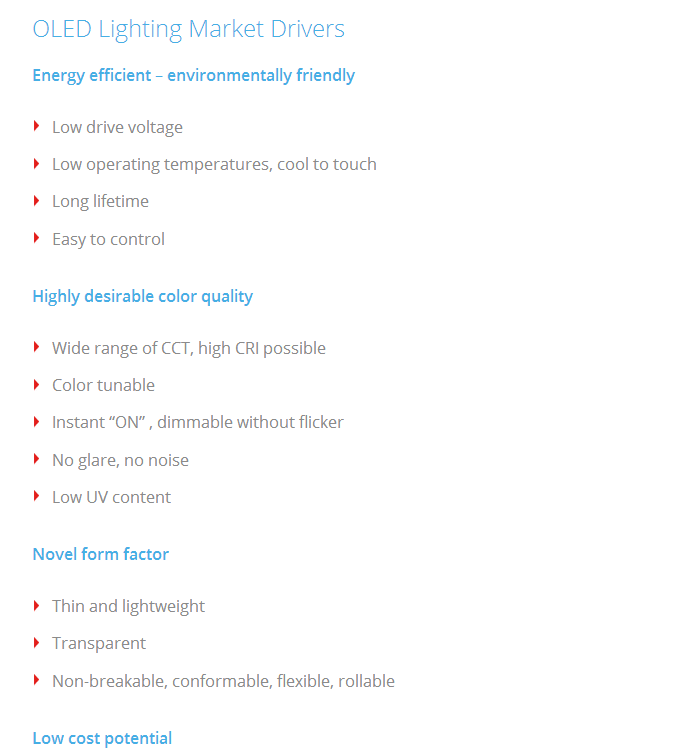
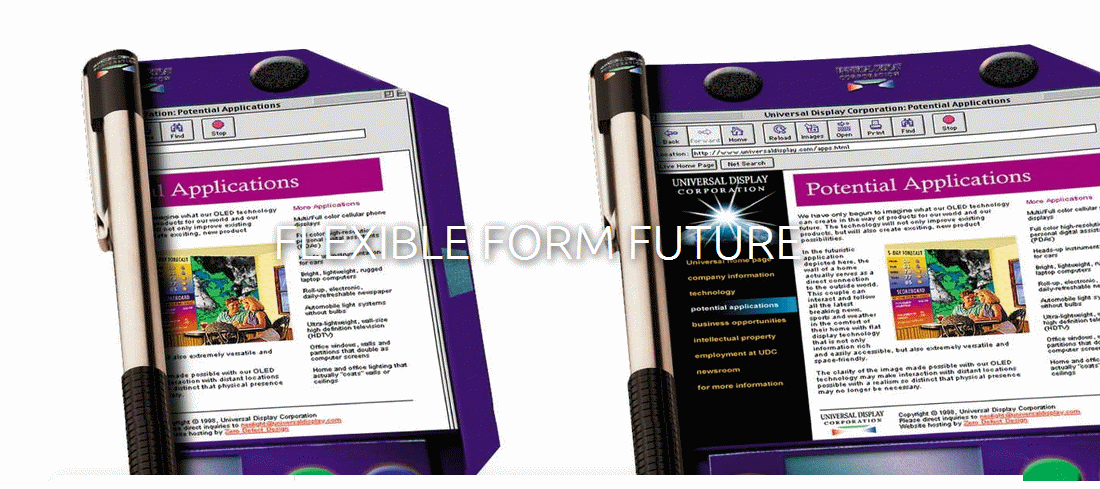
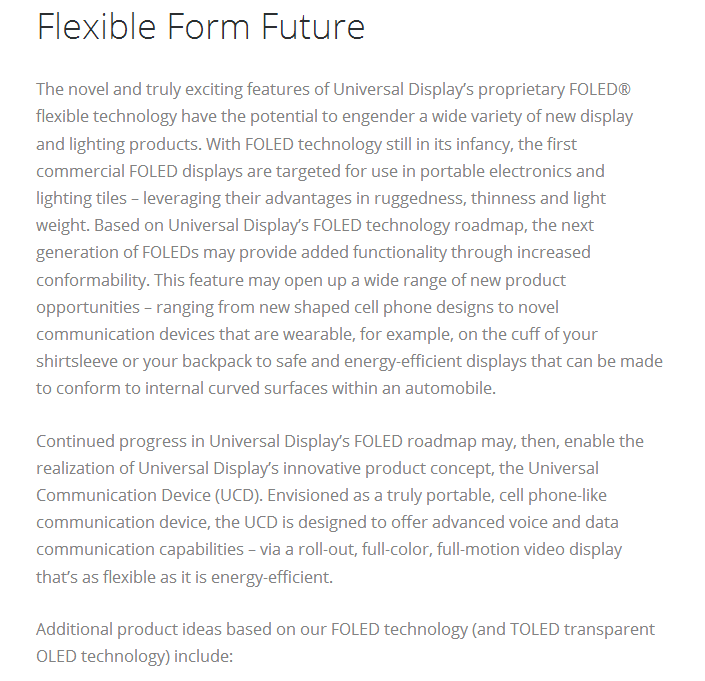
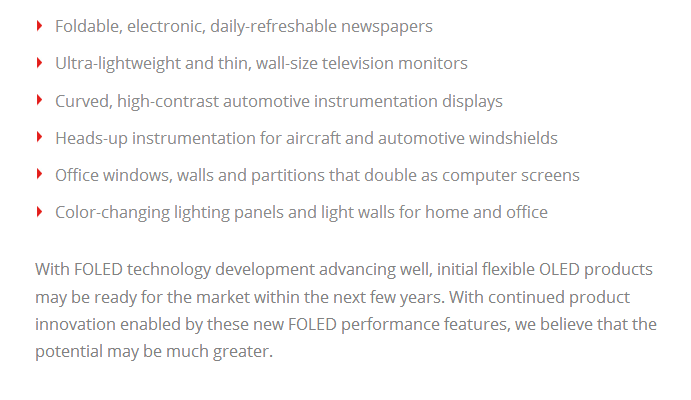
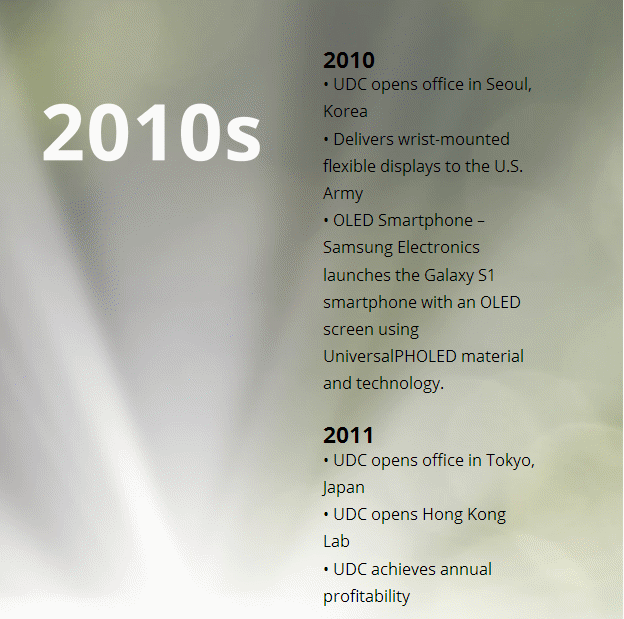
The company's OLED displays are "flexible", meaning they can
adapt to curved screen displays which several manufacturers of
TV's and smart phones are developing. Smart phones can even
have a folding screen.
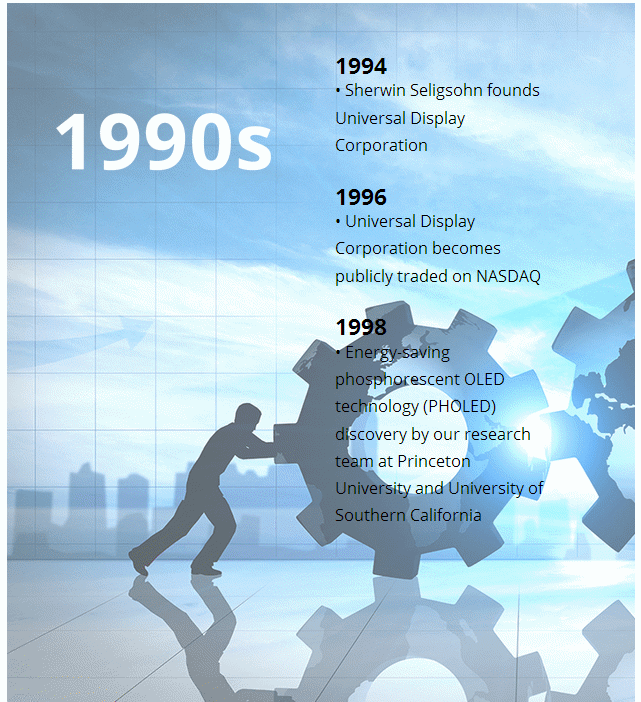
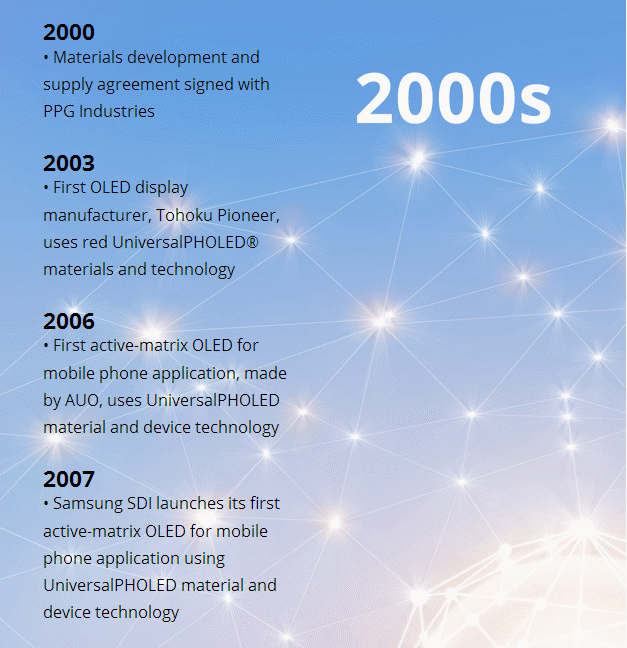
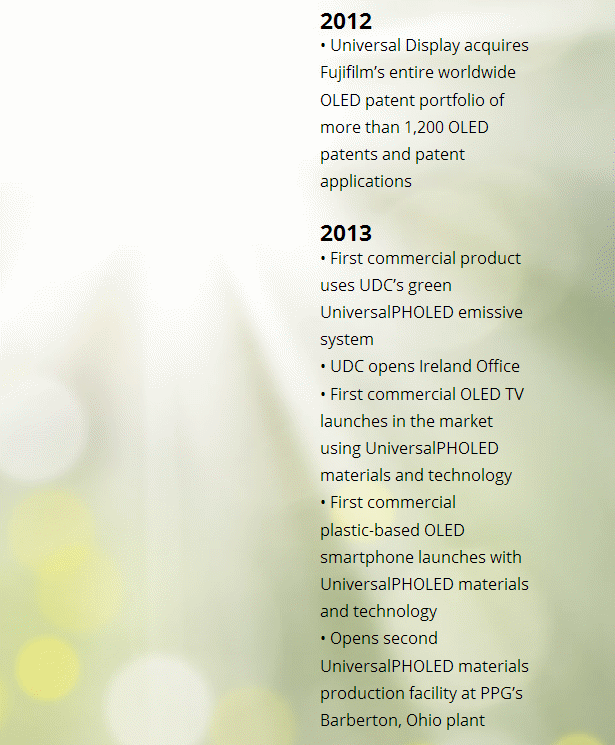
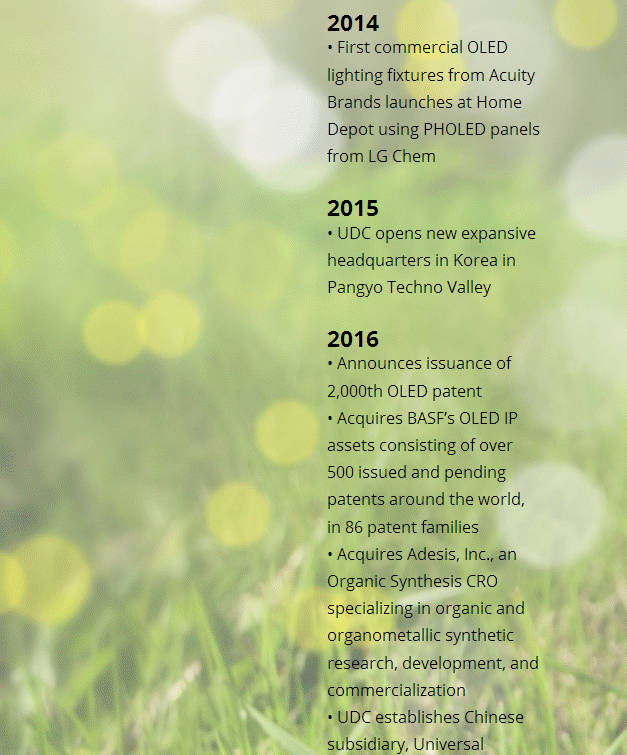
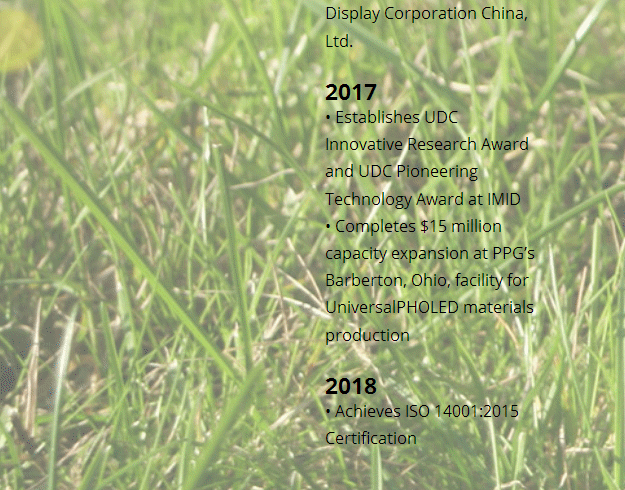
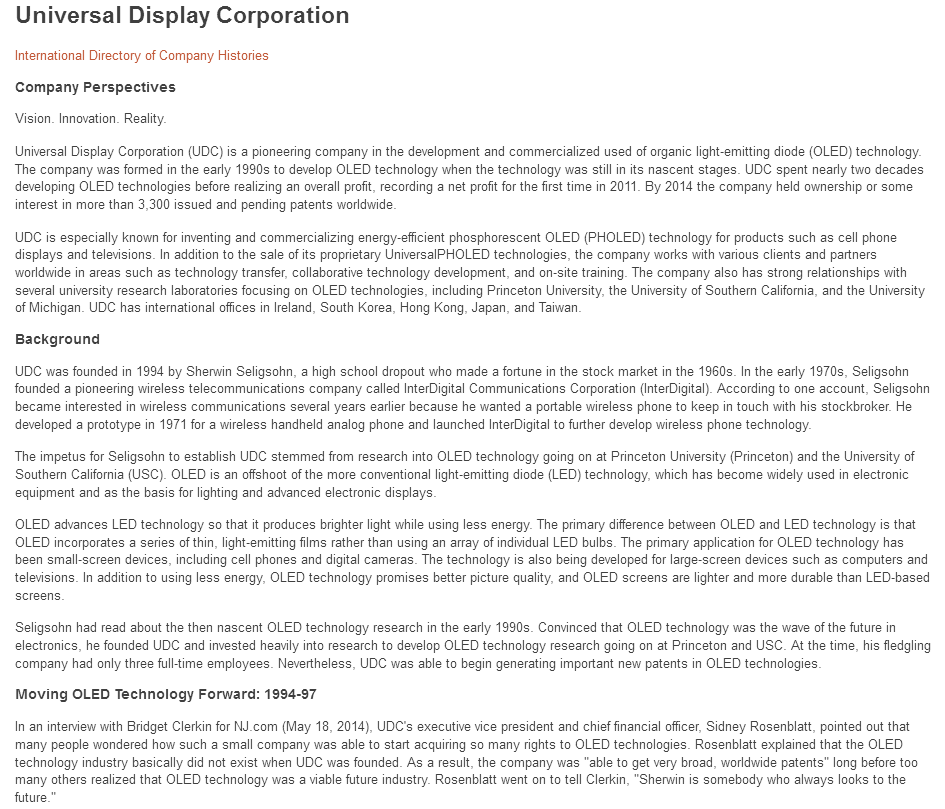
History for this relatively-recently founded company (1994)
includes shareholder concern since its NASDAQ listing in 1996.
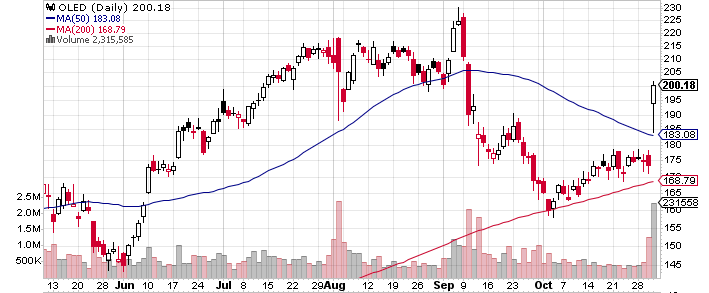
It pays a dividend of 0.2%. Recently the stock gained 11% in
one day on another blowout quarterly earnings report.
The company forms partnerships with major manufacturers of
electronic devices requiring displays. With many patents it
also has a corner on LED light source application support. News
on this company consists either of these continually expanding
partnerships, particularly in Asia, and favorable earnimgs reports.
Yes, the Trump trade war is hurting, but the technology is so
prevalently needed as to overcome a lot of what would otherwise
be resistance.
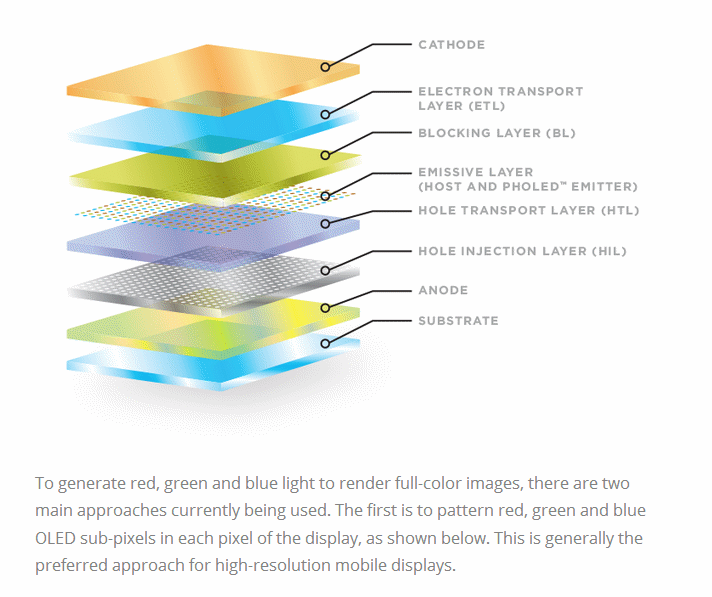
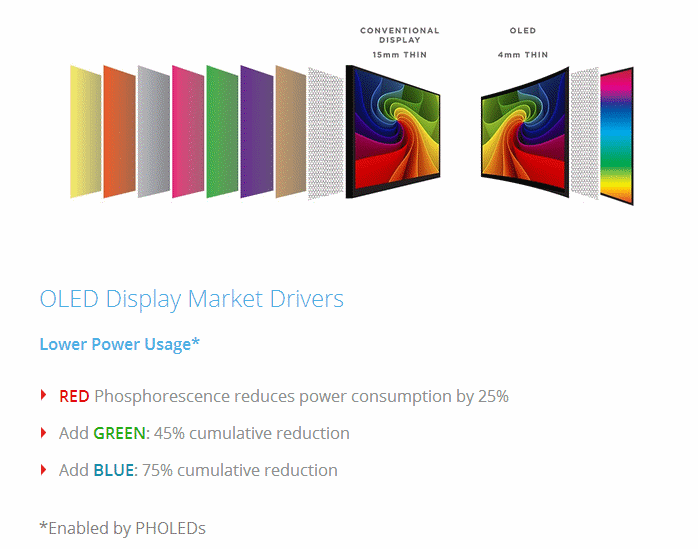
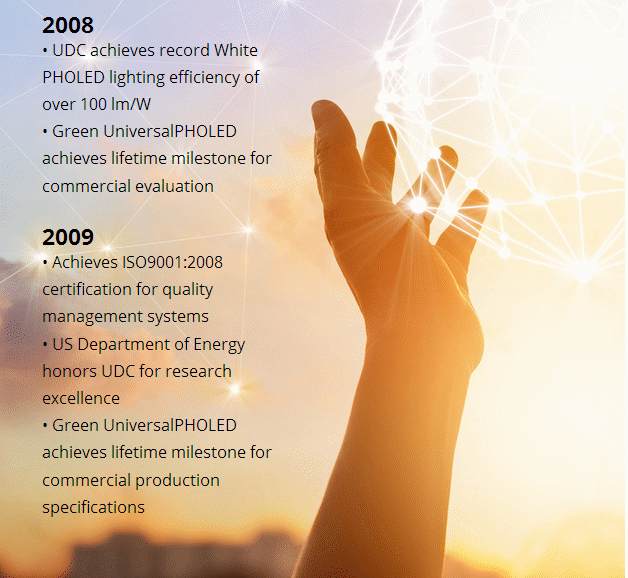
Latest technological development focuses on PHOLED's,
"Phosphorescent organic light emitting diodes" which are up to
four times as efficient as already efficient fluorescent OLED's.
Universal Display is the acknowledged world leader in the
production of these.
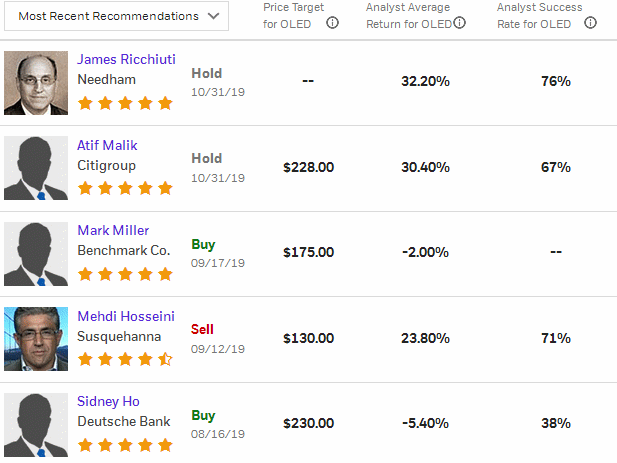
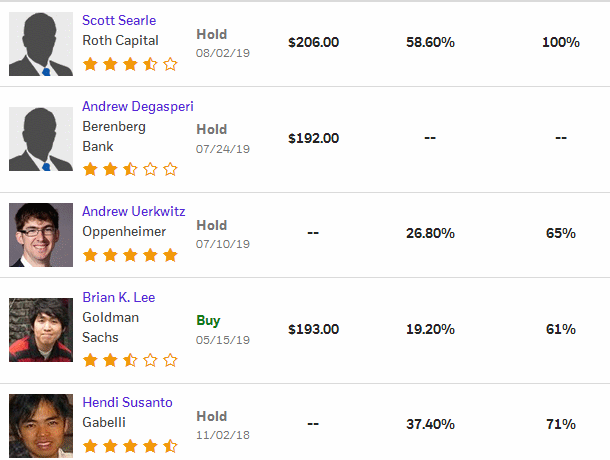
Some of the things that surprised us include reticence upon the
part of several major reviewers like Standard & Poor's along
with some outright "sell" recommendations from one or two
analysts and researchers which generally comes when a stock
share price has been run up to the extent of OLED's.
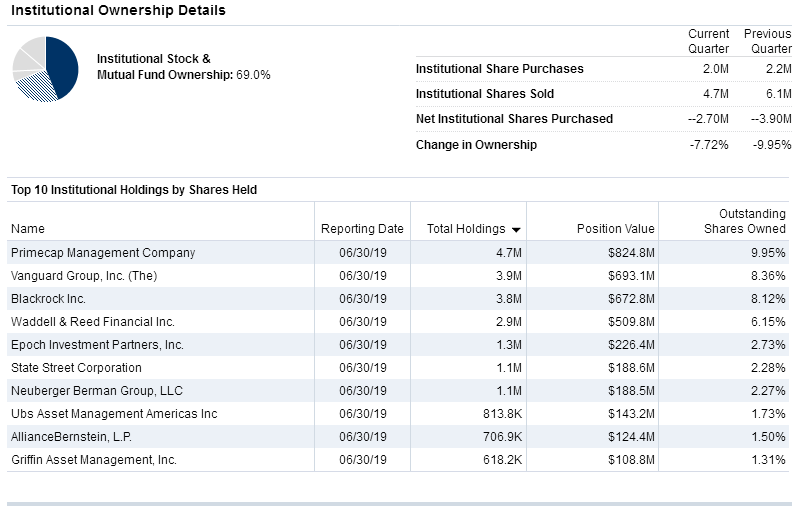
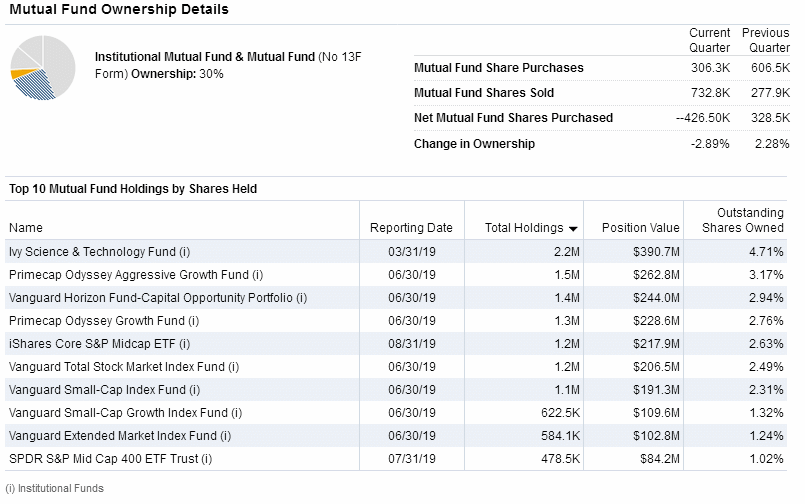
Institutions are net sellers. After all, if you owned a share
at $13 in 2009 and held onto it, it would now be worth 15 times what
you paid for it today.
(WAIT FOR PAGE TO LOAD COMPLETELY BEFORE LINKS WORK.)
Company Profile
Company History
News
Comparison with Peers
Bond Issue
Zenith Index
Financial Statements
Avg. P/E to Current P/E
Financial Ratios
Intrinsic Value (Disc. CashFlow)
Fair Value Estimator
Projected Earnings
Research Reports
Analysts' Opinions
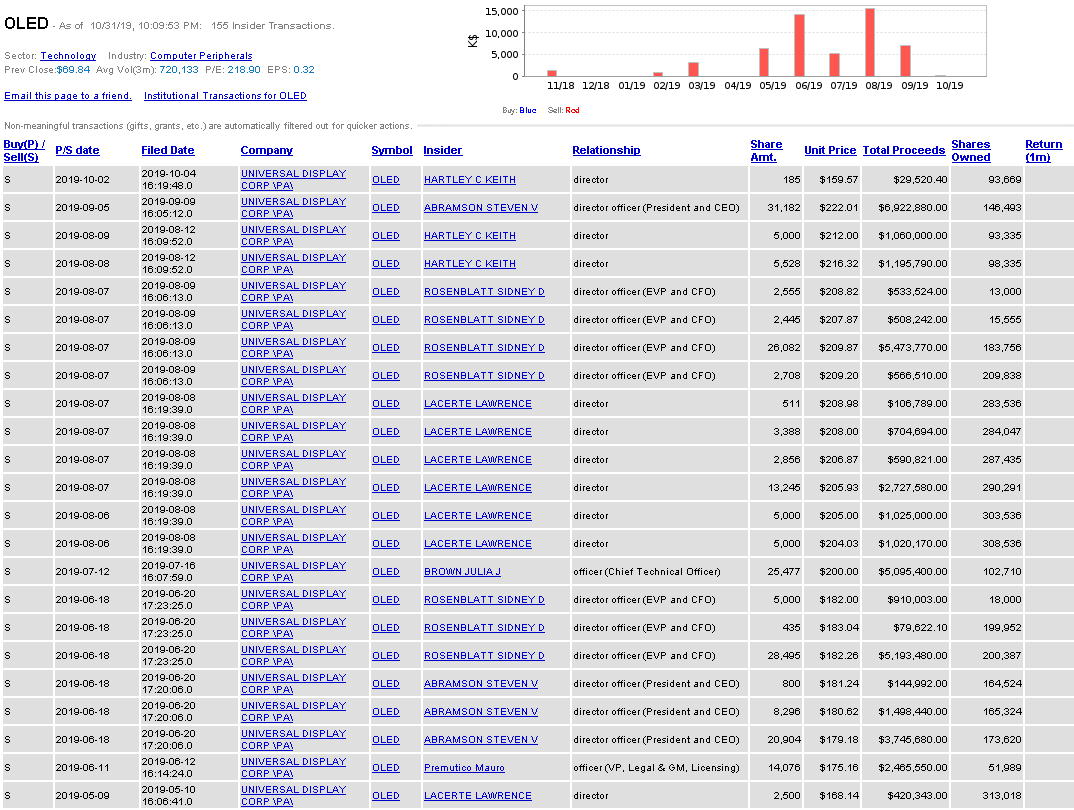
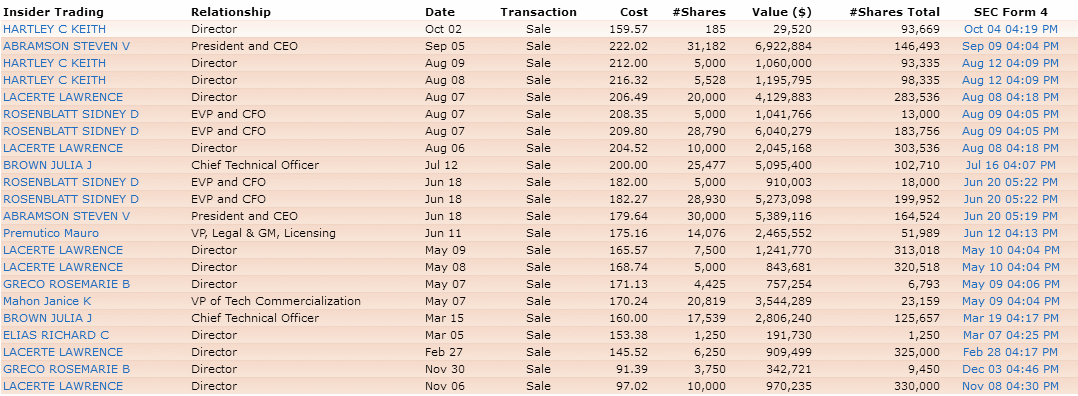
Insider Activity
Institutional Activity
Sentiment
Short Interest
Standard & Poor's
Management's Discussion
Channel Potential
MACD Histogram
Intraday Chart
Val Idea
Stock Consultant
Point & Figure Chart
Wall Street Analyzer
Marketspace Chart
Time Series Forecast
Neural Network Prediction
Stock Options
Ultimate Trading Systems
Recommendation


Company Profile |

Company History |

News |
Comparison |
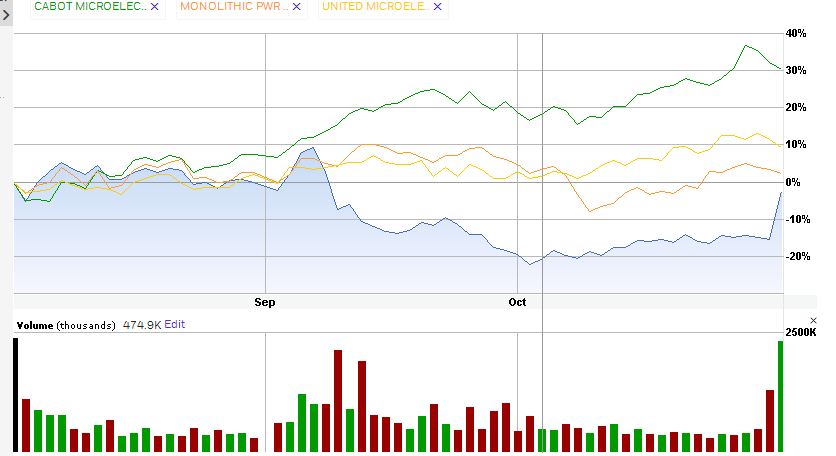
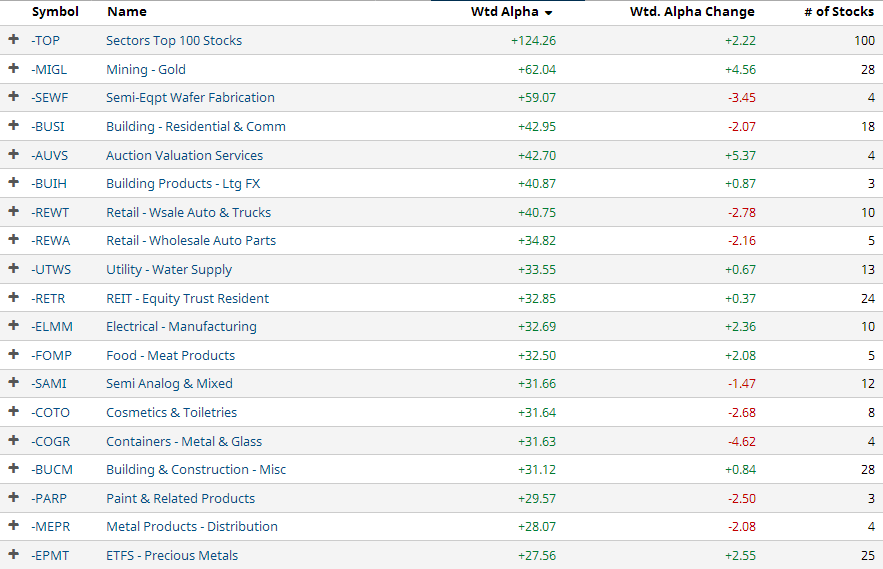
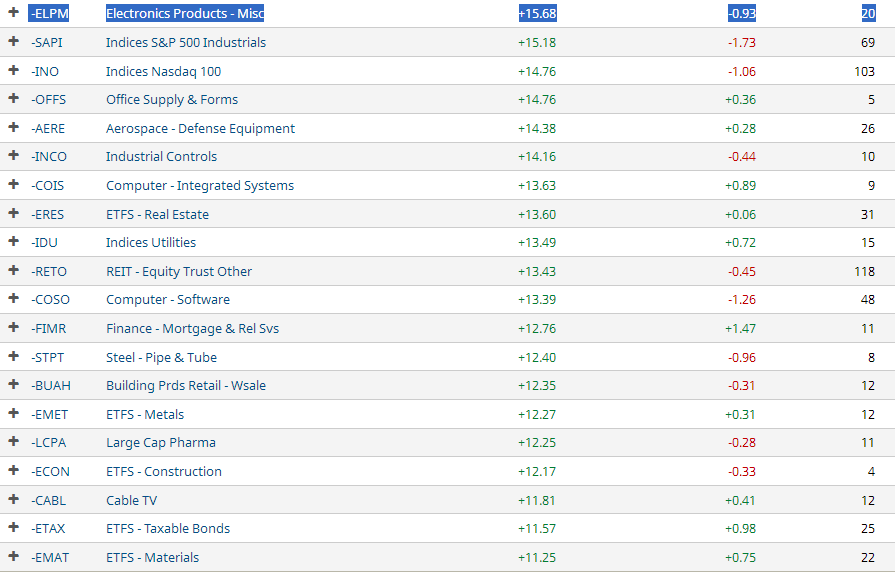
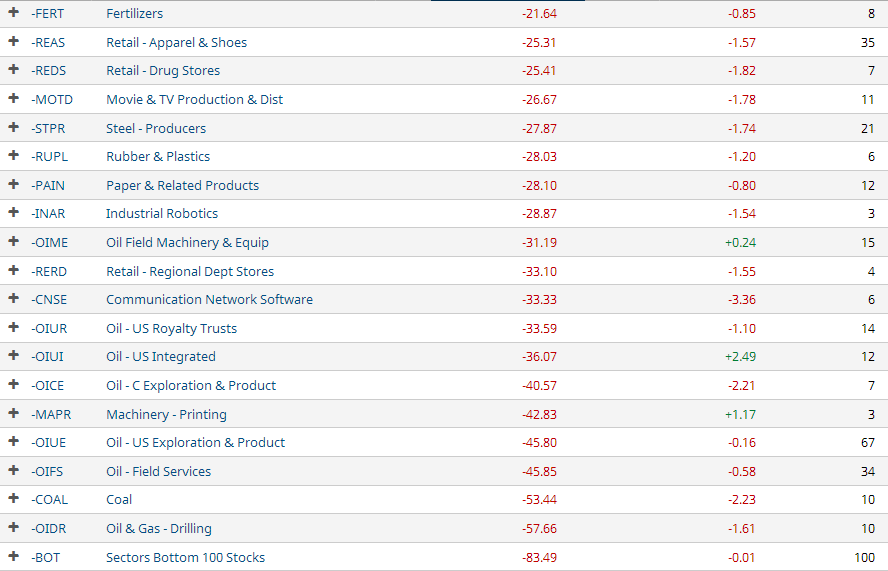
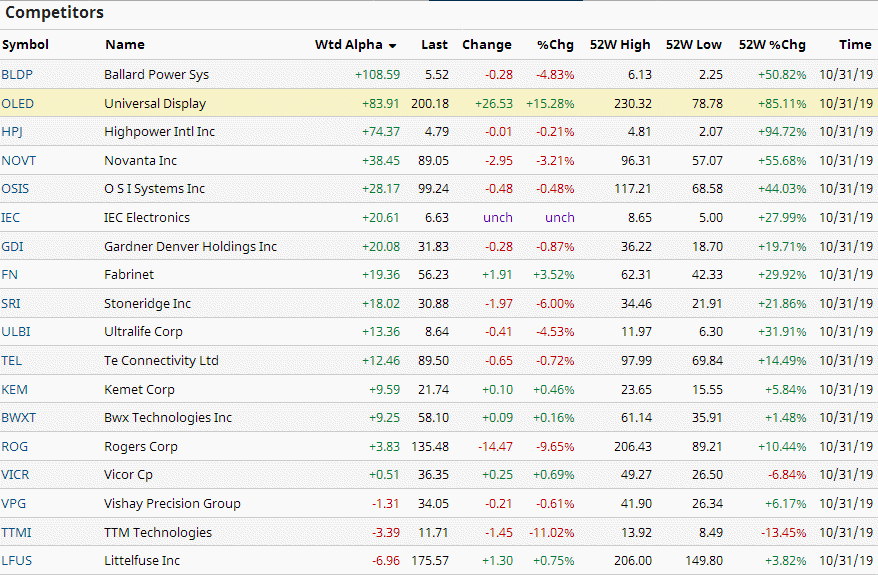
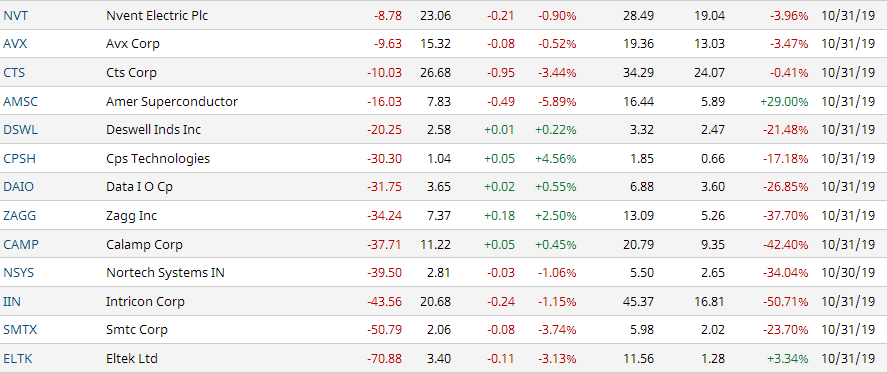
Similar Companies Performance:
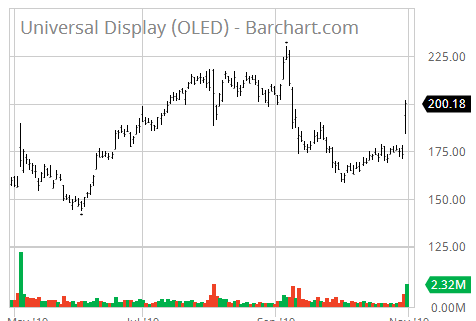
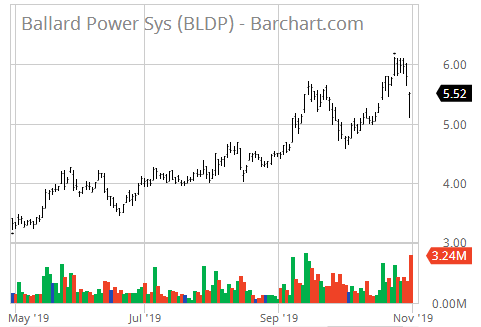
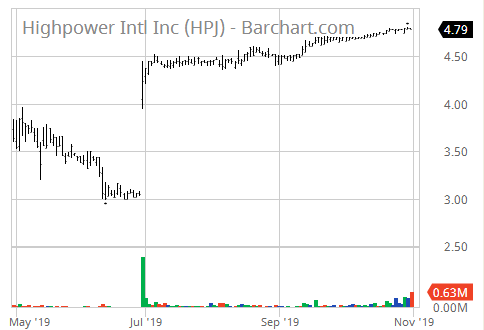
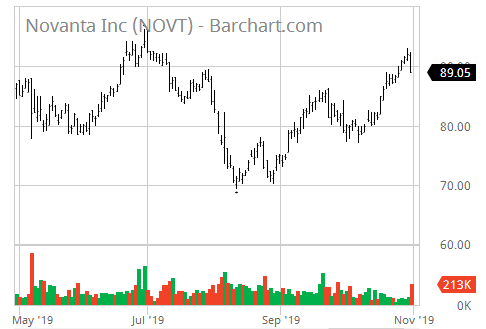
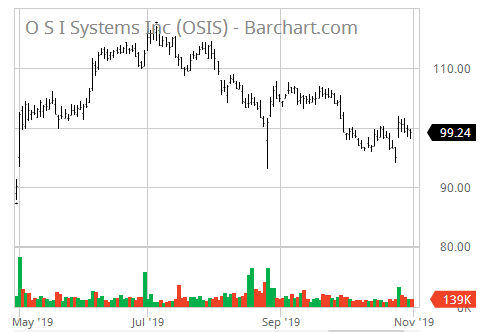
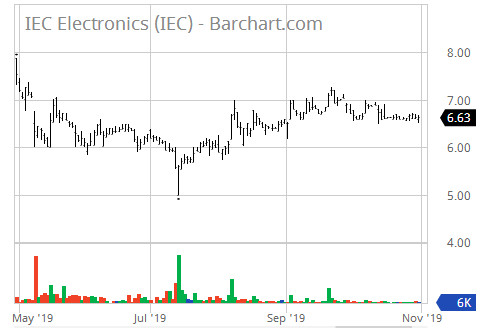
Bond Issue |

Zenith Index |
Under current market conditions, a Zenith Index Score of 1.20 or above is required for a positive rating on this factor. 1.21 -1.30 is considered acceptable, 1.30-1.40 is considered strong and
> 1.40 is considered exceptionally strong. Accounting statements in this section often contain mistakes, especially in earlier years' totals, but data is deemed sufficient for us to give a rating. More accurate financial statements follow in the next section.
OLED  Universal Display Corporation
   Exchange: NASDAQ     Group: Sector              Industry: Industry
   Rank of Industry:  15                   Rank within Industry: 217

      Shares Out:   47.11 (mil.)   Market Capitalization:$  9,429.78 (mil.)
      Sales (12 mo.): $    247.00 (mil.)              Sales Growth:  25.74%
      Avg Broker Recommend (1=Strong Buy): 2.78   Consensus Target: 204.50
      Dividend:$ 0.00  Yield: 0.20%  Payout Ratio: 0.16  Payout Chg:  0.00%

      Ewing, NJ-based Universal Display Corporation is a leading developer of
      technology and intellectual property (IP) for the Organic Light Emitting
      OLEDs are thin, lightweight and power-efficient solid-state devices that
      OLEDs can be manufactured on both flexible and rigid substrates, making
      them highly suitable for use in full-color displays and also as lighting
      Unlike LEDs, OLEDs can be viewed directly and doesn_ÇÖt need diffusers. It
      is also expected to be cost-effective when manufactured in high volumes,
      which makes it suitable for commercial application in the solid-state
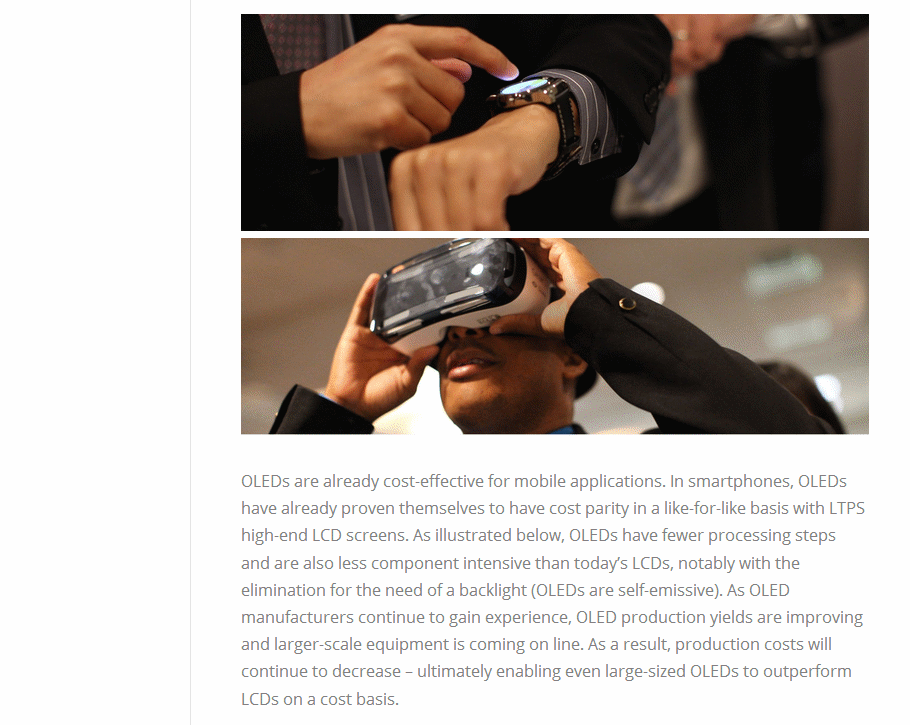
      OLED is suitable for commercial usage in a number of industries,
      including smartphones, television, virtual reality devices and automotive markets.

   Recent Price: 200.18     52-Week High: 230.32     52-Week Low:  78.78

   20-Day Avg. Daily Volume =    567,160                    Beta:   1.52

Earnings per Share (EPS) Estimates:

                        This        Next        This        Next
                       Quarter     Quarter      Year        Year
                      12/2019     03/2020     12/2019     12/2020

    Average Estimate      0.49        0.00        3.80        0.00
 Number of Estimates         3           2           4           4
        Low Estimate      0.49        0.68        2.60        3.74
       High Estimate      0.80        0.82        2.80        4.20
        Year Ago EPS      0.40        0.66        1.24        2.68
          EPS Growth     57.50%      13.64%     116.13%      45.80%

P/E Ratio Related Data:                                    EPS       Sales
  Current FY Estimate:  72.53                              Growth    Growth
   Trailing 12 Months:  74.62       vs. Previous Quarter:  -15.22%   -17.48%
     P/E Growth Ratio:   2.49          vs. Previous Year:   62.50%    25.74%

Price/Sales Ratio: 25.24    Price/Book Ratio: 11.99    Price/Cash Flow: %655.77

Other Fundamental Data:
                         09/30/19     06/30/19      03/31/19
Return on Investment         0.00        16.52         12.35
Return on Assets            13.51        12.32          9.32
Current Ratio                0.00         4.93          4.96
Quick Ratio                  4.50         4.50          4.44
Operating Margin            35.10        33.08         28.93
Net Margin                  35.10        33.08         28.93
Pre-Tax Margin               0.00         0.00          0.00
Book Value                  14.66        14.02         11.27
Inventory Turnover           0.00         1.11          0.94
Debt-to-Equity Ratio         0.00         0.00          0.00
Debt-to-Capital Ratio        0.00         0.00          0.00

Reported and Estimated Quarterly Earnings:
Reported                                09/2019   06/2019   03/2019   12/2018
                                           0.78      0.92      0.66      0.40
Estimated                              12/2019   03/2020   12/2019   12/2020
  Consensus 7 Days Ago                     0.59      0.67      2.68      3.89
  Upward Revisions                            1         2         0         1
  Downward Revisions                          0         0         0         0
  Consensus 30 Days Ago                    0.59      0.67      2.68      3.89
  Upward Revisions                            1         2         0         1
  Downward Revisions                          0         0         0         0


Annual Income Statements ($mil except EPS data):

                                   12/31/18 12/31/17 12/31/16 12/31/15 12/31/14

Sales                                247.00   336.00   199.00   191.00   191.00
Cost of Goods                         54.00    55.00    26.00    63.00    41.00
Gross Profit                         194.00   281.00   173.00   128.00   150.00
Selling, Deprec, Amort Expense       137.00   135.00   104.00    96.00    91.00
Income After Deprec + Amortization    57.00   146.00    68.00    32.00    59.00
Non-Operating Income                   8.00     3.00     0.00     1.00     1.00
Interest Expense                       0.00     0.00     0.00     0.00     0.00
Pretax Income                         64.00   150.00    69.00    33.00    59.00
Income Taxes                           5.00    46.00    21.00    18.00    17.00
Minority Interest                      0.00     0.00     0.00     0.00     0.00
Investment Gains/Losses                0.00     0.00     0.00     0.00     0.00
Other Income/Charges                   0.00     0.00     0.00     0.00     0.00
Income from Continuing Operations     59.00   104.00    48.00    15.00    42.00
Extras + Discontined Operations        0.00     0.00     0.00     0.00     0.00
Net Income                             0.00   104.00    48.00    15.00    42.00
Income before Depr. + Amortization    12.00   159.00    80.00    37.00    67.00
Depreciation + Amort. (Cash Flow)      0.00     0.00     0.00     0.00     0.00
Average Shares                        46.90    46.81    46.54    47.49    46.69
Diluted EPS bf Non-Recurring Items     1.24     2.43     1.02     0.94     0.90
Diluted Net EPS                        1.24     2.18     1.02     0.31     0.90


Balance Sheets ($mil. except per share data):

                                   12/31/18 12/31/17 12/31/16 12/31/15 12/31/14
Assets:

Cash + Equivalents                     0.00   515.00   420.00   328.00   395.00
Receivables                           43.00    52.00    25.00    25.00    22.00
Notes Receivable                       0.00     0.00     0.00     0.00     0.00
Inventories                           70.00    36.00    17.00    13.00    37.00
Other Current Assets                   6.00    10.00    15.00    15.00    23.00
Total Current Assets                 635.00   519.00   385.00   448.00   371.00
Property, Plant & Equipment           70.00    56.00    27.00    22.00    20.00
Investments + Advances                 0.00    15.00    15.00     2.00     3.00
Other Non-Current Assets               0.00     0.00     0.00     0.00     0.00
Deferred Charges                      24.00    27.00    16.00    15.00    13.00
Intangibles                          140.00   162.00   184.00    72.00    83.00
Deposits + Other Assets               65.00     1.00     0.00     0.00     0.00
Total Assets                           0.00   933.00   780.00   628.00   559.00


                                   12/31/18 12/31/17 12/31/16 12/31/15 12/31/14
Liabilities:

Notes Payable                          0.00     0.00     0.00     0.00     0.00
Accounts Payable                      11.00    14.00     8.00     7.00     9.00
Current Portion Long-Term Debt         0.00     0.00     0.00     0.00     0.00
Current Portion Capital Leases         0.00     0.00     0.00     0.00     0.00
Accrued Expenses                      36.00    35.00    20.00    17.00    15.00
Income Taxes Payable                   0.00     0.00     0.00     0.00     0.00
Other Current Liabilities             87.00    15.00    12.00    10.00     3.00
Total Current Liabilities            133.00    64.00    40.00    35.00    27.00
Mortgages                              0.00     0.00     0.00     0.00     0.00
Deferred Income Taxes                 42.00    24.00    31.00    36.00     3.00
Convertible Debt                       0.00     0.00     0.00     0.00     0.00
Long-Term Debt                         0.00     0.00     0.00     0.00     0.00
Non-Current Capital Leases             0.00     0.00     0.00     0.00     0.00
Other Non-Current Liabilities         68.00    33.00    28.00    23.00    11.00
Minority Interest                      0.00     0.00     0.00     0.00     0.00
Total Liabilities                      0.00   243.00   121.00    99.00    93.00

                                   12/31/18 12/31/17 12/31/16 12/31/15 12/31/14
Shareholder Equity:

Preferred Stock                        0.00     0.00     0.00     0.00     0.00
Common Sock                            0.00     0.00     0.00     0.00     0.00
Capital Surplus                      617.00   611.00   604.00   590.00   581.00
Retained Earnings                    130.00    99.00   -26.00   -74.00   -88.00
Other Equity                         -16.00   -11.00   -11.00   -10.00    -4.00
Treasury Stock                        41.00    40.00    40.00    40.00    40.00
Total Shareholder Equity             691.00   659.00   528.00   467.00   449.00
Total Liabilities+ Owners' Equity    933.00   780.00   628.00   559.00   490.00
Total Common Equity                    0.00     0.00     0.00     0.00     0.00
Shares Outstanding                    47.10    47.00    46.90    46.70    45.60
Book Value per Share                  14.66    14.02    11.27    10.00     9.84


Cash Flow Statement:

    Operations, Investments, & Financial Activities

                                   12/31/18 12/31/17 12/31/16 12/31/15 12/31/14

Net Income                             0.00    58.84   103.89    48.07    14.68
Depreciation/Amortization + Deplet   -44.46    12.91    11.53     4.39     8.27
Net Change in Assets/Liab.            79.12   -23.24     8.79    43.94   -20.23
Net Cash f Discontinued Operations     0.00     0.00     0.00     0.00     0.00
Other Operating Activities            28.29    39.81    11.95    50.60    17.38
Net Cash f Operating Activities        0.00   121.80   133.37    80.34   113.61
Property + Equipment                 -25.39   -29.80    -7.30    -5.10    -6.15
Acquisition/Disp. of Subsidiaries      0.00     0.00   -33.38     0.00     0.00
Investments                            4.39   -95.78    98.20   -53.46   -36.16
Other Investing Activity               0.00     0.00   -95.99     0.00     0.00
Net Cash from Investing              -21.00  -125.58   -38.47   -58.57   -42.31

    Use of Funds

                                   12/31/18 12/31/17 12/31/16 12/31/15 12/31/14

Issue (Repurchase) Capital Stock       0.32     0.77     0.62     2.39   -27.29
Issuance (Repayment) of Debt           0.00     0.00     0.00     0.00     0.00
Increase/Decrease Short-Term Debt      0.00     0.00     0.00     0.00     0.00
Dividends + Distributions              0.00     0.00     0.00     0.00     0.00
Other Financing Acitivies            -11.62    -9.43    -0.64    -5.34    -2.84
Net Cash from Financing              -22.61   -14.31    -0.01    -2.95   -30.13
Effect of Exchange Rate Changes        0.00     0.00     0.00     0.00     0.00

Net Change in Cash + Equivalents      78.18    -6.53    41.85    52.10   -25.17

    Net Change in Cash & Equivalents

                                   12/31/18 12/31/17 12/31/16 12/31/15 12/31/14

Cash at Beginning of Per.            132.84   139.37    97.51    45.42    70.59
Cash at End of Period                211.02   132.84   139.37    97.51    45.42
Net Change in Cash + Equivalents      78.18    -6.53    41.85    52.10   -25.17


Zenith Indices:                      [Indices near +3.0, or near zero,
                                     or < zero bear special attention.]
P/E Ratio Tests:
Current P/E Ratio < 28?    0.3752     P/E Ratio > 5?             1.0000
P/E Ratio Vs Growth Rate:  1.5563     Forward P/E Ratio < 28?    0.3860

Sales Tests:
Sales < $500 mil.?         1.4881     Sales incr. 25% Yearly?    1.0296
Sales > $340 million?      0.9882     Inventory/Sales < 5%?      0.4667

Balance Sheet Tests:
Debt/Equity Ratio < 0.40?  3.0000     LTD/Net Assets:            3.0000
Debt Reduction:            3.0000     Intangibles/Assets < 10%?  0.5759
Current Ratio > 2?         3.0000     Return on Equity > 9.8%?   1.6857

Earnings Tests:
EPS 5-Yr. Growth > 18%?    3.0000     Operating Margin > 5%?     0.1511
EPS Annual Growth > 0%?   -1.5220     Dividend Rate cp 2.7%:     0.0741
Earnings Consistent?       1.6667     Payout Ratio Decreasing?   0.0160
Net Income Increasing 25%? 1.7333     Price<15% below 52-wk Hi?  0.9995
Positive Cash Flow?        0.9531     Price/Book X PE < 22?      0.0246
Profit Margin > 7.5%?      3.0000     Price/Book < 1.6?          0.1334
Profit Margin Increasing?  1.1434     Stock Compared to S+P 500:-3.0000

Price & Float Tests:
Return on Investment>12%?  0.9718     Shares Out > 50 mil.?      0.9422
Return on Assets > 10%?    0.7767     Beta > 1.25?:              1.5200
Price/Sales Ratio < 2.3?   1.2350     Liquidity > 2%?            3.0000

Ownership Tests:
Analyst Following > 2.0?   1.0791     Market Capital'n > 300M?   3.0000
Owner's Equity Increasing? 1.4677     Shares Out Decreasing?     0.9702

OLED                                   Overall Zenith Index:     1.3298
UNIVERSAL DISPLAY CORP  (OLED)              INCOME STATEMENT

Fiscal year ends in December.                        2014-12         2015-12         2016-12         2017-12         2018-12             TTM

Revenue                                          191,031,008     191,046,000     198,886,000     335,628,992     247,414,000     373,591,008
Cost of revenue                                   41,315,000      62,997,000      26,288,000      54,698,000      53,541,000      75,497,000
Gross profit                                     149,716,000     128,049,000     172,598,000     280,931,008     193,872,992     298,094,016


Operating expenses
Research and development                          41,154,000      44,641,000      42,744,000      49,144,000      53,717,000      66,244,000
Sales, General and administrative                 28,135,000      29,046,000      32,876,000      46,808,000      46,999,000      53,057,000
Other operating expenses                          21,807,000      22,086,000      28,565,000      38,732,000      36,422,000      39,666,000
Total operating expenses                          91,096,000      95,773,000     104,185,000     134,684,000     137,138,000     158,967,008

Operating income                                  58,620,000      32,276,000      68,413,000     146,247,008      56,735,000     139,127,008
Interest Expense                                      70,000          54,000               0               0               0               0
Other income (expense)                               777,000         837,000         185,000       3,290,000       7,576,000      11,563,000
Income before taxes                               59,327,000      33,059,000      68,598,000     149,536,992      64,311,000     150,690,000
Provision for income taxes                        17,473,000      18,381,000      20,528,000      45,652,000       5,471,000      19,565,000
Net income from continuing operations             41,854,000      14,678,000      48,070,000     103,885,000      58,840,000     131,125,000
Net income                                        41,854,000      14,678,000      48,070,000     103,885,000      58,840,000     131,125,000
Preferred dividend                                         0               0               0       1,638,000         690,000       1,131,000
Net income available to common shareholders       41,854,000      14,678,000      48,070,000     102,247,000      58,150,000     129,994,000

Earnings per share
Basic                                                   0.90            0.31            1.02            2.19            1.24            2.77
Diluted                                                 0.90            0.31            1.02            2.18            1.24            2.77

Weighted average shares outstanding
Basic                                             46,252,960      46,816,392      46,408,460      46,725,288      46,849,588      46,929,144
Diluted                                           46,685,144      47,494,188      46,535,980      46,805,192      46,896,768      46,964,368

____________________________________________________________________________________________________________________________________________


UNIVERSAL DISPLAY CORP  (OLED)              BALANCE SHEET

Fiscal year ends in December.                        2014-12         2015-12         2016-12         2017-12         2018-12

Assets

Current assets

Cash

Short-term investments                           243,088,000     297,980,992     188,644,000     287,446,016     304,323,008
Total cash                                       288,505,984     395,494,016     328,008,992     420,286,016     515,344,992

Receivables                                       22,075,000      24,729,000      24,994,000      52,355,000      43,129,000
Inventories                                       37,109,000      12,748,000      17,314,000      36,265,000      70,000,000
Deferred income taxes                             18,459,000      12,326,000       8,661,000               0               0
Other current assets                               4,356,000       2,387,000       6,392,000      10,276,000       6,366,000
Total current assets                             370,504,992     447,684,000     385,369,984     519,182,016     634,840,000

Non-current assets

Property, plant and equipment
Gross property, plant and equipment               44,735,000      50,304,000      59,370,000      92,818,000     114,682,000
Accumulated Depreciation                         -24,813,000     -27,897,000     -32,167,000     -36,368,000     -44,943,000
Net property, plant and equipment                 19,922,000      22,407,000      27,203,000      56,450,000      69,739,000

Equity and other investments                       3,047,000       2,187,000      14,960,000      14,794,000               0
Goodwill                                                   0               0      15,535,000      15,535,000      15,535,000
Intangible assets                                 83,014,000      72,015,000     168,352,000     146,368,992     124,407,000
Deferred income taxes                             12,934,000      14,945,000      15,832,000      27,022,000      24,377,000
Other long-term assets                               425,000         174,000         307,000         604,000      64,526,000
Total non-current assets                         119,342,000     111,728,000     242,188,992     260,774,000     298,584,000

Total assets                                     489,847,008     559,411,968     627,558,976     779,955,968     933,424,000

Liabilities and stockholders' equity

Liabilities

Current liabilities
Accounts payable                                   9,260,000       6,849,000       8,112,000      13,774,000      10,532,000
Accrued liabilities                                6,248,000       7,502,000       9,012,000      14,022,000      22,254,000
Deferred revenues                                  2,466,000      10,107,000      10,282,000      14,981,000      80,782,000
Other current liabilities                          8,849,000      10,052,000      12,800,000      21,047,000      19,614,000
Total current liabilities                         26,823,000      34,510,000      40,206,000      63,824,000     133,182,000

Non-current liabilities
Deferred revenues                                  3,366,000      35,543,000      31,322,000      23,902,000      41,785,000
Pensions and other benefits                       10,916,000      22,594,000      27,563,000      33,176,000      44,055,000
Other long-term liabilities                                0               0               0               0      23,896,000
Total non-current liabilities                     14,282,000      58,137,000      58,885,000      57,078,000     109,736,000

Total liabilities                                 41,105,000      92,647,000      99,091,000     120,902,000     242,918,000

Stockholders' equity

Preferred stock                                        2,000           2,000           2,000           2,000           2,000
Common stock                                         471,000         482,000         483,000         485,000         487,000
Additional paid-in capital                       581,113,984     589,884,992     604,364,032     611,062,976     617,334,016
Retained earnings                                -88,305,000     -73,627,000     -25,557,000      99,126,000     129,552,000
Treasury stock                                   -40,158,000     -40,158,000     -40,158,000     -40,158,000     -40,635,000
Accumulated other comprehensive income            -4,382,000      -9,819,000     -10,666,000     -11,464,000     -16,234,000
Total stockholders' equity                       448,742,016     466,764,992     528,468,000     659,054,016     690,505,984
Total liabilities and stockholders' equity       489,847,008     559,411,968     627,558,976     779,955,968     933,424,000

____________________________________________________________________________________________________________________________________________


UNIVERSAL DISPLAY CORP  (OLED)              Statement of CASH FLOW

Fiscal year ends in December. USD.                   2014-12         2015-12         2016-12         2017-12         2018-12             TTM

Cash Flows From Operating Activities
Net income                                        41,854,000      14,678,000      48,070,000     103,885,000      58,840,000     131,125,000
Depreciation & amortization                       13,074,000      14,085,000      20,762,000      26,902,000      30,574,000      33,428,000
Amortization of debt discount/premium and is        -531,000        -697,000      -1,830,000      -2,871,000      -6,131,000      -6,468,000
Investment/asset impairment charges                        0      33,000,000               0               0       3,630,000               0
Deferred income taxes                              9,108,000       7,137,000       3,094,000      24,396,000     -12,814,000     -31,267,000
Stock based compensation                           8,273,000      10,464,000      13,089,000      14,893,000      16,796,000      15,688,000
Change in working capital                        -21,913,000      40,585,000       4,826,000     -27,588,000      95,340,000     127,532,000
Accounts receivable                               -6,418,000      -2,654,000       1,205,000     -27,361,000       9,226,000     -22,567,000
Inventory                                        -26,514,000      -8,639,000      -4,460,000     -18,951,000     -37,365,000       4,520,000
Other working capital                             11,019,000      51,878,000       8,081,000      18,724,000     123,479,000     145,579,008
Other non-cash items                              -2,595,000      -5,640,000      -7,673,000      -6,252,000     -64,439,000    -105,452,000
Net cash provided by operating activities         47,270,000     113,612,000      80,338,000     133,365,000     121,796,000     164,586,000

Cash Flows From Investing Activities
Investments in property, plant, and equipmen      -6,153,000      -5,103,000      -7,300,000     -29,803,000     -25,391,000     -29,783,000
Acquisitions, net                                          0               0     -33,380,000               0               0               0
Purchases of investments                        -408,974,016    -691,875,968    -450,276,992    -594,283,008    -628,788,992    -775,809,984
Sales/Maturities of investments                  372,817,984     638,411,008     548,473,984     498,508,000     633,179,008     808,032,000
Purchases of intangibles                                   0               0     -95,989,000               0               0        -401,000
Net cash used for investing activities           -42,309,000     -58,568,000     -38,472,000    -125,578,000     -21,001,000       2,038,000

Cash Flows From Financing Activities
Common stock issued                                  328,000         354,000         439,000         734,000         798,000         840,000
Common stock repurchased                         -29,500,000               0               0               0        -477,000        -649,000
Excess tax benefit from stock based compe                  0               0       4,232,000               0               0               0
Dividend paid                                              0               0               0      -5,652,000     -11,314,000     -16,970,000
Other financing activities                          -957,000      -3,303,000      -4,685,000      -9,394,000     -11,620,000     -15,942,000
Net cash provided by (used for) financing        -30,129,000      -2,949,000         -14,000     -14,312,000     -22,613,000     -32,721,000

Net change in cash                               -25,168,000      52,095,000      41,852,000      -6,525,000      78,182,000     133,903,000
Cash at beginning of period                       70,586,000      45,418,000      97,513,000     139,364,992     132,840,000     101,638,000
Cash at end of period                             45,418,000      97,513,000     139,364,992     132,840,000     211,022,000     235,540,992

Free Cash Flow
Operating cash flow                               47,270,000     113,612,000      80,338,000     133,365,000     121,796,000     164,586,000
Capital expenditure                               -6,153,000      -5,103,000    -103,289,000     -29,803,000     -25,391,000     -30,184,000
Free cash flow                                    41,117,000     108,509,000     -22,951,000     103,562,000      96,405,000     134,402,000
____________________________________________________________________________________________________________________________________________
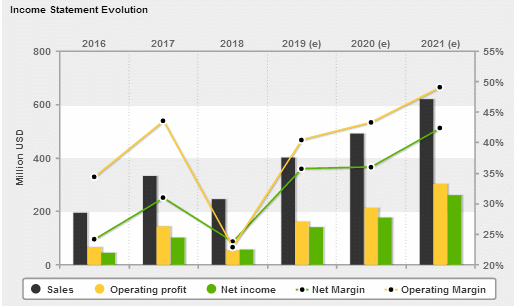
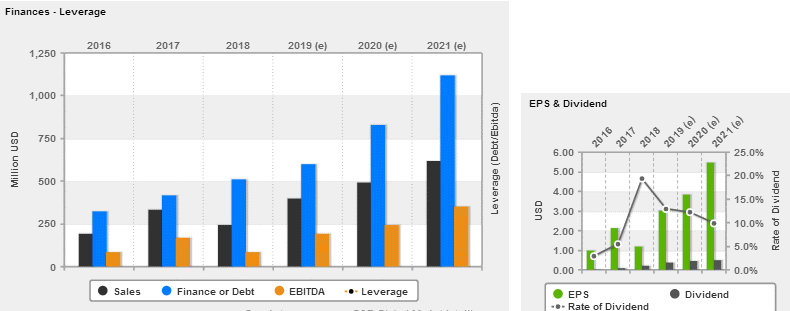
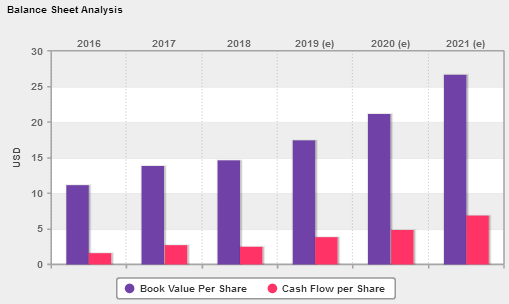
              (OLED)     Universal Display Corp.

                               2014    2015    2016    2017    2018

          Annual Earnings:     0.90    0.31    1.02    2.18    1.24
Average Price During Year:    30.90   41.10   58.55  109.08  115.36

                P/E Ratio:    34.33  132.57   57.41   50.04   93.03

 Average 5-Year P/E Ratio  =  73.47
             Current Price =  194.96

Previous 5 Quarter Earnings:   1.56    0.81    1.21    1.21   11.83

          Current Annualized (Last Four Quarters) Earnings =  14.25
                                                           ________
                                 Average PE / Current PE =     5.37
                                                           --------

                                      ...a number above 1.00 is good
                                                1.00 or below is bad
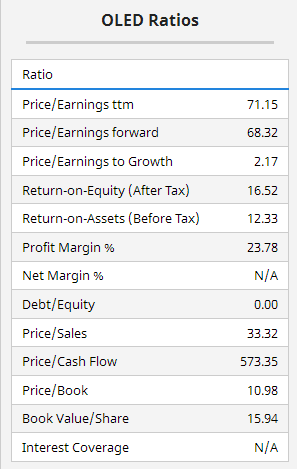
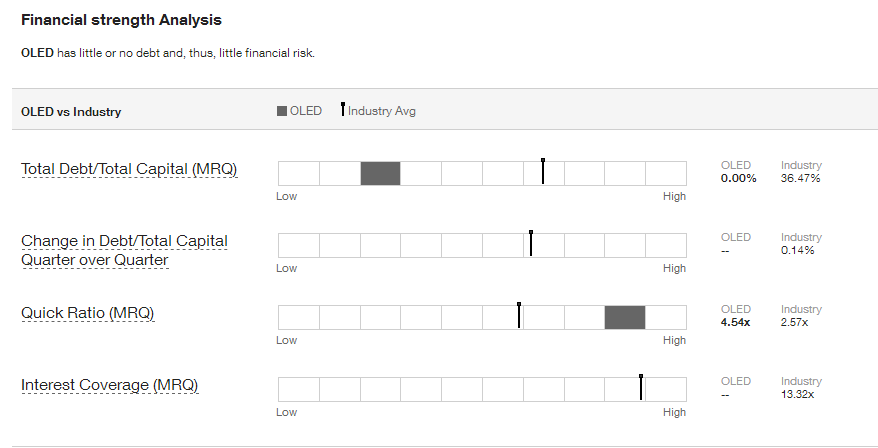
Financial Ratios |
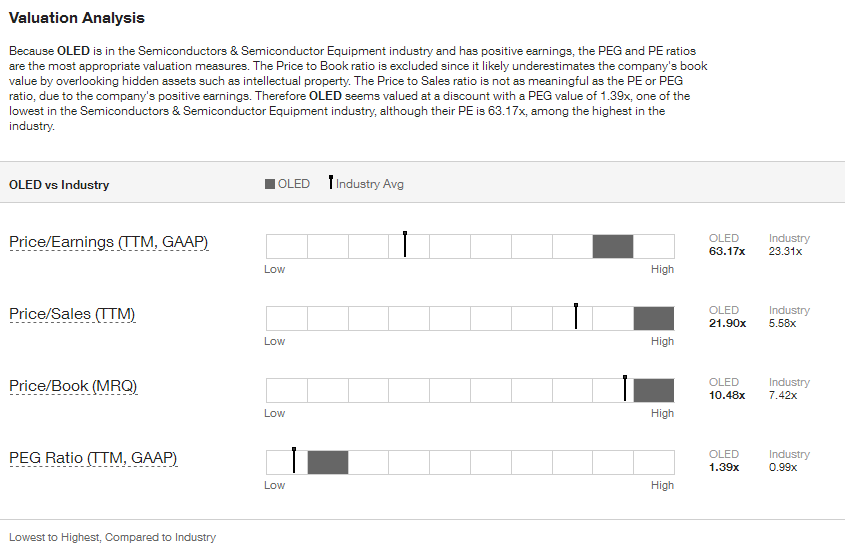
. . . . . . . . . . . . Lowest to Highest, Compared to Industry
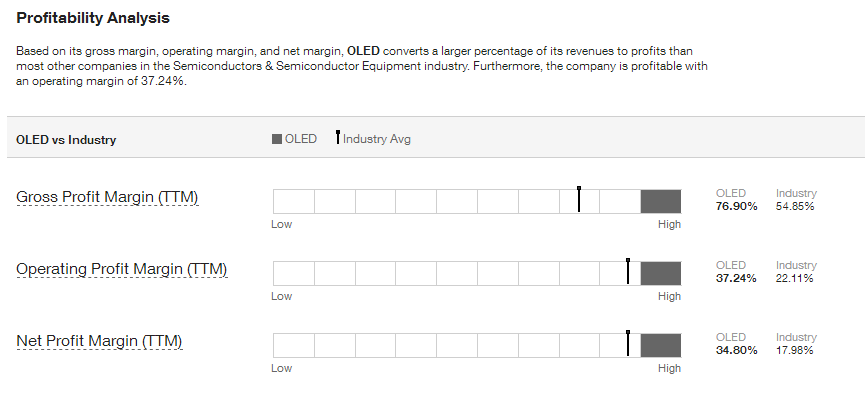
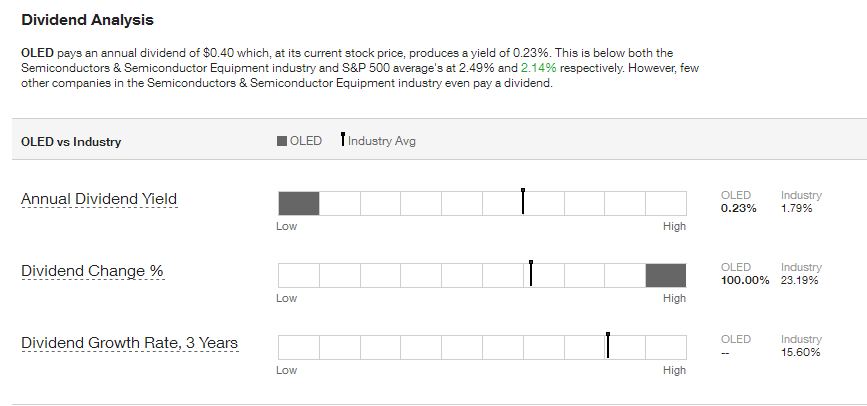
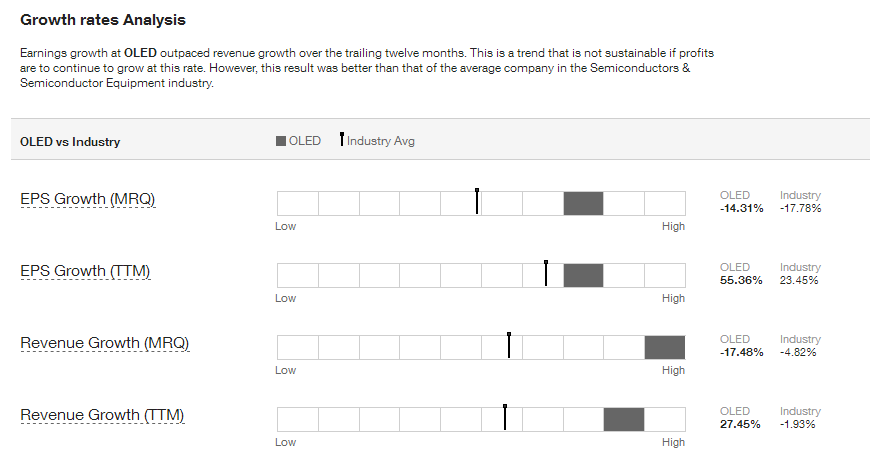
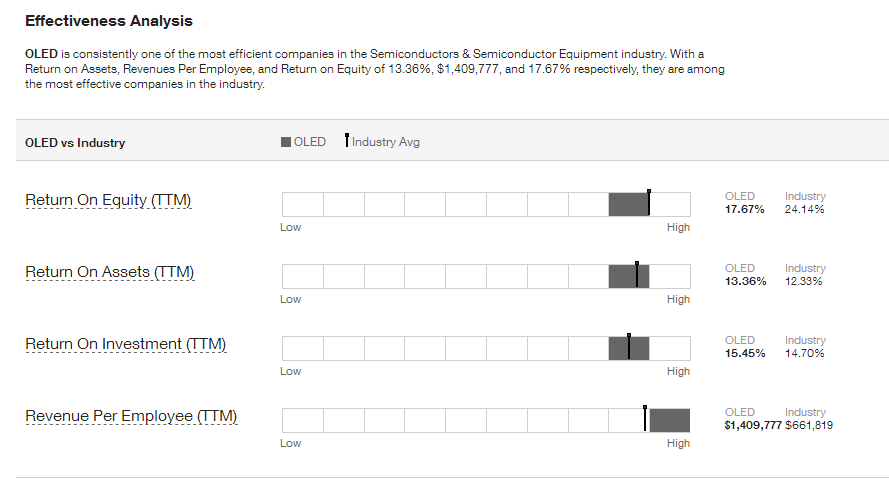
Intrinsic Value (DCF) |
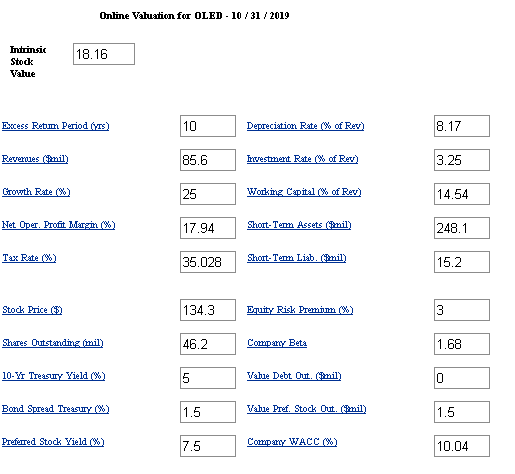
Intrinsic Value by Discounted Cash Flow Method:
Fair Value Estimator |
Fair Value Estimate:

Projected Earnings |

Research Reports |
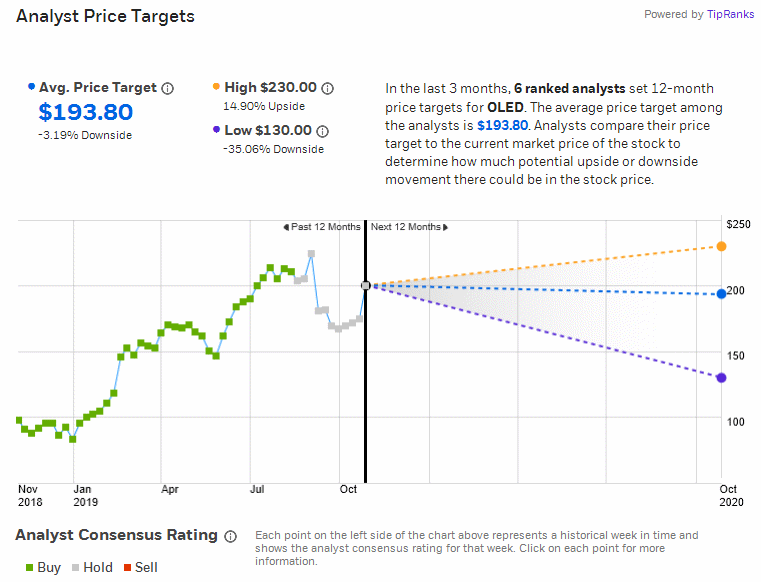
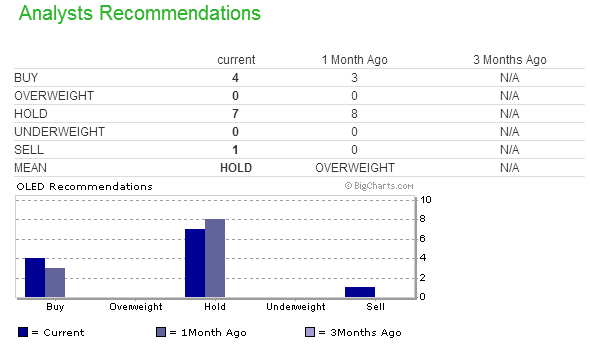
Analysts' Opinions |

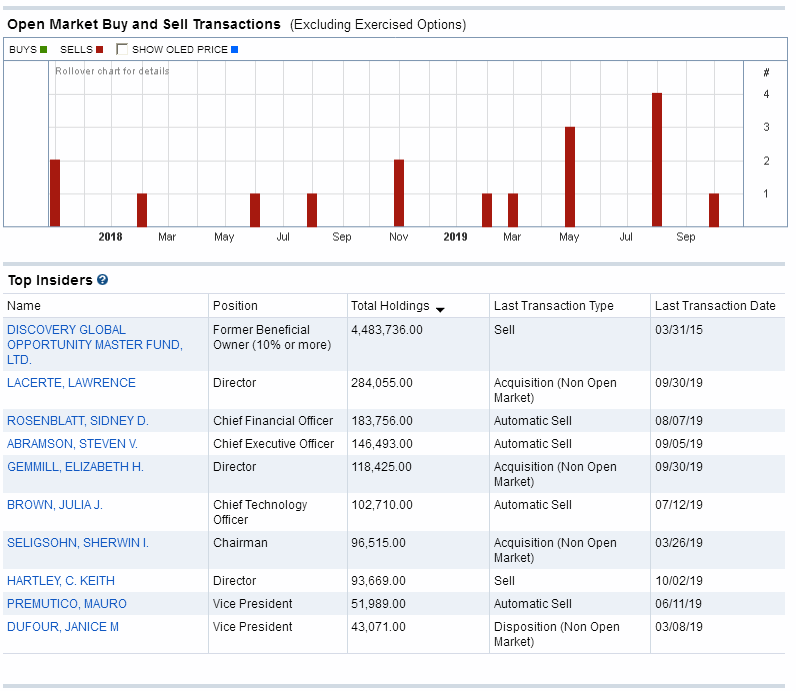
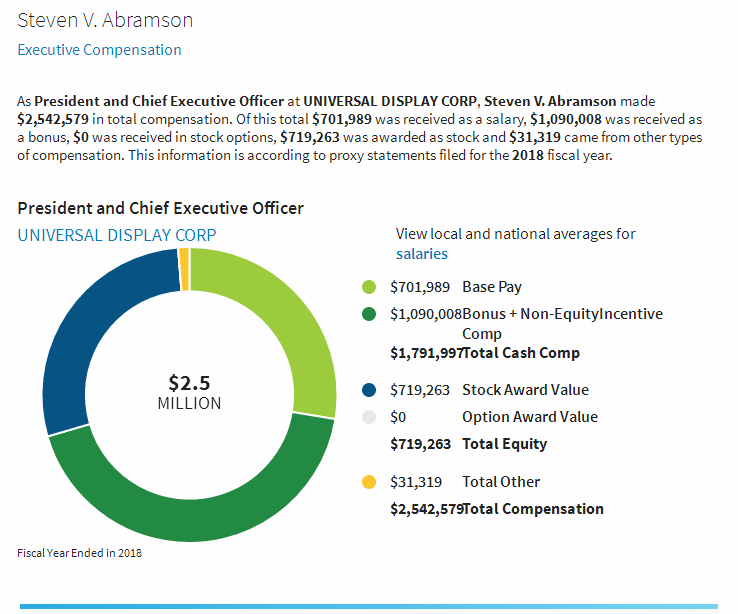
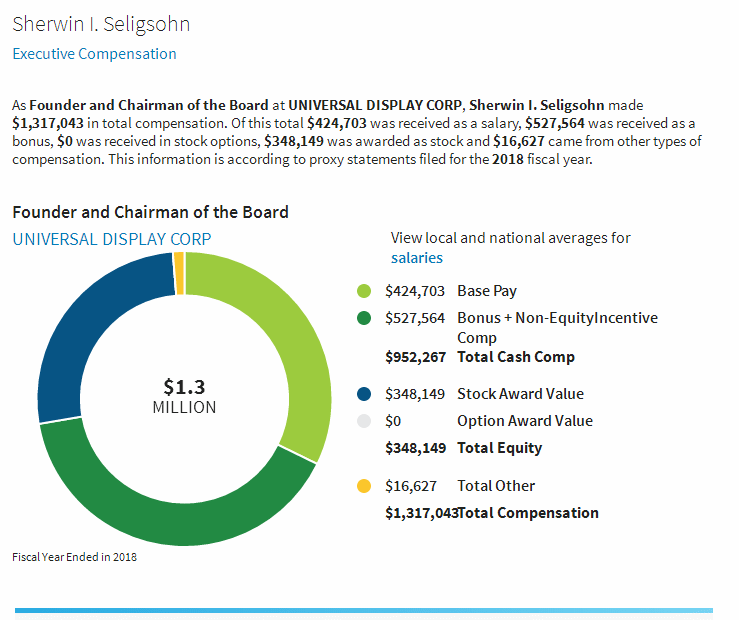
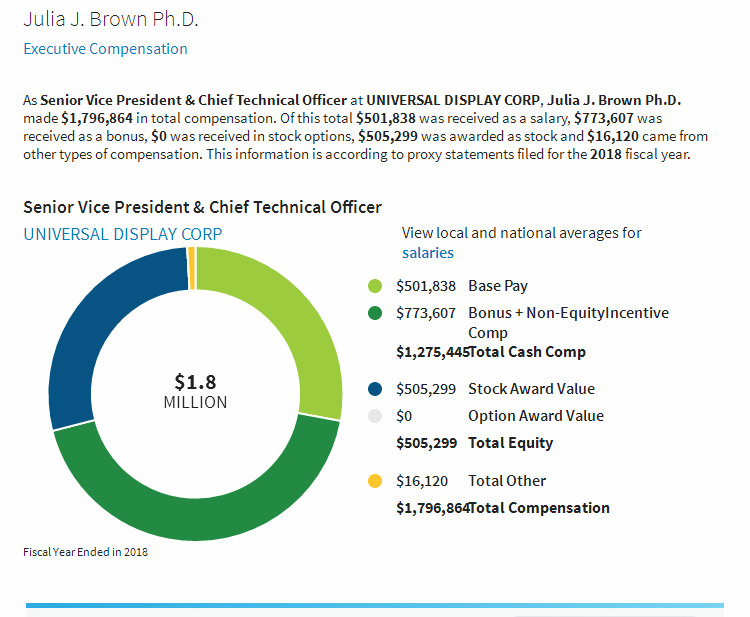
Insider Activity |
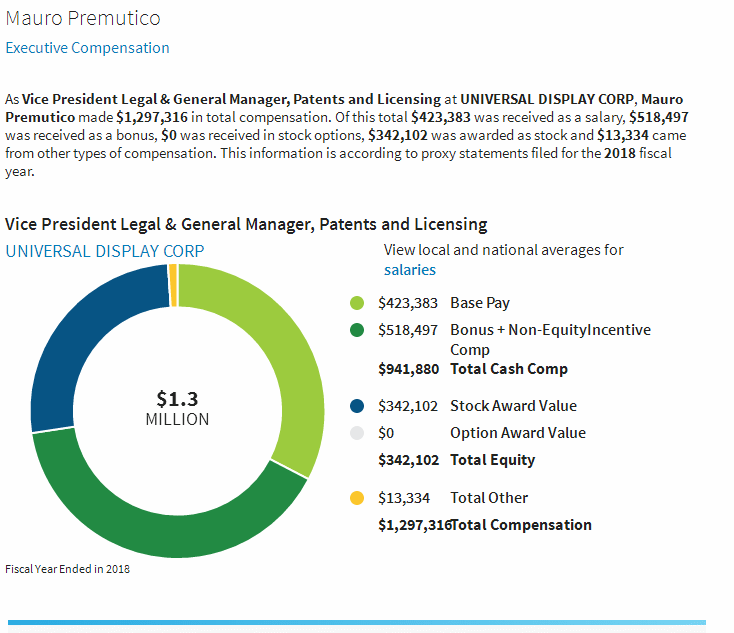
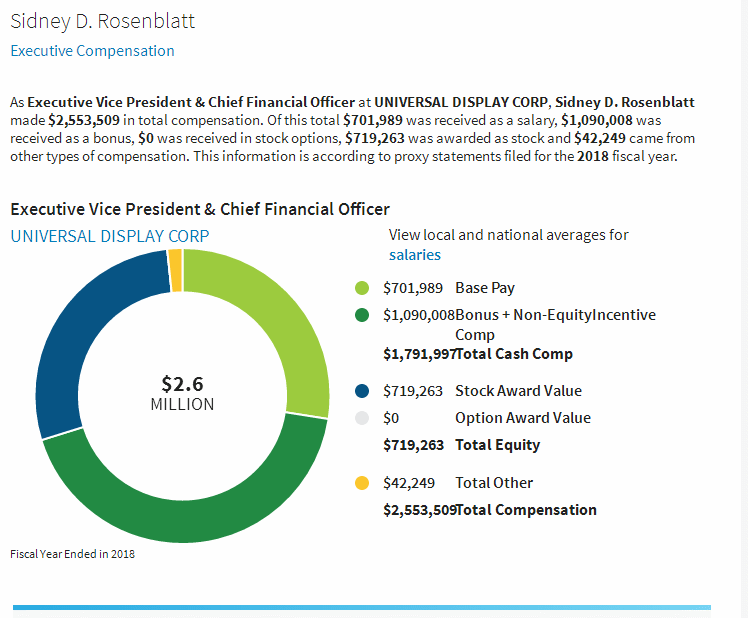
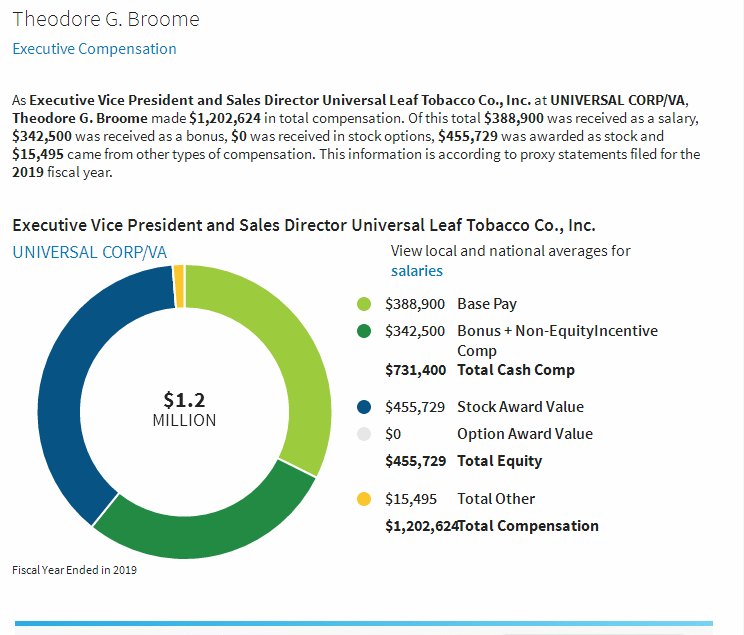
Institutional Activity |
Institutional Ownership:
Sentiment |
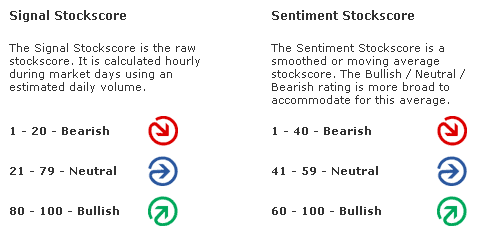
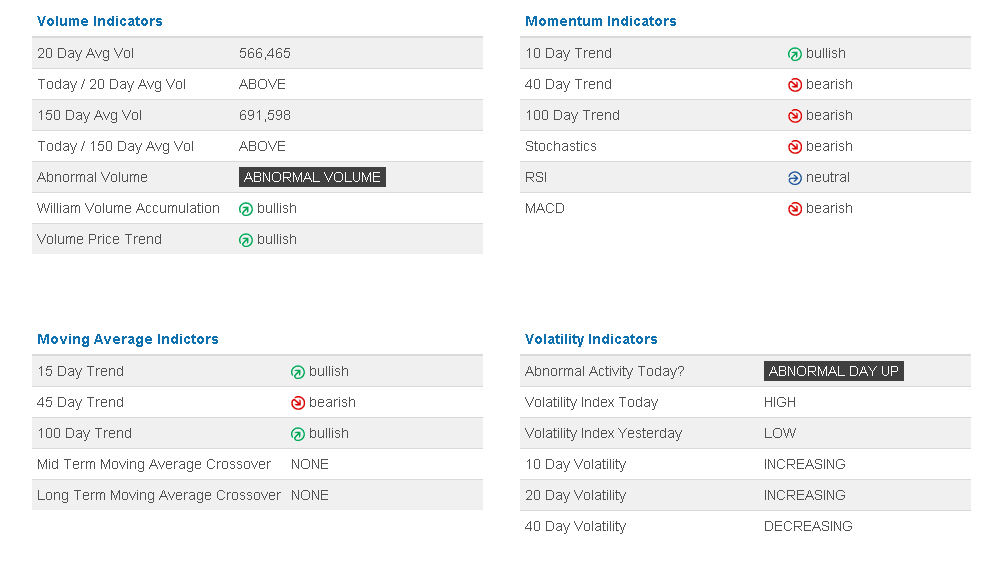
Zenith uses the "sentiment" score above or below 50 to award a positive or negative point in the Decision Matrix.


Short Interest Ratio |
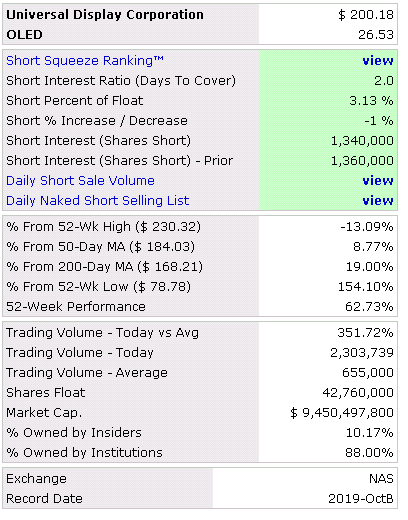
As the short interest rises as a percentage of average daily share volume (Days to Cover), this is considered a measure of negative sentiment. Similarly, a decrease in that percentage is considered positive sentiment.

Standard & Poor's |
Management's Discussion of Results of Operations Excerpts |
Channeling Potential |
The summary below includes a value for `Degree,' which refers on a
scale of 1 to 10 the range of a channel in the period under consi-
deration compared to the total range of price movement. It also looks
for the last closing price to be within the channel, otherwise zeroed.
The `Index' is the `Degree' weighted for volatility.  Generally, the
the higher the index, the more suitable is the stock for trading as
a `rolling stock' between channel high and low points.

Results for UNIVERSAL DISPLAY CORP.:
Symbol? OLED
Total Months Available:  25
       Months in Cycle?   4

Months Covered by Periods:  12

Period 1           Period 2          Period 3
   H1      L1        H2      L2        H3      L3
 152.97   78.78    198.86  143.55    230.32  158.00

RANGE   = 230.32  TO   78.78            Close = 173.65
CHANNEL = 158.00  TO  152.97           Degree =   0
Volatility =   2.90%                    Index =   0
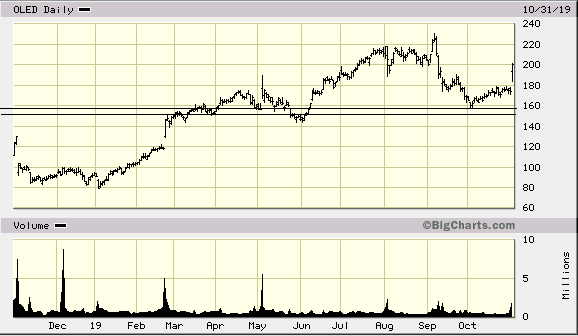
MACD Histogram Divergence |
The theory is that connecting the two most recent peaks or valleys of the MACD histogram will signal the direction of the next major move.
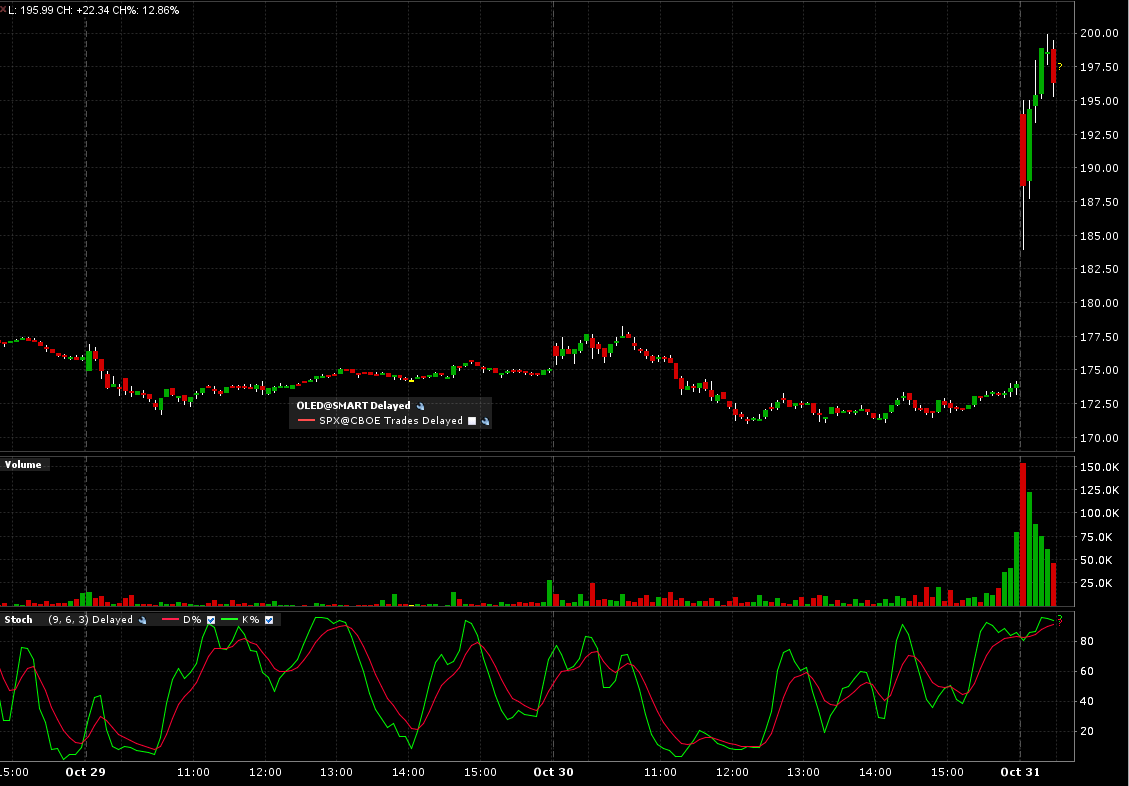
Intraday Chart |
2 Days:
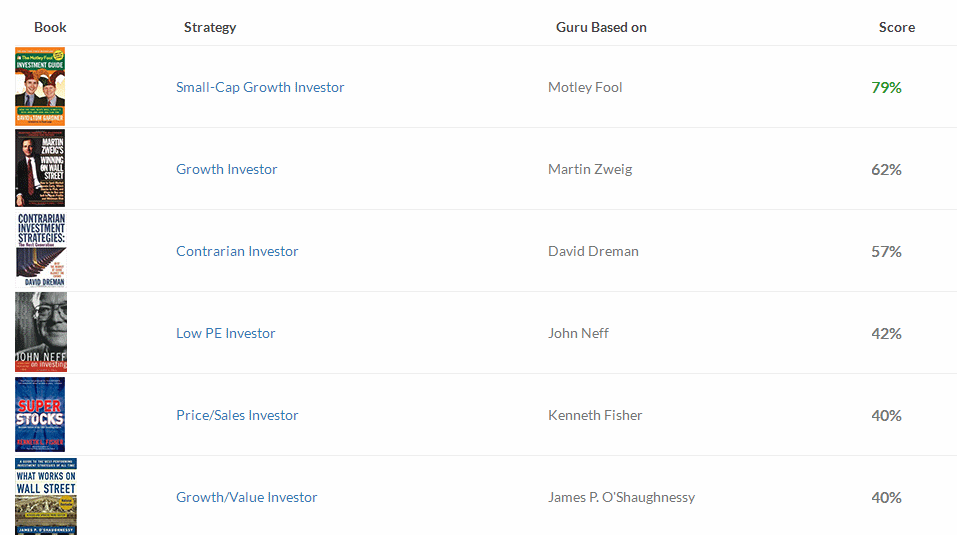
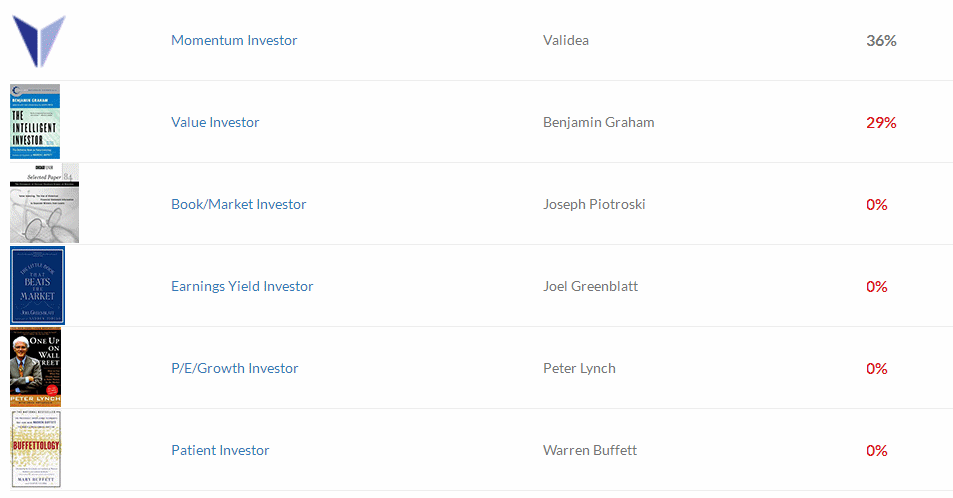
Val Idea |
3 out of 12 favorable, (negative opinion.)
Stock Consultant |
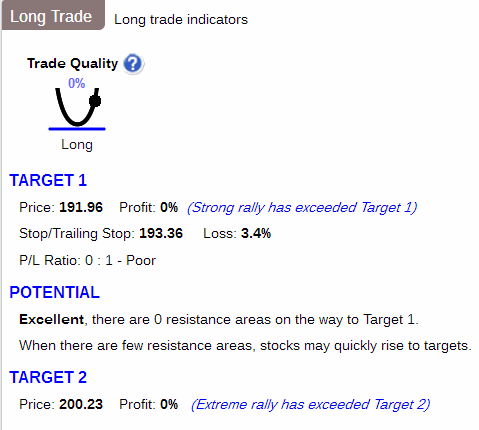
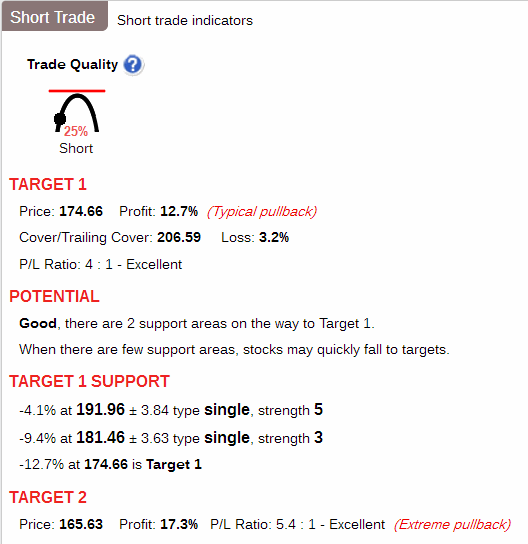
Point & Figure Chart |
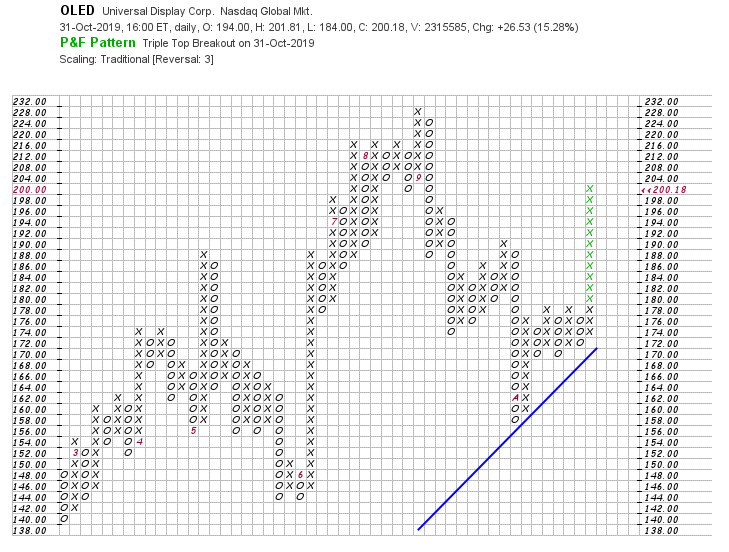
Wall Street Analyzer |
Marketspace Chart |
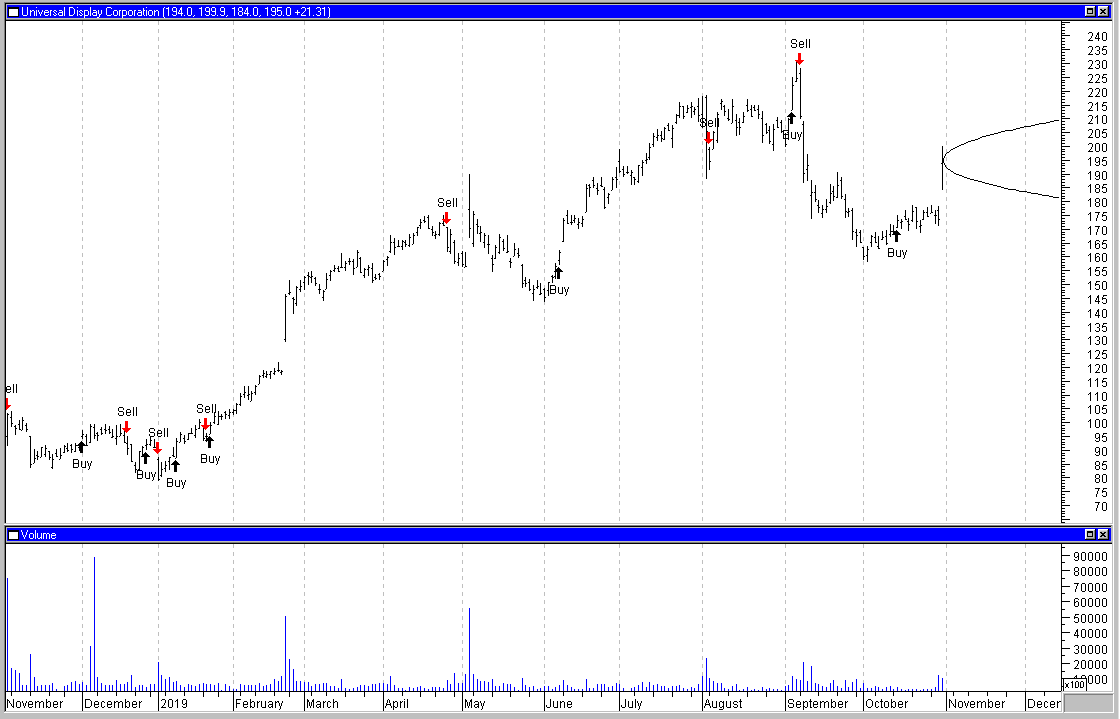
Time Series Forecast |
Neural Network Prediction |
"Neurostock" can only track long trades. Therefore its performance, as tracked by itself on stocks which are consistently falling, may not appear as good as it could if each "sell" signal were a "short sale."

![]()
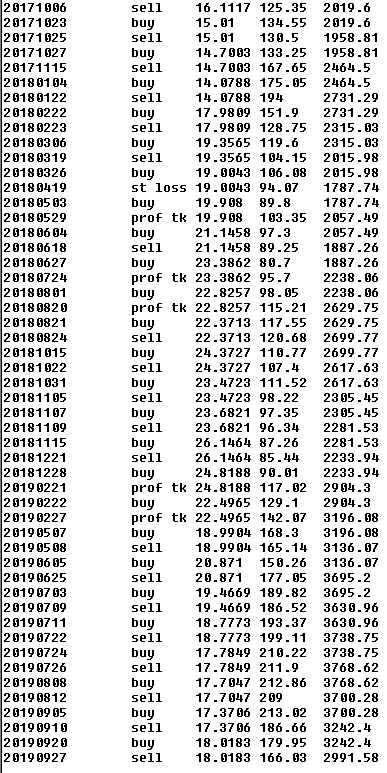

Ultimate Trading Systems |
2 out of 3 of the ultimate systems favor an upmove.
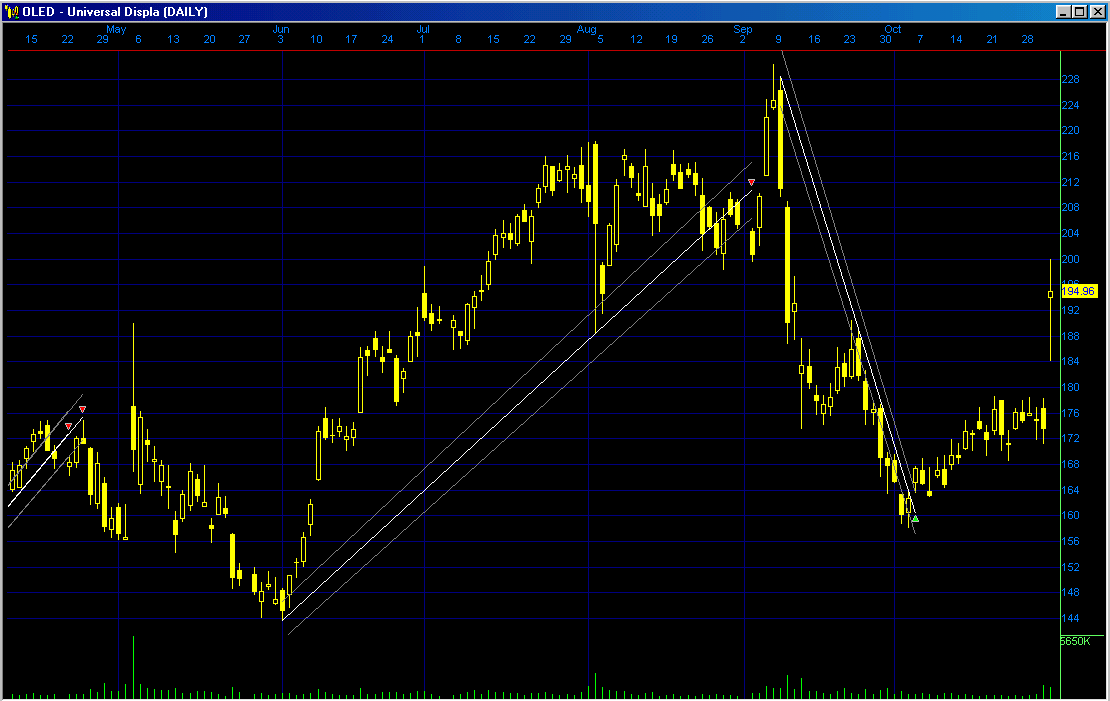
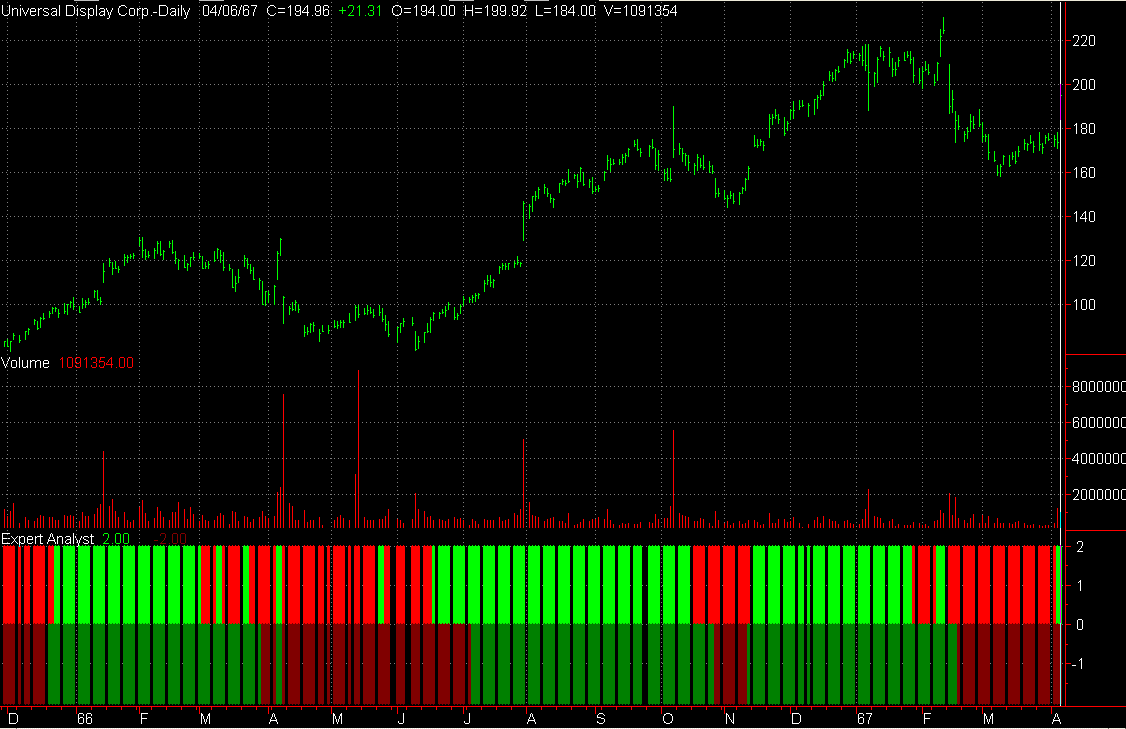
System Below:
Short term outlook: Positive: Bright Green, Negative: Bright Red
Long term outlook: Postive: Dark Green, Negative: Dark Red.

Recommendation |
| Factors | Weighted Points |
|---|---|
| News | + 1 |
| Comparison | + 1 |
| Industry | + 1 |
| Bond Issue | 0 |
| Zenith Index | + 1 |
| Non-GAAP vs. GAAP Earnings | + 1 |
| Cash Flow | + 1 |
| Average to Current P/E | + 1 |
| Ratios | + 1 |
| Intrinsic Value DCF | - 1 |
| Fair Value Estimator | - 1 |
| Projected Earnings | + 1 |
| Research Reports | + 1 |
| Analysts | - 1 |
| Executive Perquisites | - 1 |
| Insider Activity | - 1 |
| Institutional Activity | - 1 |
| Management Reporting | + 1 |
| Short Interest | + 1 |
| Sentiment | - 1 |
| Standard & Poor's | - 1 |
| MACD Histogram Divergence | + 1 |
| Val Idea | - 1 |
| Stock Consultant | - 1 |
| Point & Figure | + 1 |
| Wall Street Analyzer | - 1 |
| Marketspace Chart | + 1 |
| Time Series Chart | + 1 |
| Neural Network | + 1 |
| Stock Options | + 1 |
| Ultimate Trading Systems | + 1 |
| Total | + 8 |
Place 150 shares of Universal Display Corporation (OLED) on the Active List.