![]()
Corporate Webpages M / I Homes Inc.
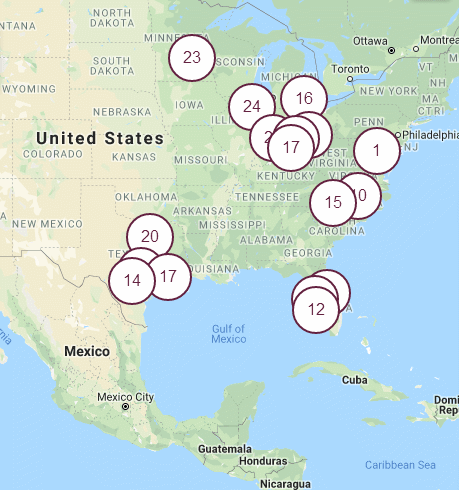
M/I Homes, Inc. (MOH) is a moderate-sized residential home
builder operating primarily in the eastern part of the U.S. and
Texas, based in Columbus, and formerly known as M/I
Schottenstein Homes, Inc. It was formed in 1976.
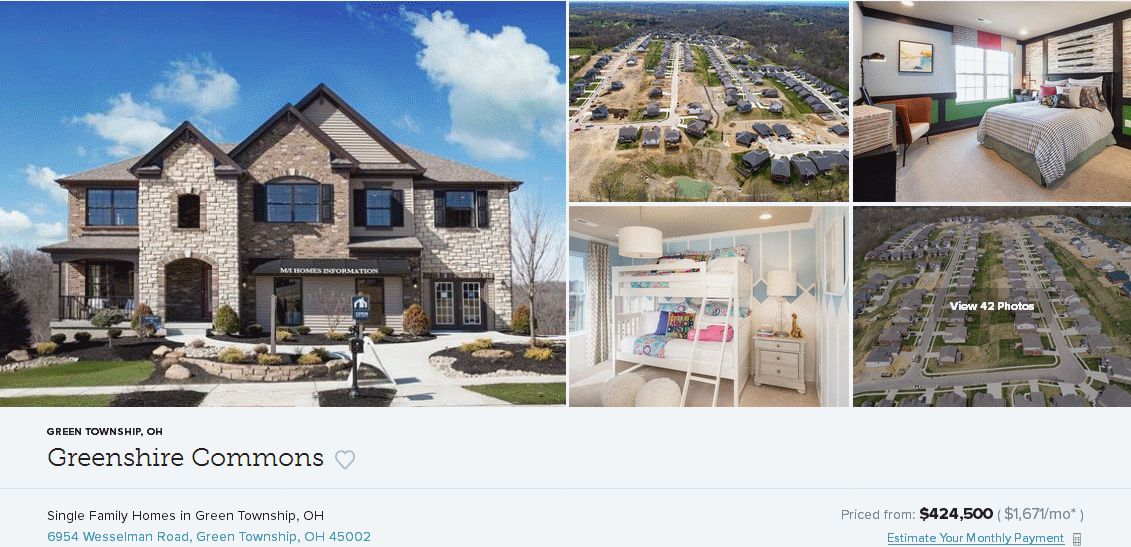
Our impression of the corporation website is that it is well
designed to sell quality upper range homes, well-built, but
lacking in investor concern. There is a reliance on conference
calls for CEO communications, and transcripts for these are
obtainable only through other websites, not the company one.
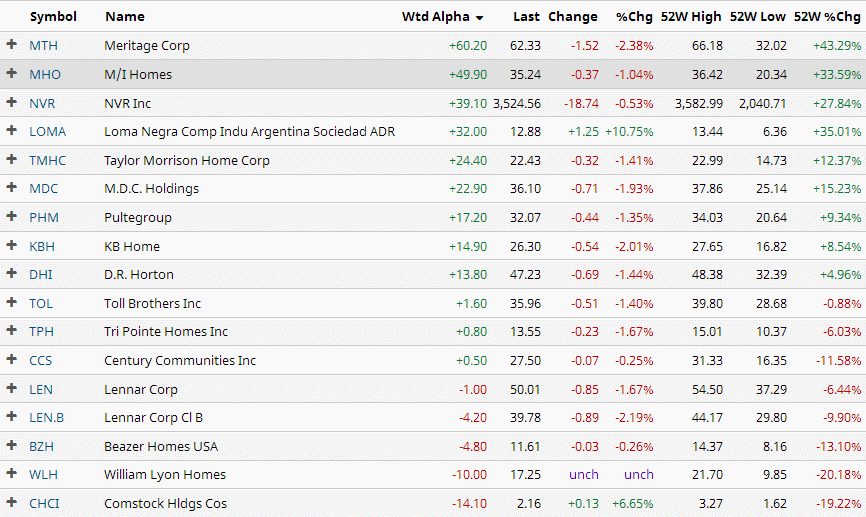
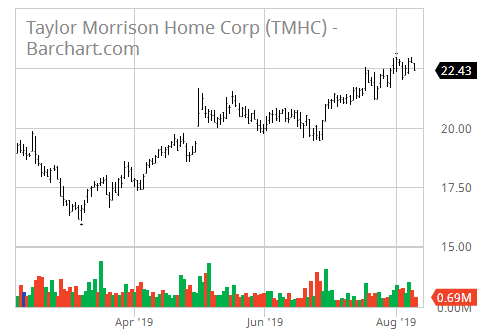
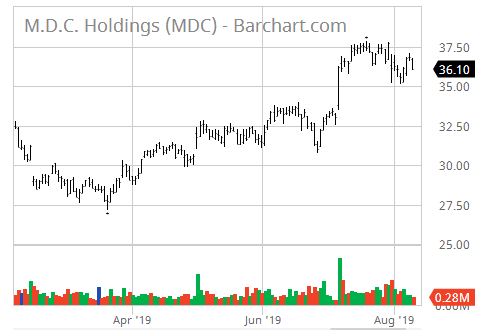
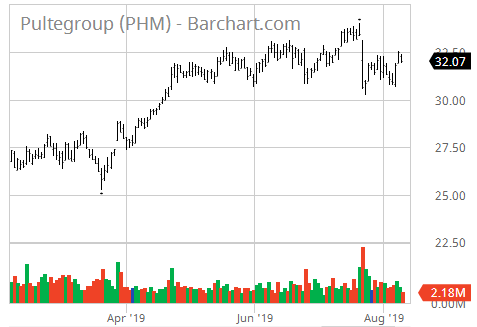
After lagging, the stock is playing catch-up to other home
builders enjoying a very strong industry group performance,
albeit with many competitors, after the 2008 recession and crash.
Currently residential real estate is booming in a sellers'
market pretty much nationwide, and recently given an interest
rate cut boost by the Fed.
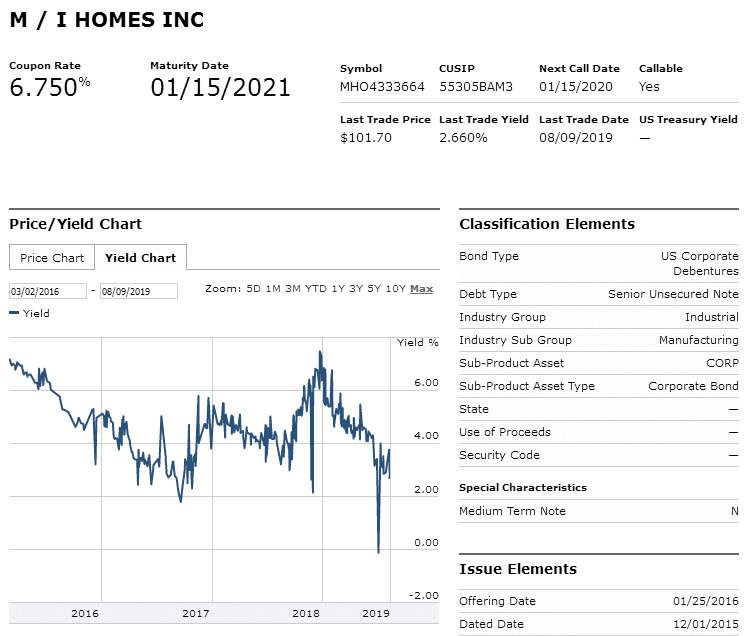
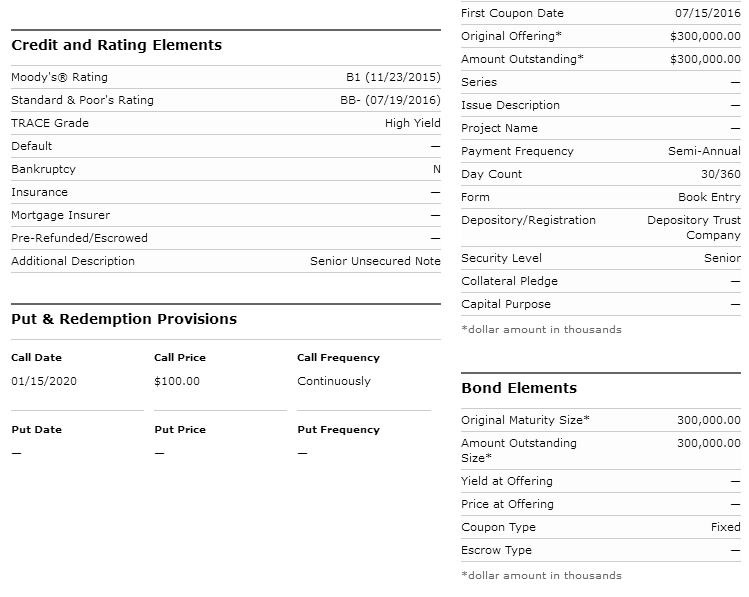
The company has issued high-rated attractive interest rate
bonds. Borrowings resulted in many acquisitions across the
country. The corporation is currently wrapping up developments
in the Washington, D.C. area.
The corporation has an unacceptably-low Zenith Index, but has a
current p/e below its five-year average suggesting it has been
overlooked until now, and recently touted by Zack's.
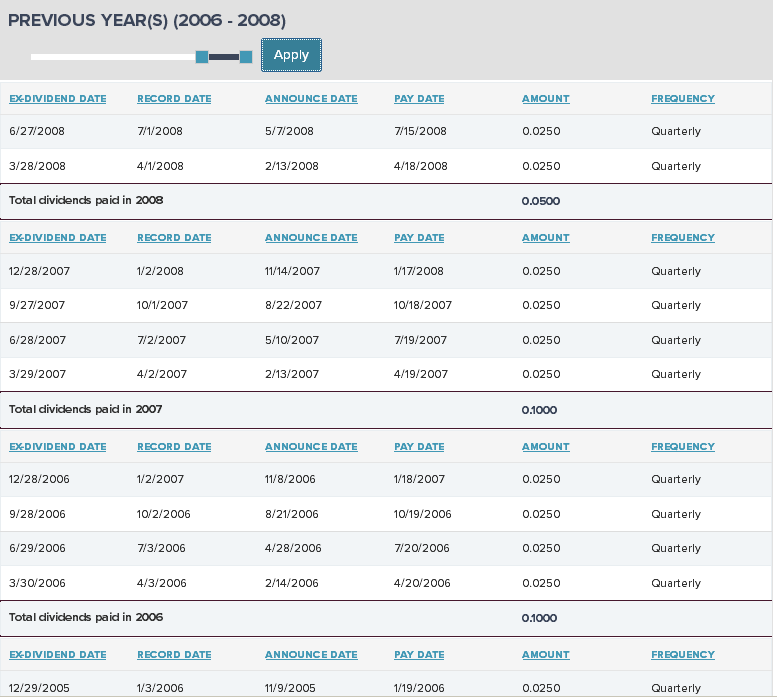
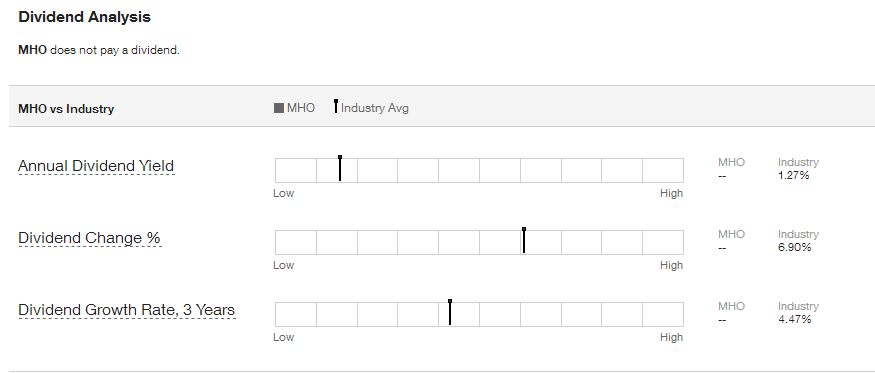
The company is paying a nearly 3% dividend which is not being
reported for unknown reasons on a number of sites upon which we depend.
This is adding to its overlooked status, along with a rather low
p/e ratio.
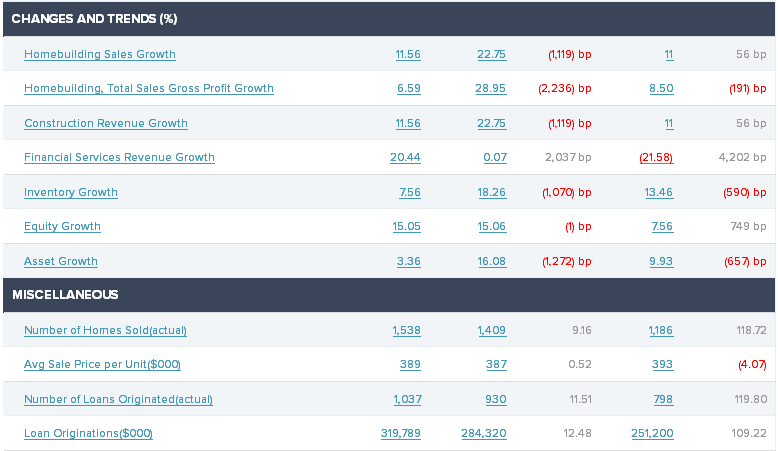
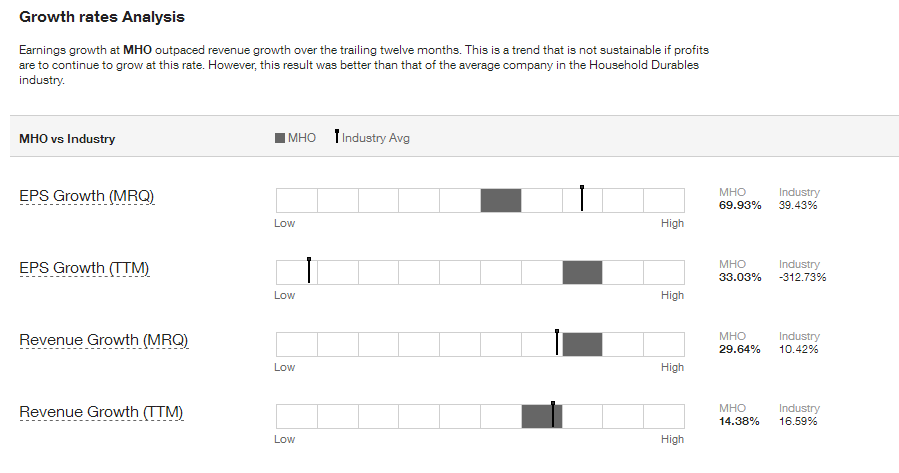
One warning is that earnings are increasing faster than
revenues, a trend which is not sustainable.
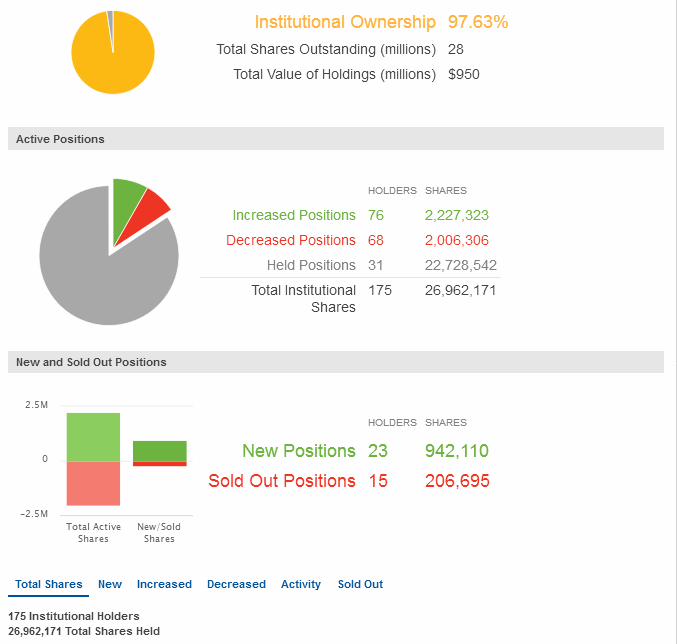
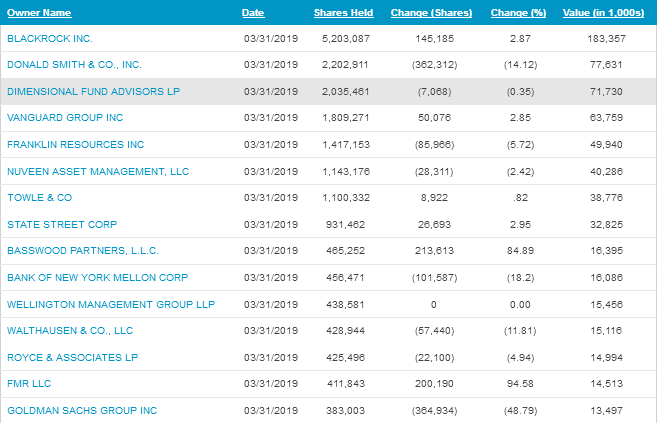
Researchers and analysts are neutral to negative on the stock,
but institutions are net acquirers, and Dimensional Fund Advisors
is among the largest institutional shareholders, a good sign.
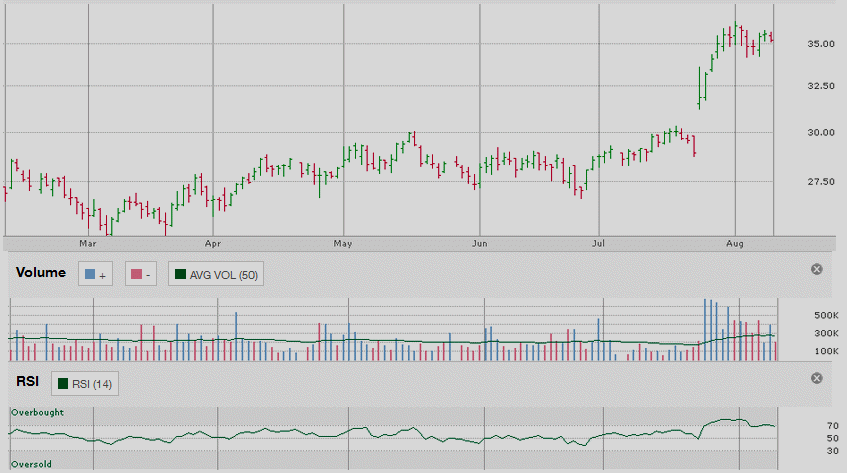
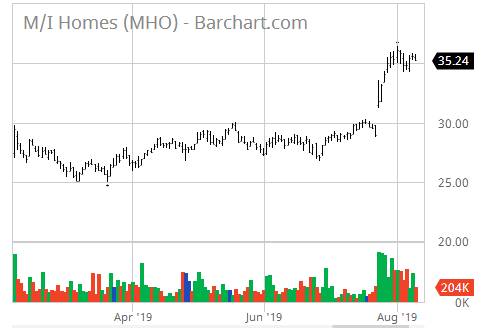
The chart pattern is looking "toppy" after a recent big run-up,
but the overall pattern seems to be more of a buy-and-hold one
rather than relying upon a trading range.
News on this comparitively low-risk stock consists mainly of few
surprises, earnings reports, various borrowings, opening up or acquisitions
in new areas of the country, and personnel changes.
(WAIT FOR PAGE TO LOAD COMPLETELY BEFORE LINKS WORK.)
Company Profile
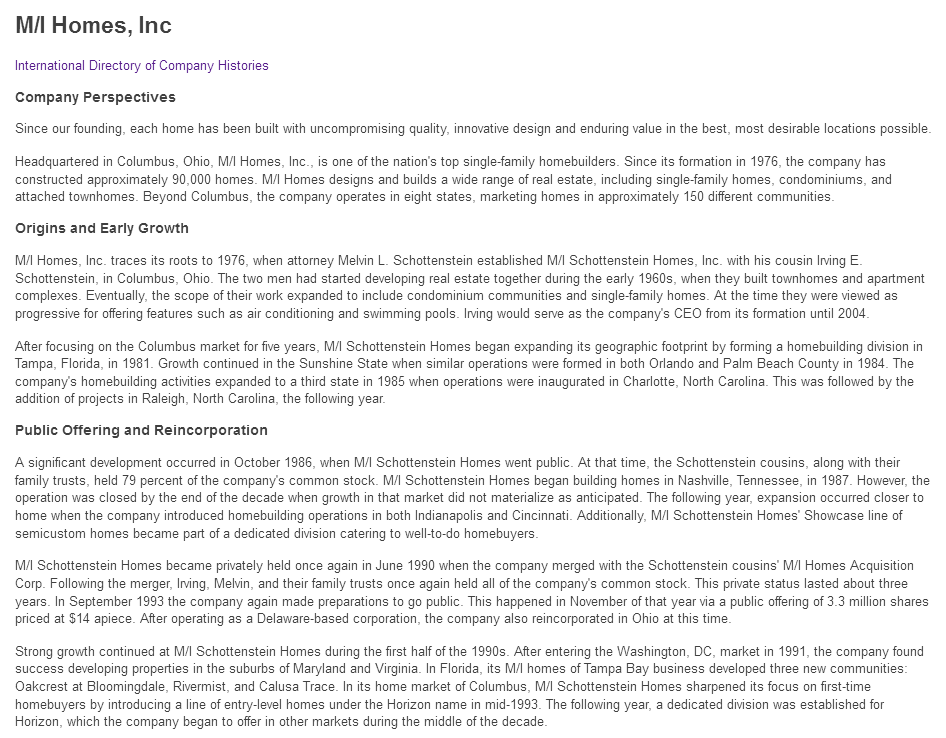
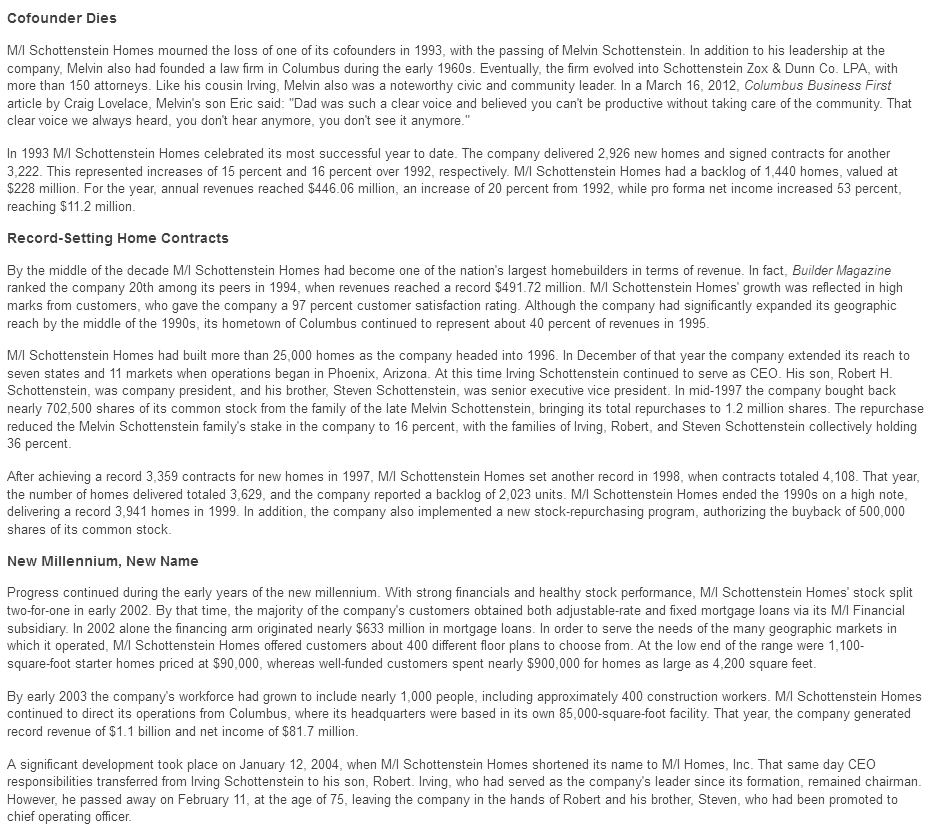
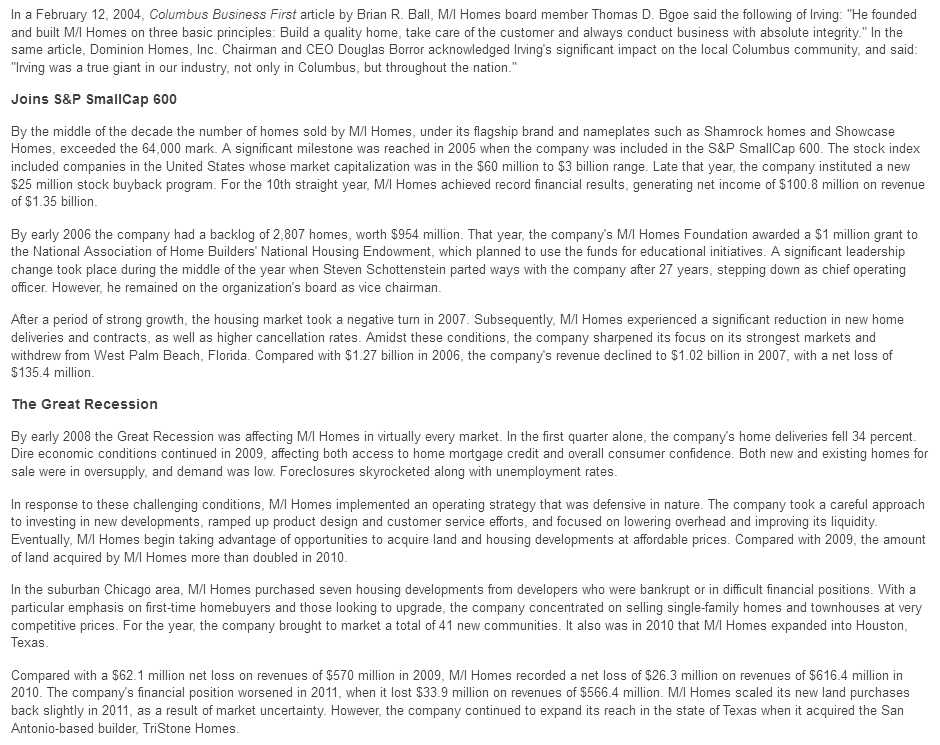
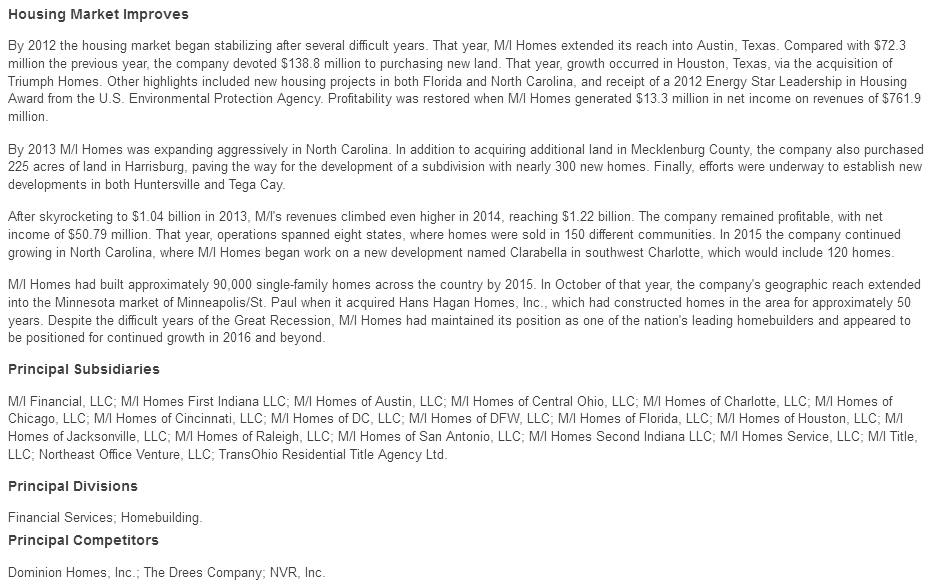
Company History
News
Comparison with Peers
Bond Issue
Zenith Index
Financial Statements
Avg. P/E to Current P/E
Financial Ratios
Intrinsic Value (Disc. CashFlow)
Fair Value Estimator
Projected Earnings
Research Reports
Analysts' Opinions
Insider Activity
Institutional Activity
Sentiment
Short Interest
Standard & Poor's
Management's Discussion
Channel Potential
MACD Histogram
Intraday Chart
Val Idea
Stock Consultant
Point & Figure Chart
Wall Street Analyzer
Marketspace Chart
Time Series Forecast
Neural Network Prediction
Stock Options
Ultimate Trading Systems
Recommendation











Company Profile |

Company History |
News |
Comparison |
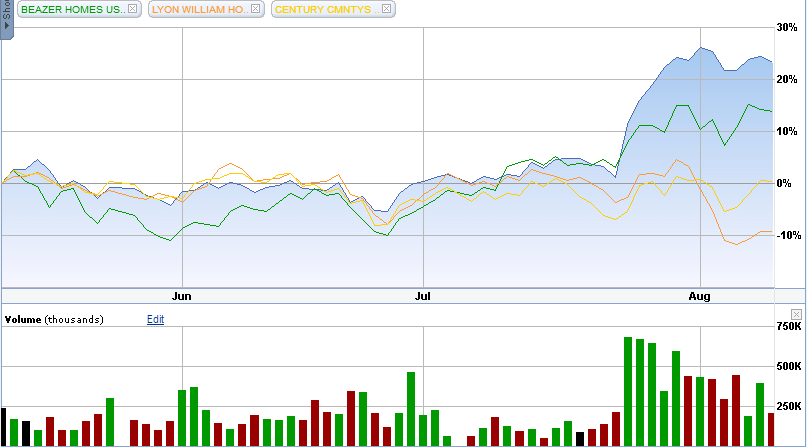
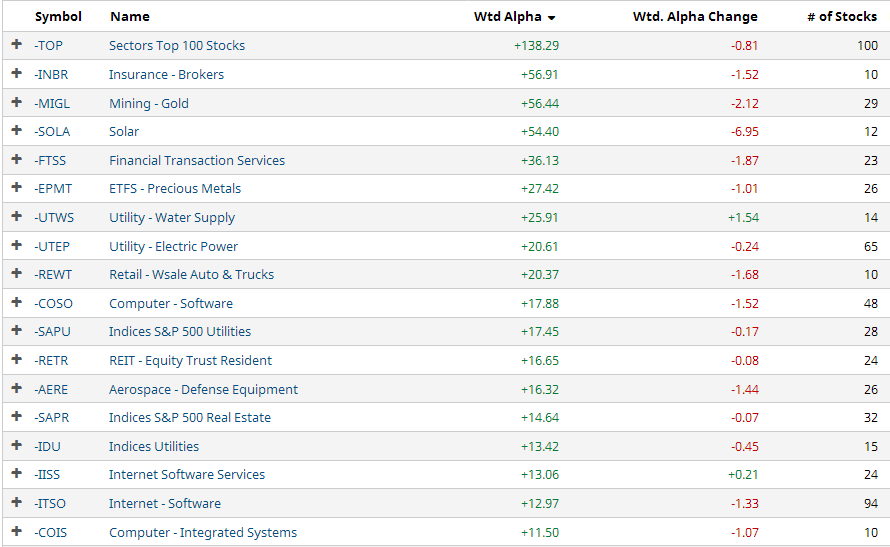
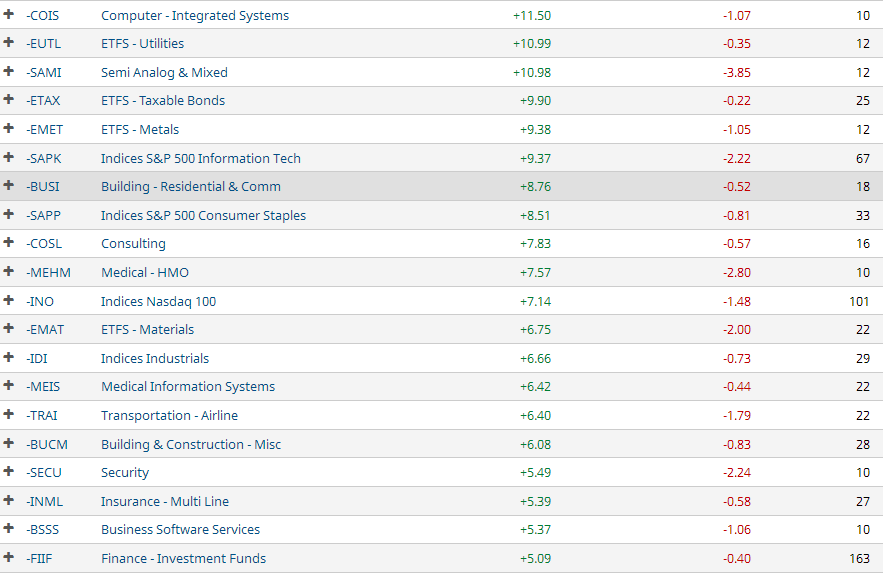
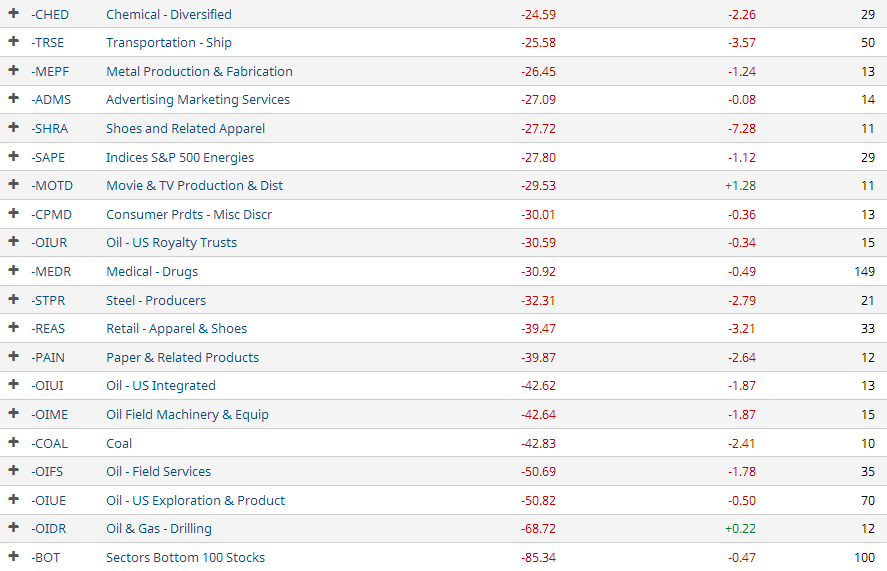

Similar Companies Performance:
Bond Issue |
Zenith Index |
Under current market conditions, a Zenith Index Score of 1.20 or above is required for a positive rating on this factor. 1.21 -1.30 is considered acceptable, 1.30-1.40 is considered strong and
> 1.40 is considered exceptionally strong. Accounting statements in this section often contain mistakes, especially in earlier years' totals, but data is deemed sufficient for us to give a rating. Dividend data immedately below is inaccurate as an example. More accurate financial statements follow in the next section.
M/I Homes, Inc. (MHO)                                     Exchange: NYSE
3 Easton Oval
Suite 500                        Sector: Consumer Cyclical
Columbus, OH 43219               Industry: Residential Construction

M/I Homes, Inc., together with its subsidiaries, operates as a builder
of single-family homes in Ohio, Indiana, Illinois, Minnesota, Maryland,
Virginia, North Carolina, Florida, and Texas, the United States. The
company operates through Midwest Homebuilding, Southern Homebuilding,
Mid-Atlantic Homebuilding, and Financial Services segments. It designs,
constructs, markets, and sells single-family homes and attached
townhomes to first-time, millennial, move-up, empty-nester, and luxury
buyers under the M/I Homes and Showcase Collection brand names. The
company also purchases undeveloped land to develop into developed lots
for the construction of single-family homes, as well as for sale to
others. In addition, it originates and sells mortgages; and serves as a
title insurance agent by providing title insurance policies,
examination, and closing services to purchasers of its homes. The
company was formerly known as M/I Schottenstein Homes, Inc. and changed
its name to M/I Homes, Inc. in January 2004. M/I Homes, Inc. was
incorporated in 1973 and is based in Columbus, Ohio.

Last Trade:  35.61                           52-Week Range:  36.42 -  20.35
Employees: 1,359                             Avg.Volume:     229,548 Shares

Corporate Governance:
Pllar scores are Audit: 2; Board: 5; Shareholder Rights: 9; Compensation: 3.
         (A lower number means less governance risk.)

EPS:  3.88    Dividend Amount: $ 0.00          Yield:  0.00%
             Ex-Dividend Date: Jun 26, 2008    Payout Ratio:   0.00

Key Statistics:

    Trailing P/E:   9.09              Forward P/E (est.):   8.37
                                           Target Price:  35.00

Qrtly Stock Price Growth (yoy):  43.65%               Beta:   0.00
Qrtly S&P Index   Growth (yoy):   0.00%        Short Ratio:   2.25%
    Qrtly Revenue Growth (yoy):   4.12%         Shares Out:  27540000
   Qrtly Earnings Growth (yoy):   0.00%

          Book Value:   0.00                    Debt/Equity:   0.00%
    Price/Book Value:   1.08        Operating Profit Margin:   0.00%
         Price/Sales:   0.41                  Profit Margin:   0.00%
         Market Cap:     973,237,000       Return on Equity:   0.00%
    Enterprise Value:   1,910,000,000      Return on Assets:   0.00%

    Operating Cash Flow:         -2,592
         Free Cash Flow:       -142,924


Annual Income Statement:                          (All numbers in thousands)
  Period Ending                             12/31/2018  12/31/2017  12/31/2016

  Total Revenue                              2,286,282   1,961,971   1,691,327
  Cost of Revenue                            1,834,826   1,563,779   1,360,295
  Gross Profit                                 451,456     398,192     331,032

Operating Expenses:
  Research & Development                             0           0           0
  Selling, General & Administrative            280,608     254,609     220,409
  Non-Recurring Expenses                             0           0           0
  Other Operating Expenses                           0           0           0
  Total Operating Expenses                   2,115,434   1,818,388   1,580,704

Operating Income or Loss                       170,848     143,583     110,623

Income from Continuing Operations:
  Total Other Income/Expenses Net              -29,559     -23,259     -18,838
  Earnings Before Interest & Taxes             170,848     143,583     110,623
  Interest Expense                             -17,215     -16,117     -15,486
  Income Before Taxes                          141,289     120,324      91,785
  Income Tax Expense                            33,626      48,243      35,176
  Minority Interest                                  0           0           0

Net Income from Continuing Op.s                107,663      72,081      56,609

Non-recurring Events:
  Discontinued Operations                            0           0           0
  Extraordinary Items                                0           0           0
  Effect of Accounting Changes                       0           0           0
  Other Items                                        0           0           0
  Net Income                                   107,663      72,081      56,609
  Preferred Stock & Other Adjustments                0           0           0

Net Income Avail to Common Shares              107,663      66,168      51,734


Annual Cash Flow Statement:                   (All numbers in thousands)
  Period Ending                         12/31/2018    12/31/2017    12/31/2016

  Net Income                               107,663        72,081        56,609

Operating Activities:
  Depreciation                              11,740        10,699        10,204
  Adjustments to Net Income                 12,583         2,404         7,390
  Changes in Accounts Recv'bls                   0             0             0
  Changes in Liabilities                     3,750        14,021        16,334
  Changes in Investories                  -157,573      -168,622       -83,775
  Changes in other Oper'g Acts              16,454        12,758        24,033

Total Cash Flow f Operations                -2,592       -53,184        34,197

Investing Activities:
  Capital Exenditures                       -8,141        -8,799       -13,106
  Investments                              -31,191        -8,570       -18,539
  Other Cash Flows fr Investing                  0             0             0

Total Cash Flows from Investing           -133,957        -9,157       -31,645

Financing Activities:
  Dividends Paid                                 0        -3,656        -4,875
  Sale of Purchase of Stock                      0             0             0
  Net Borrowings                            31,794       229,161        23,721
  Other Cash Flows fr Financing               -248        -6,707             0

Total Cash Flows from Financing              6,375       179,603        18,788

  Effect of Exchange Rate Chg                    0             0             0

Change in Cash & Cash Equiv.              -130,174       117,262        21,340


Annual Balance Sheets:                              (All Numbers in Thousands)
  Period Ending                          12/31/2018    12/31/2017    12/31/2016
Current Assets:
  Cash & Cash Equivalents                    20,829       150,703        33,341
  Short Term Investments                          0             0             0
  Net Receivables                            13,632        14,981        15,698
  Inventory                               1,674,460     1,414,574     1,215,934
  Other Current Assets                      170,351       172,769       155,350
  Total Current Assets                    1,888,866     1,762,320     1,431,800

  Long-Term Investments                      35,870        20,525        28,016
  Property, Plant & Equipt                   29,395        26,816        22,299
  Goodwill                                   16,400             0             0
  Intangible Assets                           6,477         7,821        11,443
  Accumulated Amortization                        0             0             0
  Other Assets                               44,573        47,289        54,953
  Deferred LT Asset Charges                  13,482        18,438        30,875

Total Assets                              2,021,581     1,864,771     1,548,511

Current Liabilities:
  Accounts Payable                          131,511       117,233       103,212
  Current Portion LT Debt                         0        86,132        57,093
  Other Current Liabilities                  45,767        47,678        35,260
  Total Current Liabilities                 361,874       447,366        374,600

  Long Term Debt                            667,793       553,407       427,815
  Other Liabilities                         136,611       116,700        91,922
  Deferred LT Liab. Charges                   7,873         5,634         4,740
  Minority Interest                               0             0             0
  Negative Goodwill                               0             0             0

Total Liabilities                         1,166,278     1,117,473       894,337

Stockholder Equity:
  Misc. Options, Warrants                         0             0             0
  Redeemable Preferred Stock                      0             0             0
  Preferred Stock                                 0             0             0
  Common Stock                                  301           295           271
  Retained Earnings                         580,992       473,329       407,161
  Treasury Stock                            -56,507       -32,809       -47,970
  Capital Surplus                           330,517       306,483       246,549
  Other Stockhohlder Equity                       0             0             0
  Total Stockholder Equity                  855,303       747,298       606,011

Net Tangible Assets                         832,426       739,477       594,568


M/I Homes, Inc. (MHO)                       [Indices near +3.0, near zero,
                                            or < zero bear special attention.]
P/E Ratio Tests:
P/E Ratio < 28?            3.0000          P/E Ratio > 5?             1.0000
P/E Ratio Vs Growth Rate:  0.0000          Forward P/E Ratio < 28?    3.0000
Price/Sales Ratio < 2.3?   3.0000          Inventory/Sales < 5%?      0.0683
Sales < $1 Billion?        0.4374          Operating Margin < 7.5%?   0.0000

Balance Sheet Tests:
Debt/Equity < 0.40?        1.0000          Long-Term Debt Service:    1.2808
LTD Being Reduced?        -3.0000          Short-Term Debt Service:  -3.0000
Current Ratio > 2?         2.6098          Working Capital >= 1.5?    0.2912
Leverage Ratio < 20%?      0.5657          Debt/Assets < 1?           3.0000
Quick Ratio > 1?           3.0000          Inventory Turnover > 1?    0.7915
Share Equity Increase:     2.3777          Market Cap.< 1.5 Billion?  1.5412
                                           Intangibles < 3% Assets?   2.6510
Income Tests:
Profit Margin < 7.5%?      0.0000          EPS Annual Growth > 10%?   0.0615
Dividend Yield > 2.0%?     0.0000          EPS 3-yr Growth > 15?      0.0721
Enterprise Value/Revenue   0.4260          EPS Growth Consistent?     2.0000
Enterprise Value/EBITDA:   3.0000          Collection < 45 days?      3.0000
EPS Qrtly Growth > 10%?    0.0000          Gross Pft/Cur. LTD > 1?    3.0000
                                           Borrowing Int. Rate < 6%? -2.3275
Stock Performance Tests:
Volatility > 25%?          1.7650          % Held by Insiders < 5%?   2.1739
Beta > 1.25?               0.0000          % Held by Institut. < 50?  0.5052
50 Da MA > 200 Da MA?      0.2291          % Held by Institut. > 30?  3.0000
52-Wk Change vs. S&P 500:  3.0000          Short Ratio > 5?           0.4500
Price/Book Value < 3?      3.0000          Short % of Float > 20?     0.0950
Return on Assets > 17%?    0.0000          Average Volume > 100,000?  2.2955

Cash Flow Tests:
Oper. C.F. > Lever'd C.F:  0.0181          Positive Free Cash Flow?  -1.0000
Positive Oper. Cash Flow? -1.0000          Price to C.F.Ratio < 14?:  2.0560
                                           Cash Flow / Assets > 10%?  0.7070

MHO    M/I Homes, Inc.                     Overall Zenith Index:      1.0233
Financial Statements |
M/I HOMES INC  (MHO)                        INCOME STATEMENT

Fiscal year ends in December.                        2014-12         2015-12         2016-12         2017-12         2018-12             TTM

Revenue                                        1,215,180,032   1,418,395,008   1,691,326,976   1,961,970,944   2,286,281,984   2,395,121,920
Cost of revenue                                  958,990,976   1,114,663,040   1,358,183,040   1,561,021,952   1,836,704,000   1,930,989,952
Gross profit                                     256,188,992     303,732,000     333,144,000     400,948,992     449,577,984     464,132,000


Operating expenses
Sales, General and administrative                169,978,000     188,300,000     220,408,992     254,608,992     280,608,000     288,203,008
Restructuring, merger and acquisition                      0               0               0               0       1,700,000               0
Other operating expenses                                   0               0               0               0      -1,700,000               0
Total operating expenses                         169,978,000     188,300,000     220,408,992     254,608,992     280,608,000     288,203,008

Operating income                                  86,211,000     115,432,000     112,735,000     146,340,000     168,970,000     175,928,992
Interest Expense                                  13,365,000      17,521,000      17,598,000      18,874,000      20,484,000      21,707,000
Other income (expense)                            -3,110,000     -10,982,000      -3,352,000      -7,142,000      -7,197,000      -5,655,000
Income before taxes                               69,736,000      86,929,000      91,785,000     120,324,000     141,288,992     148,567,008
Provision for income taxes                        18,947,000      35,166,000      35,176,000      48,243,000      33,626,000      38,909,000
Net income from continuing operations             50,789,000      51,763,000      56,609,000      72,081,000     107,663,000     109,658,000
Net income                                        50,789,000      51,763,000      56,609,000      72,081,000     107,663,000     109,658,000
Preferred dividend                                 4,875,000       4,875,000       4,875,000       3,656,000               0               0
Net income available to common shareholders       45,914,000      46,888,000      51,734,000      68,425,000     107,663,000     109,658,000

Earnings per share
Basic                                                   1.88            1.91            2.10            2.57            3.81            3.93
Diluted                                                 1.65            1.68            1.84            2.26            3.70            3.85

Weighted average shares outstanding
Basic                                             24,463,000      24,575,000      24,666,000      25,769,000      28,234,000      27,834,000
Diluted                                           29,912,000      30,047,000      30,116,000      30,688,000      29,178,000      28,282,500

____________________________________________________________________________________________________________________________________________


M/I HOMES INC  (MHO)                        BALANCE SHEET

Fiscal year ends in December.                        2014-12         2015-12         2016-12         2017-12         2018-12

Assets

Current assets

Cash

Total cash                                        15,535,000      10,205,000      34,441,000     151,703,008      21,529,000

Inventories                                      918,588,992   1,112,041,984   1,215,933,952   1,414,573,952   1,674,460,032
Other current assets                              99,745,000     129,897,000     154,020,000     171,580,000     169,651,008
Total current assets                           1,033,868,992   1,252,144,000   1,404,395,008   1,737,857,024   1,865,639,936

Non-current assets

Property, plant and equipment
Gross property, plant and equipment               36,260,000      37,601,000      47,793,000      52,299,000      51,808,000
Accumulated Depreciation                         -24,771,000     -24,704,000     -25,494,000     -25,483,000     -22,413,000
Net property, plant and equipment                 11,489,000      12,897,000      22,299,000      26,816,000      29,395,000

Equity and other investments                      27,769,000      36,967,000      28,016,000      20,525,000      35,870,000
Goodwill                                                   0               0               0               0      16,400,000
Deferred income taxes                             94,412,000      67,404,000      30,875,000      18,438,000      13,482,000
Other long-term assets                            43,870,000      46,142,000      62,926,000      61,135,000      60,794,000
Total non-current assets                         177,540,000     163,410,000     144,116,000     126,914,000     155,940,992

Total assets                                   1,211,409,024   1,415,554,048   1,548,510,976   1,864,770,944   2,021,581,056

Liabilities and stockholders' equity

Liabilities

Current liabilities
Accounts payable                                  75,338,000      86,878,000     103,212,000     117,233,000     131,511,000
Deferred revenues                                 11,759,000      19,567,000      22,156,000      26,378,000      32,055,000
Total current liabilities                         87,097,000     106,445,000     125,368,000     143,611,008     163,566,000

Non-current liabilities
Long-term debt                                   497,116,000     611,848,000     637,803,008     807,734,016     820,961,024
Accrued liabilities                                        0               0      61,557,000      65,308,000      77,501,000
Other long-term liabilities                       82,902,000     100,695,000      69,609,000     100,820,000     104,250,000
Total non-current liabilities                    580,017,984     712,542,976     768,969,024     973,862,016   1,002,712,000

Total liabilities                                667,115,008     818,988,032     894,337,024   1,117,473,024   1,166,278,016

Stockholders' equity

Preferred stock                                   48,163,000      48,163,000      48,163,000               0               0
Common stock                                         271,000         271,000         271,000         295,000         301,000
Additional paid-in capital                       238,560,000     241,239,008     246,548,992     306,483,008     330,516,992
Retained earnings                                308,539,008     355,427,008     407,160,992     473,328,992     580,992,000
Treasury stock                                   -51,238,000     -48,534,000     -47,970,000     -32,809,000     -56,507,000
Total stockholders' equity                       544,294,976     596,566,016     654,174,016     747,297,984     855,302,976
Total liabilities and stockholders' equity     1,211,410,048   1,415,554,048   1,548,510,976   1,864,770,944   2,021,581,056

____________________________________________________________________________________________________________________________________________


M/I HOMES INC  (MHO)                        Statement of CASH FLOW

Fiscal year ends in December. USD.                   2014-12         2015-12         2016-12         2017-12         2018-12             TTM

Cash Flows From Operating Activities
Net income                                        50,789,000      51,763,000      56,609,000      72,081,000     107,663,000     109,658,000
Depreciation & amortization                        5,175,000       6,612,000       8,552,000       9,630,000      10,956,000      11,376,000
Investment/asset impairment charges                3,457,000       3,638,000       3,992,000       7,681,000       5,809,000               0
Deferred income taxes                             16,499,000      32,526,000      31,311,000      12,437,000       4,957,000       4,935,000
Stock based compensation                           3,215,000       3,942,000       5,315,000       6,044,000       5,974,000       5,838,000
Change in working capital                       -200,366,000    -145,282,000     -43,408,000    -141,843,008    -137,368,992     -92,709,000
Inventory                                       -209,318,000    -159,011,008     -83,775,000    -168,622,000    -157,572,992    -109,737,000
Accounts payable                                   5,112,000       9,827,000      16,334,000      14,021,000       3,750,000      12,580,000
Other working capital                              3,840,000       3,902,000      24,033,000      12,758,000      16,454,000       4,448,000
Other non-cash items                             -11,444,000     -35,358,000     -28,174,000     -18,560,000        -582,000     -10,148,000
Net cash provided by operating activities       -132,675,000     -82,159,000      34,197,000     -52,530,000      -2,592,000      28,950,000

Cash Flows From Investing Activities
Investments in property, plant, and equipmen      -2,946,000      -3,659,000     -13,106,000      -8,799,000      -8,141,000      -5,125,000
Acquisitions, net                                -20,415,000     -42,112,000     -21,746,000     -12,088,000    -132,827,000     -42,827,000
Sales/Maturities of investments                    1,523,000       1,226,000       3,207,000       3,518,000         676,000         150,000
Other investing activities                         9,257,000       6,914,000               0       7,558,000       6,335,000               0
Net cash used for investing activities           -12,581,000     -37,631,000     -31,645,000      -9,811,000    -133,957,000     -47,802,000

Cash Flows From Financing Activities
Debt issued                                      199,678,000     755,569,024     380,747,008     667,761,024     585,632,000     698,040,000
Debt repayment                                  -162,600,000    -631,451,008    -357,025,984    -438,600,000    -553,838,016    -698,969,024
Preferred stock repaid                                     0               0               0     -50,420,000               0               0
Common stock repurchased                                   0               0               0               0     -25,709,000     -30,859,000
Dividend paid                                     -4,875,000      -4,875,000      -4,875,000      -3,656,000               0               0
Other financing activities                          -137,000      -4,783,000         -58,000       4,518,000         290,000       3,216,000
Net cash provided by (used for) financing         32,066,000     114,460,000      18,788,000     179,603,008       6,375,000     -28,572,000

Net change in cash                              -113,190,000      -5,330,000      21,340,000     117,262,000    -130,174,000     -47,424,000
Cash at beginning of period                      128,725,000      15,535,000      13,101,000      34,441,000     151,703,008      67,817,000
Cash at end of period                             15,535,000      10,205,000      34,441,000     151,703,008      21,529,000      20,393,000

Free Cash Flow
Operating cash flow                             -132,675,000     -82,159,000      34,197,000     -52,530,000      -2,592,000      28,950,000
Capital expenditure                               -2,946,000      -3,659,000     -13,106,000      -8,799,000      -8,141,000      -5,125,000
Free cash flow                                  -135,620,992     -85,818,000      21,091,000     -61,329,000     -10,733,000      23,825,000
____________________________________________________________________________________________________________________________________________
Average to Current P/E Ratios |
              (MHO)     M/I Homes Inc.

                               2014    2015    2016    2017    2018

          Annual Earnings:     1.65    1.68    1.84    2.33    3.70
Average Price During Year:    22.90   23.64   20.31   26.95   28.24

                P/E Ratio:    13.88   14.07   11.04   11.57    7.63

 Average 5-Year P/E Ratio  =  11.64
             Current Price =  35.24

Previous 5 Quarter Earnings:   2.29    1.56    0.81    1.21    1.21

          Current Annualized (Last Four Quarters) Earnings =   3.23
                                                           ________
                                 Average PE / Current PE =     1.07
                                                           --------

                                      ...a number above 1.00 is good
                                                1.00 or below is bad
Financial Ratios |
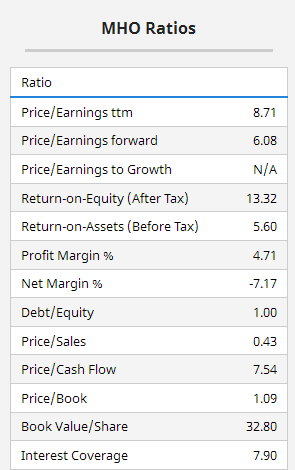
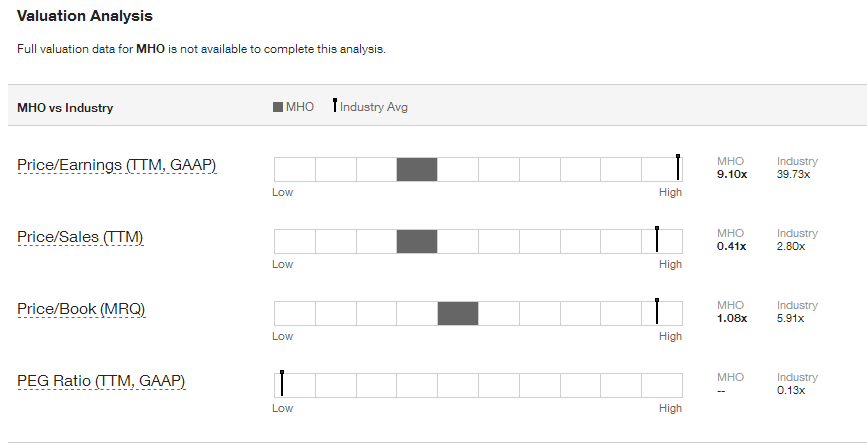
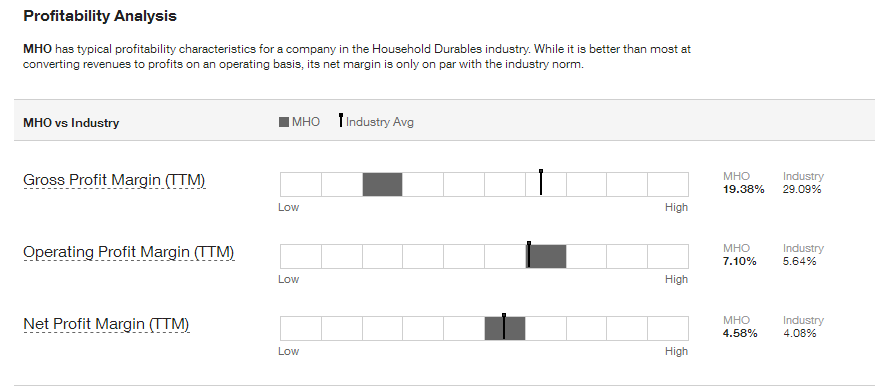
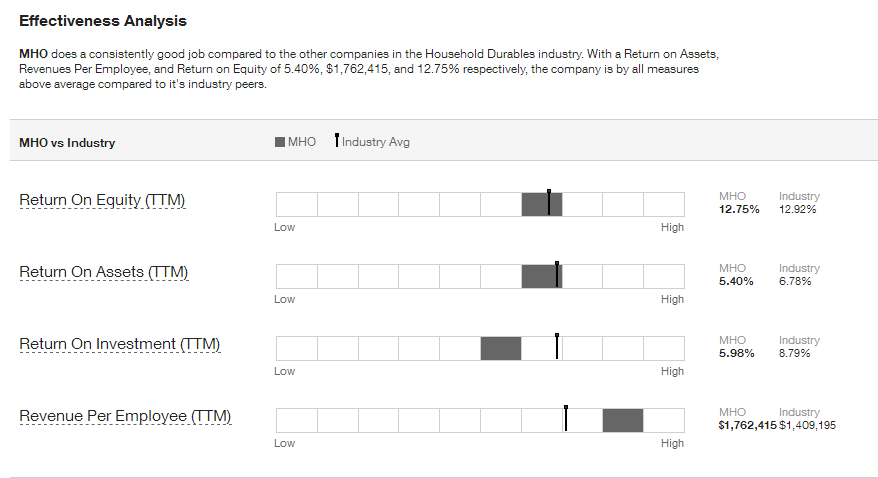
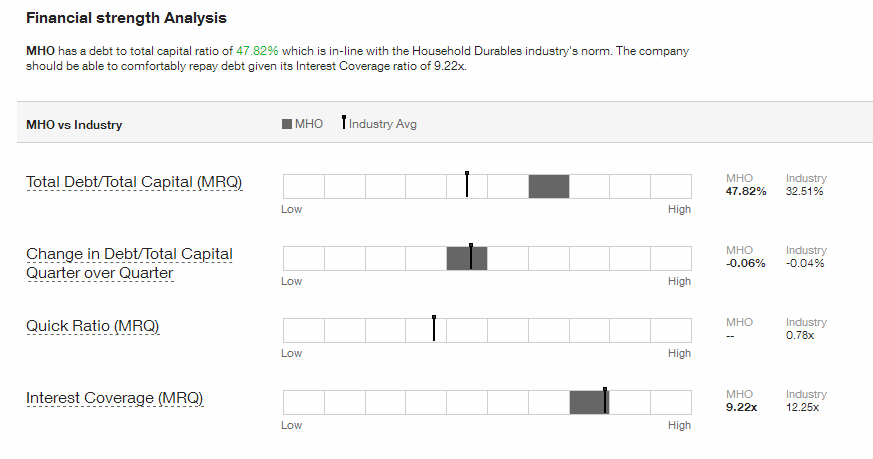
. . . . . . . . . . . . Lowest to Highest, Compared to Industry
Intrinsic Value (DCF) |
Intrinsic Value by Discounted Cash Flow Method:
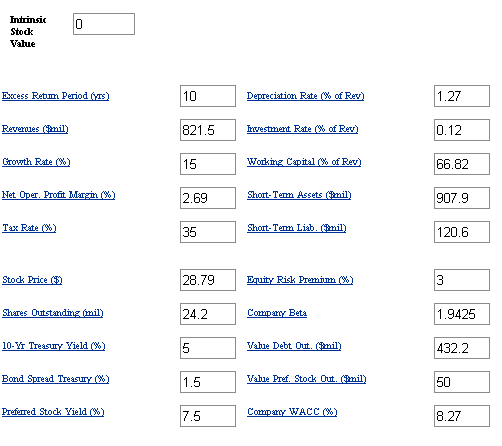
Fair Value Estimator |
Fair Value Estimate:

Projected Earnings |

Research Reports |
Analysts' Opinions |
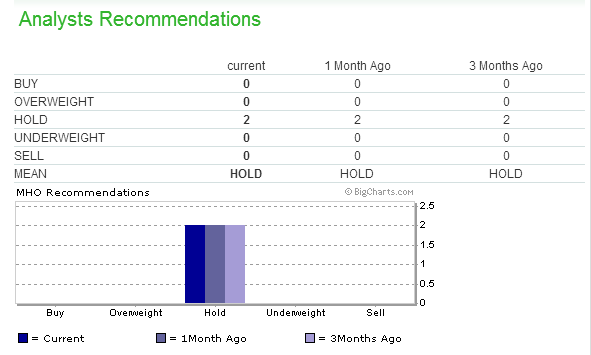
Insider Activity |
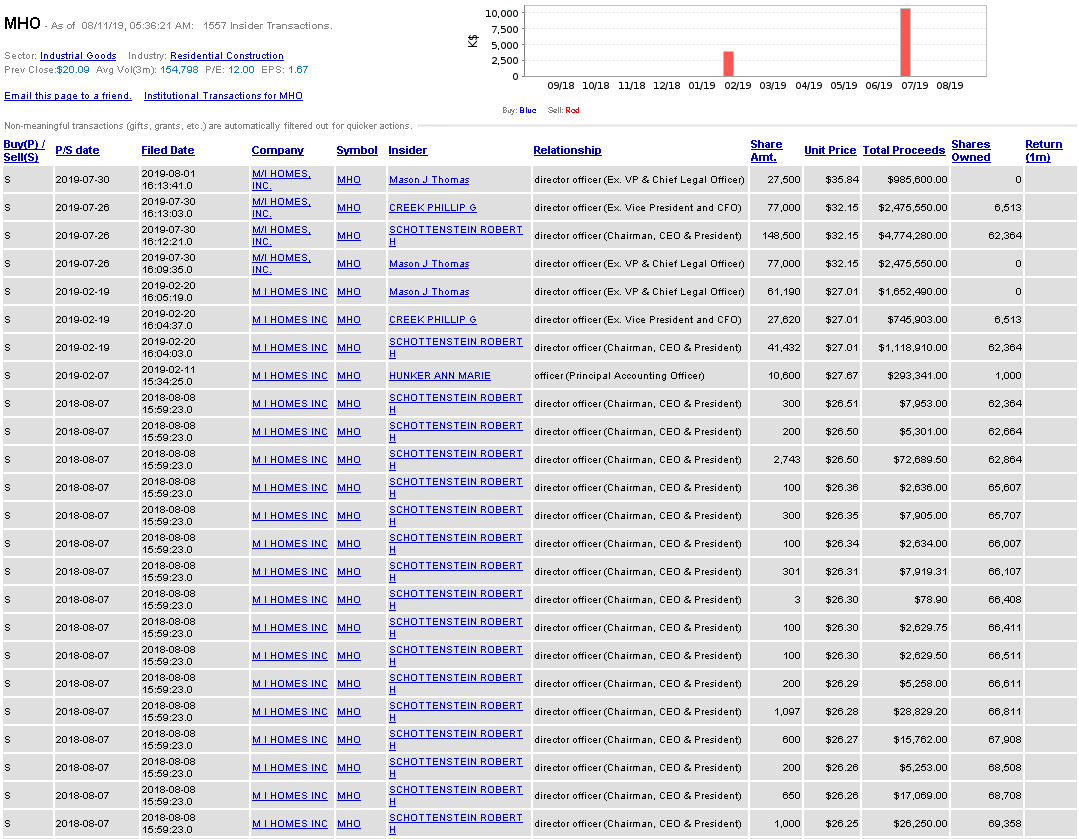

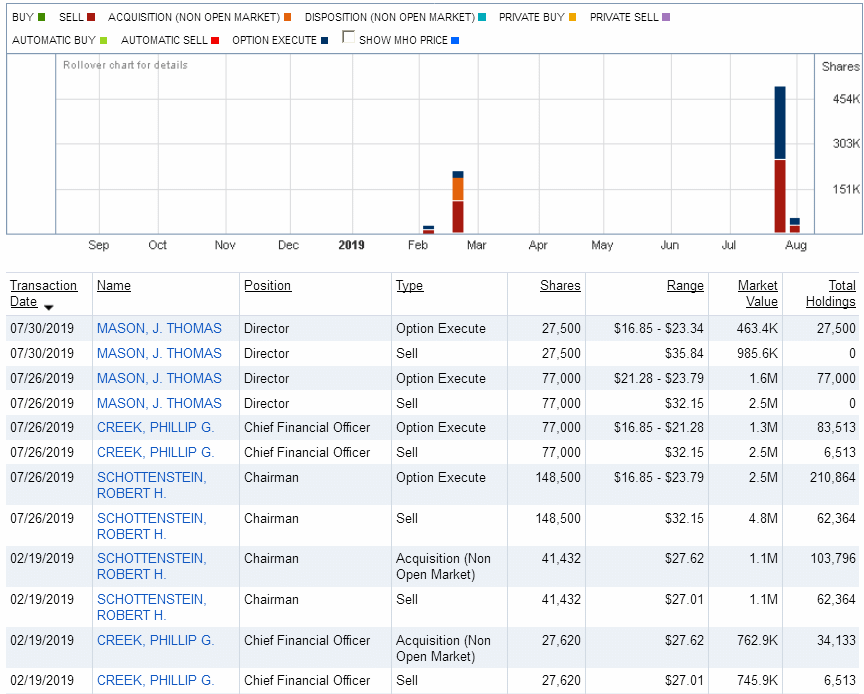
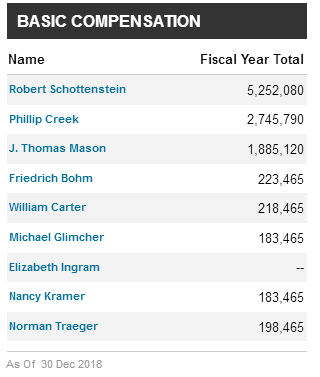
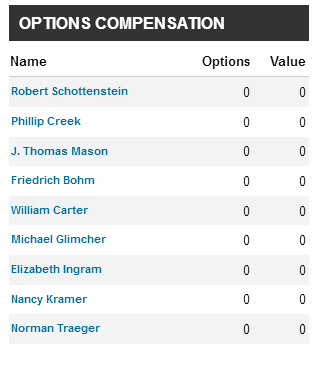
Institutional Activity |
Institutional Orders to Buy or Sell:
Sentiment |
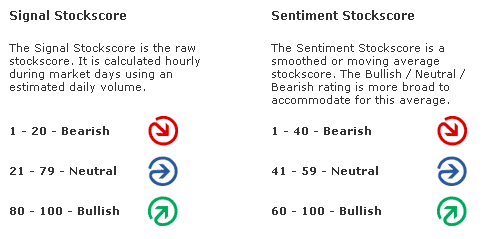
Zenith uses the "sentiment" score above or below 50 to award a positive or negative point in the Decision Matrix.


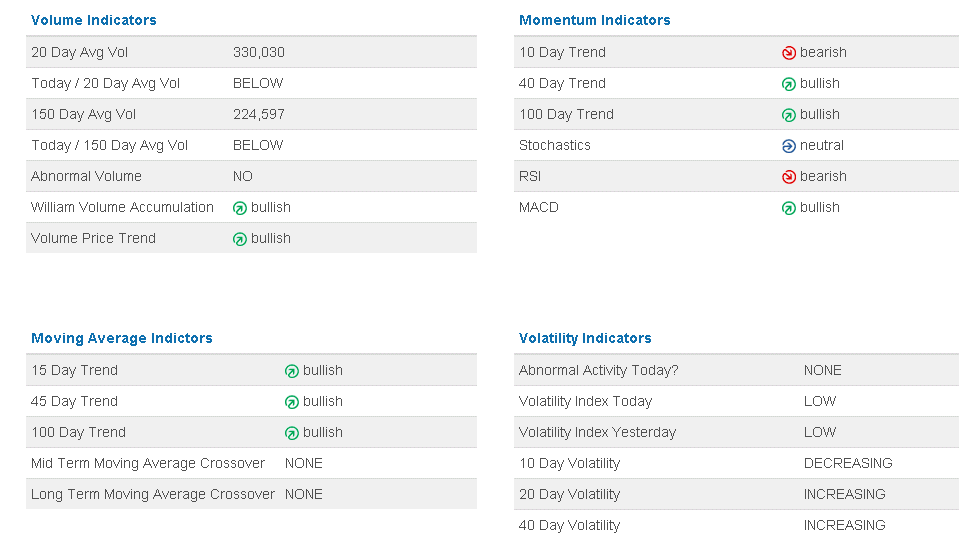
Short Interest Ratio |
As the short interest rises as a percentage of average daily share volume (Days to Cover), this is considered a measure of negative sentiment. Similarly, a decrease in that percentage is considered positive sentiment.
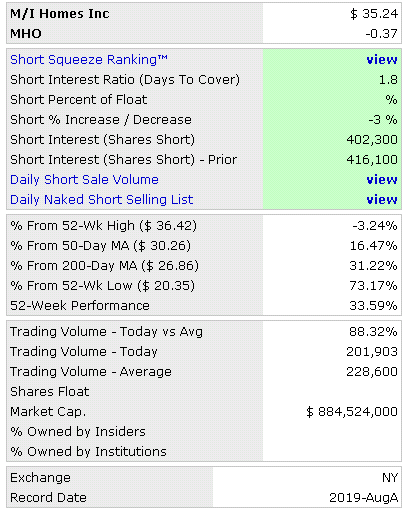

Standard & Poor's |
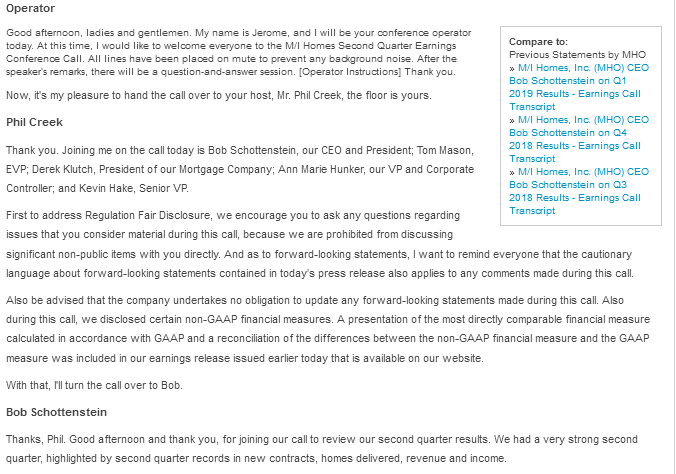
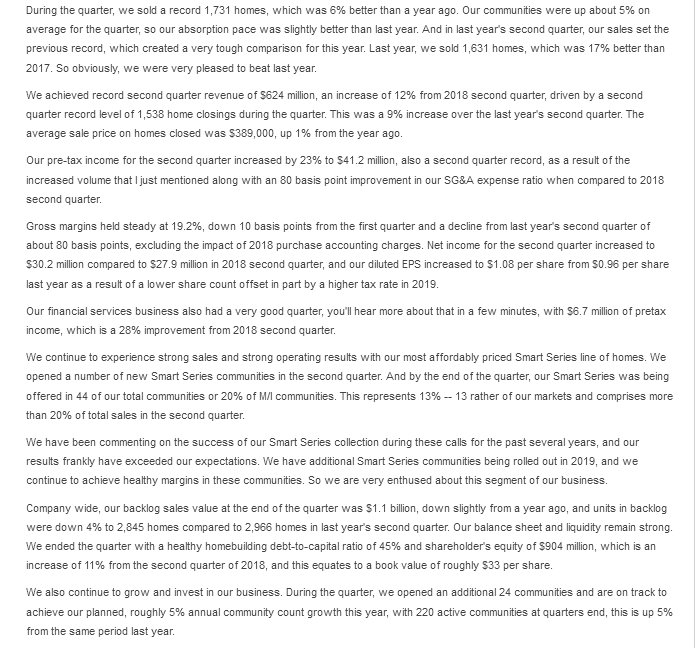
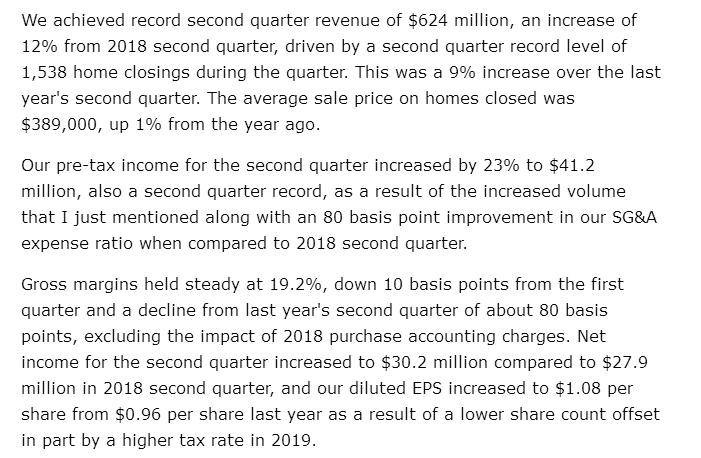
Management's Discussion of Results of Operations Excerpts |
Channeling Potential |
The summary below includes a value for `Degree,' which refers on a
scale of 1 to 10 the range of a channel in the period under consi-
deration compared to the total range of price movement. It also looks
for the last closing price to be within the channel, otherwise zeroed.
The `Index' is the `Degree' weighted for volatility.  Generally, the
the higher the index, the more suitable is the stock for trading as
a `rolling stock' between channel high and low points.

Results for M/I HOMES INC.:
Symbol? MHO
Total Months Available:  25
       Months in Cycle?   4

Months Covered by Periods:  12

Period 1           Period 2          Period 3
   H1      L1        H2      L2        H3      L3
  26.72   21.30     29.78   20.34     36.42   26.72

RANGE   =  36.42  TO   20.34            Close =  35.61
CHANNEL =  26.72  TO   26.72           Degree =   0
Volatility =   0.00%                    Index =   0
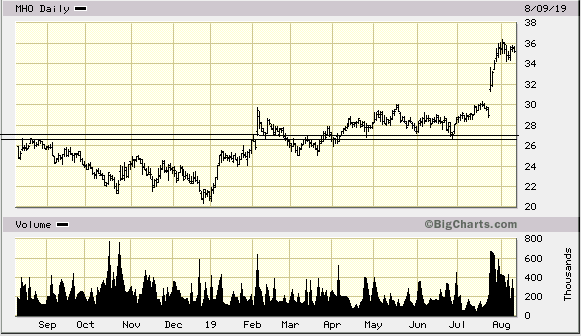
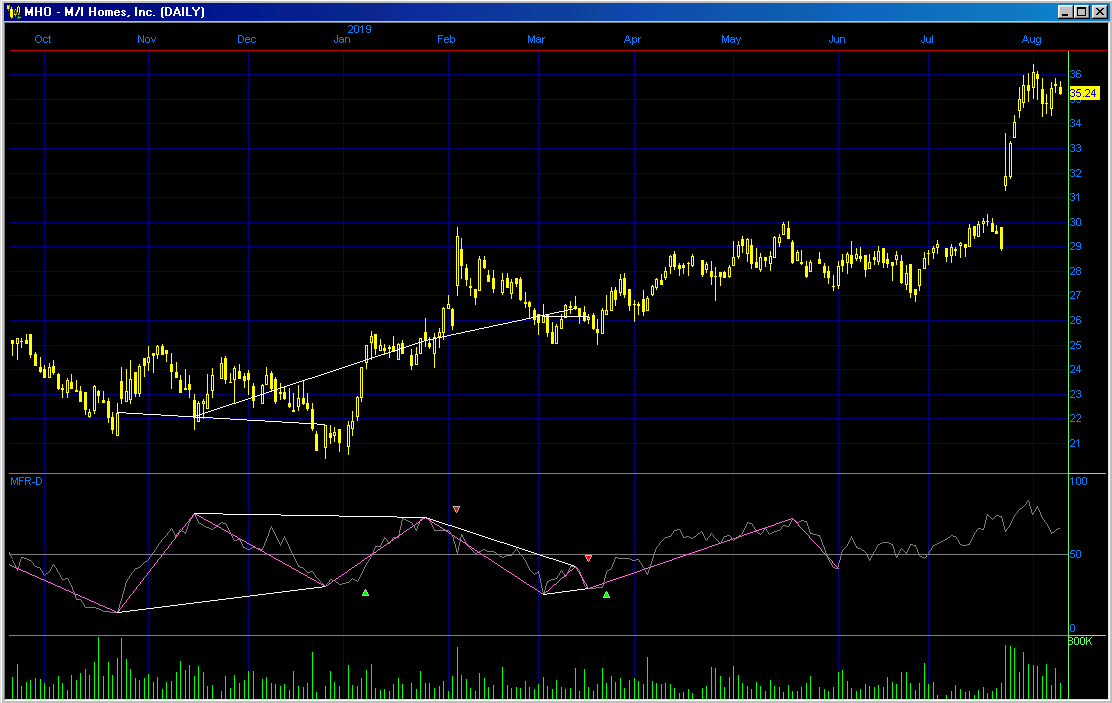
MACD Histogram Divergence |
The theory is that connecting the two most recent peaks or valleys of the MACD histogram will signal the direction of the next major move.
Intraday Chart |
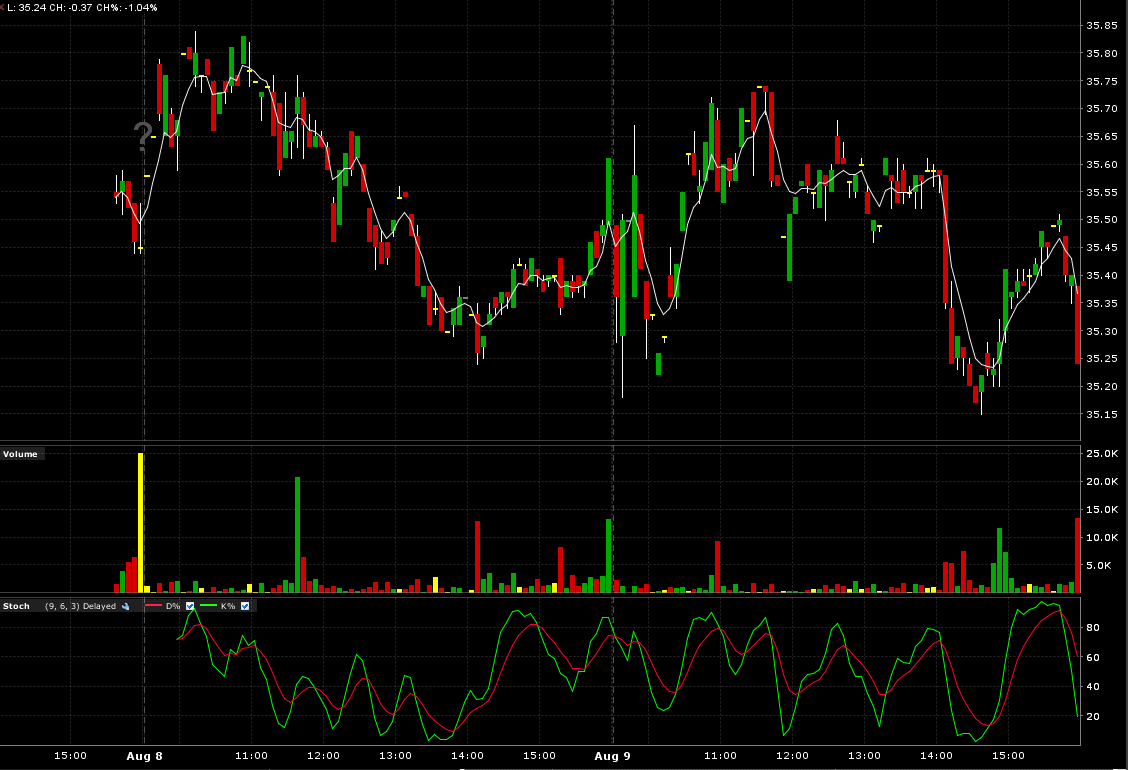
2 Days:
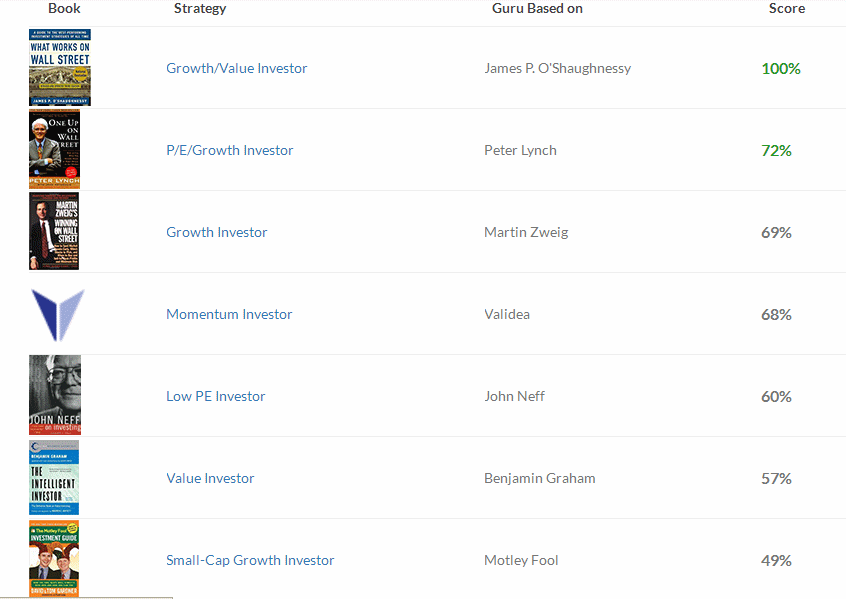
Val Idea |
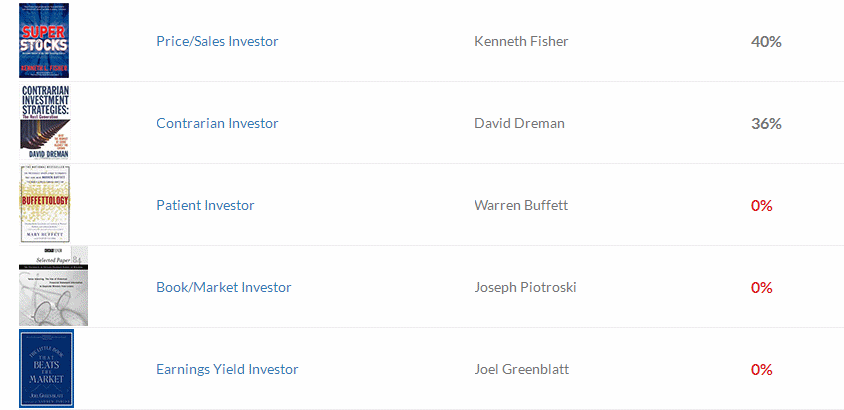
6 out of 11 favorable, (positive opinion.)
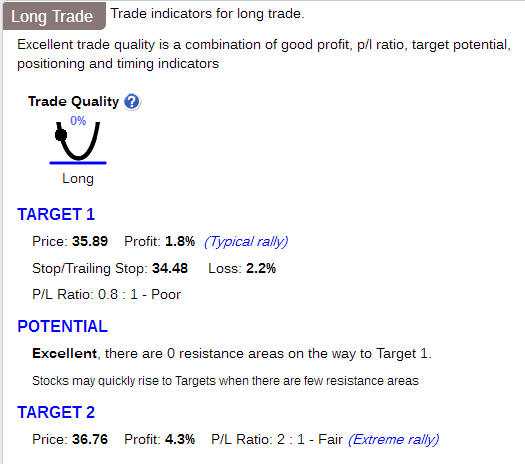
Stock Consultant |
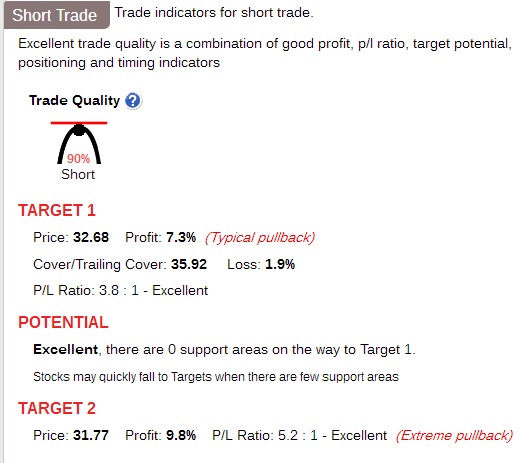
Point & Figure Chart |
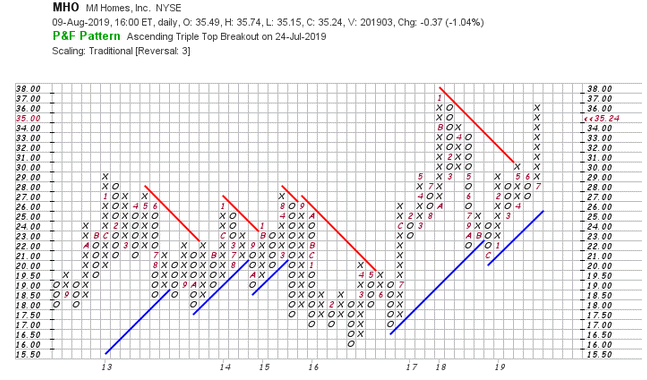
Wall Street Analyzer |
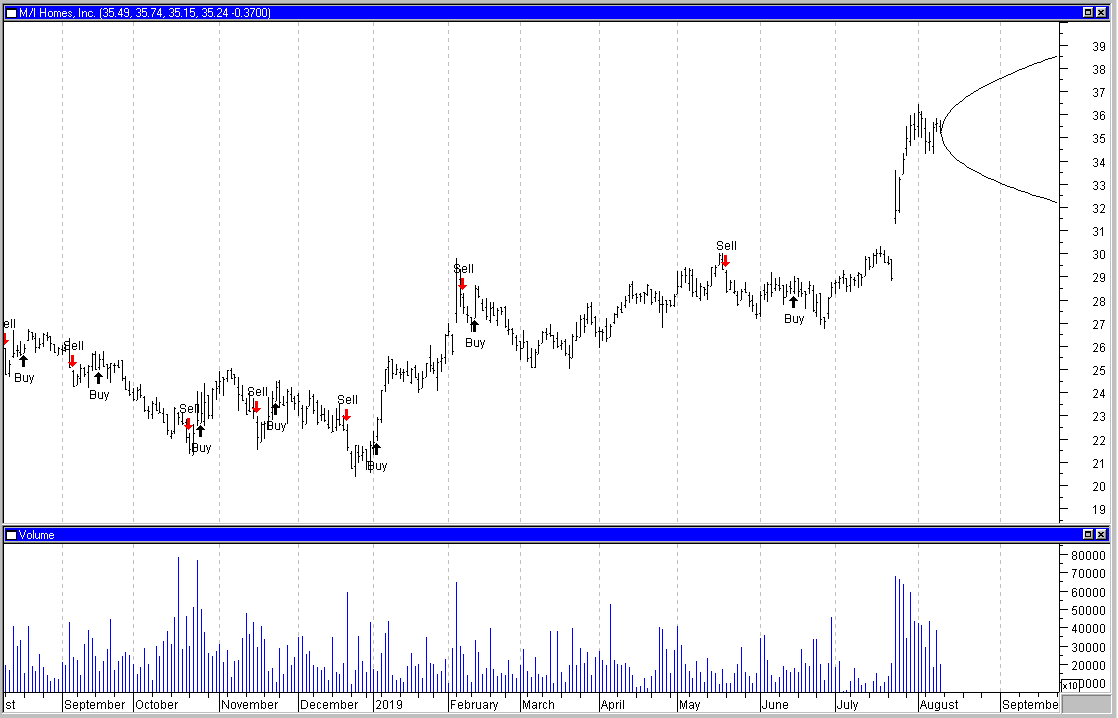
Marketspace Chart |
Time Series Forecast |
Neural Network Prediction |
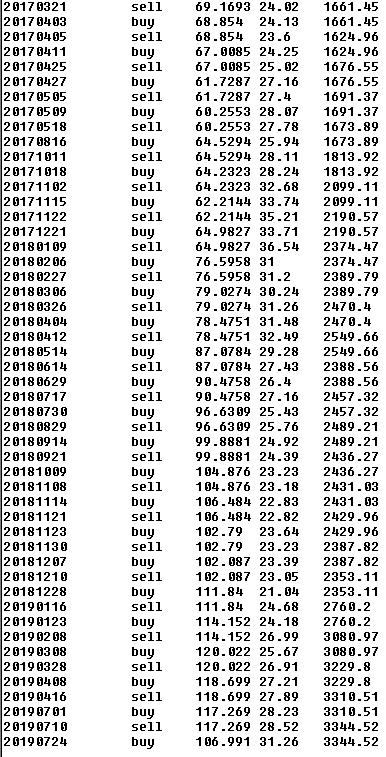
"Neurostock" can only track long trades. Therefore its performance, as tracked by itself on stocks which are consistently falling, may not appear as good as it could if each "sell" signal were a "short sale."

![]()

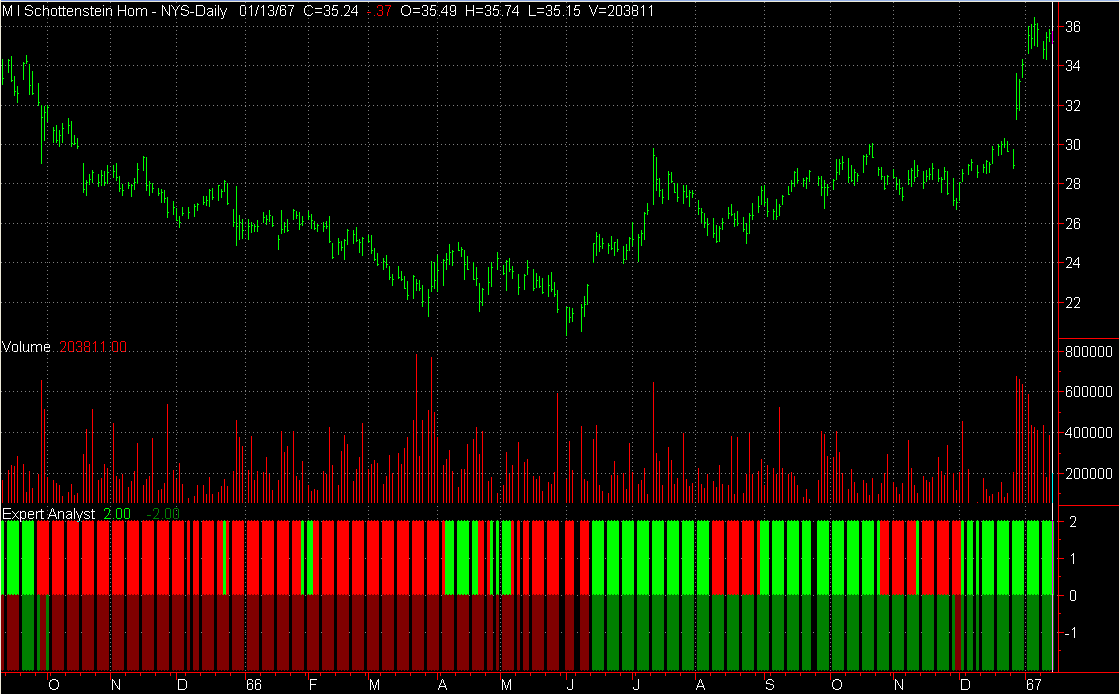
Ultimate Trading Systems |
3 out of 3 of the ultimate systems favor an upmove.
System Below:
Short term outlook: Positive: Bright Green, Negative: Bright Red
Long term outlook: Postive: Dark Green, Negative: Dark Red.

Recommendation |
| Factors | Weighted Points |
|---|---|
| News | + 1 |
| Comparison | - 1 |
| Industry | + 1 |
| Bond Issue | + 1 |
| Zenith Index | - 1 |
| Non-GAAP vs. GAAP Earnings | - 1 |
| Cash Flow | - 1 |
| Average to Current P/E | + 1d |
| Ratios | + 1 |
| Intrinsic Value DCF | - 1 |
| Fair Value Estimator | + 1 |
| Projected Earnings | + 1 |
| Research Reports | - 1 |
| Analysts | - 1 |
| Executive Perquisites | + 1 |
| Insider Activity | - 1 |
| Institutional Activity | - 1 |
| Management Reporting | + 1 |
| Short Interest | + 1 |
| Sentiment | + 1 |
| Standard & Poor's | - 1 |
| MACD Histogram Divergence | + 1 |
| Val Idea | + 1 |
| Stock Consultant | - 1 |
| Point & Figure | + 1 |
| Wall Street Analyzer | - 1 |
| Marketspace Chart | + 1 |
| Time Series Chart | - 1 |
| Neural Network | - 1 |
| Stock Options | - 1 |
| Ultimate Trading Systems | + 1 |
| Total | + 1 |
Place 850 shares of M/I Homes, Inc. (MHO) on the Active List.