![]()
Corporate Webpages Intelligent Systems, Inc.
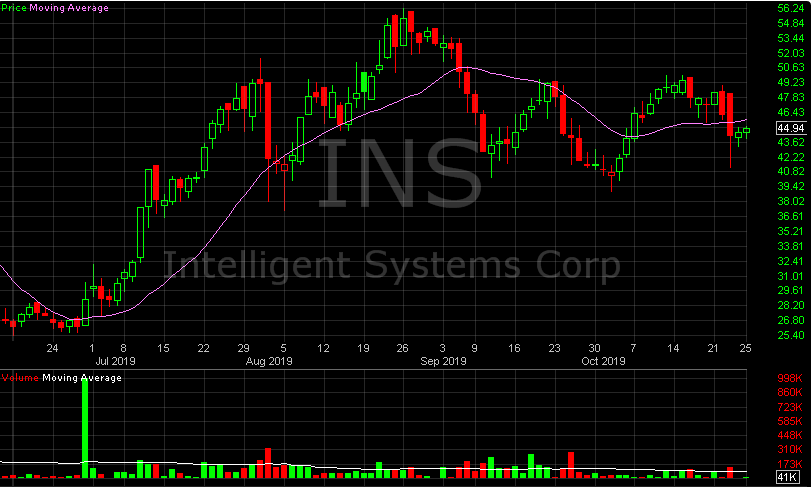
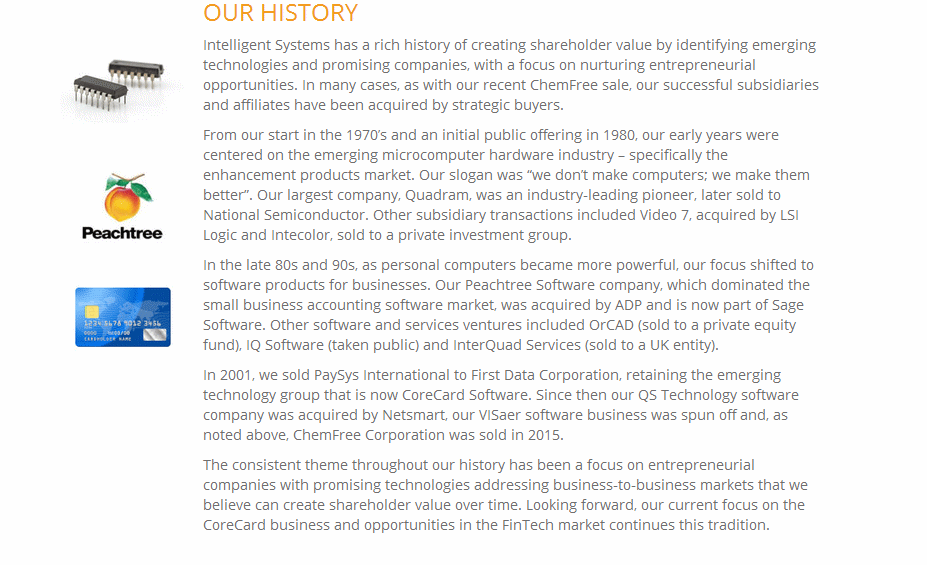
Get your brain in gear to try to analyze this stock. Intelligent
Systems Inc. (INS) has been around for forty years in one form or
another according to its website. However, it was primarily a
maker of washing equipment for grease and solvent removal for
automotive and military mechanical equipment parts. In 2015, it
sold that ChemFree Corporation to focus on production of
software for analyzing accounting statements, a totally
unrelated business. If you had bought company stock in that
year and held it, you would have made over 14 times your investment
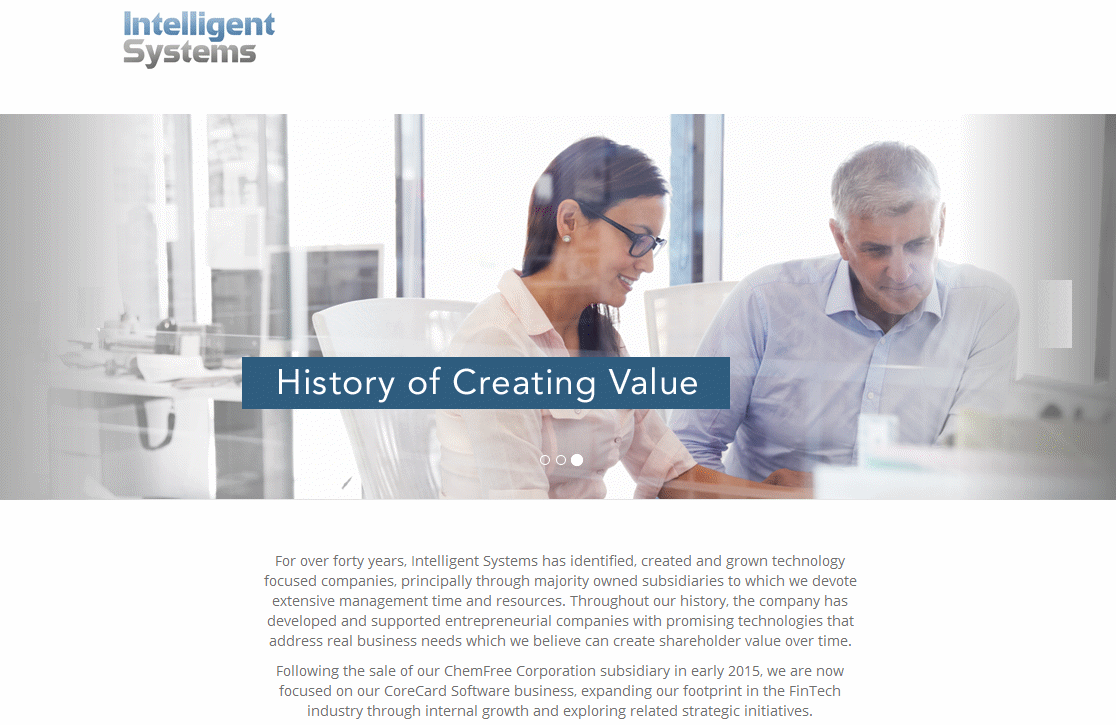
by today. This is all the more remarkable to us because if you
visit the company website, it is rather hard to tell exactly
what the company does. For a software company, we felt the
website had broken links, things that didn't work, little
explanation, very little information to interest potential
shareholders, no CEO Letter or glitzy annual report. There is
also another larger "Intelligent Systems" foreign-based company
out there that can easily be confused with this one. This one
is based in Georgia's Atlanta area but has offices, sales, and
research staff in foreign countries like India, where technical
competence in information technology often exceeds what can be
found in the U.S.
This is an AMEX stock, but the meddling Intercontinental
Exchange (ICE) acquired both the NYSE and the AMEX, so
technically this is also an NYSE stock.
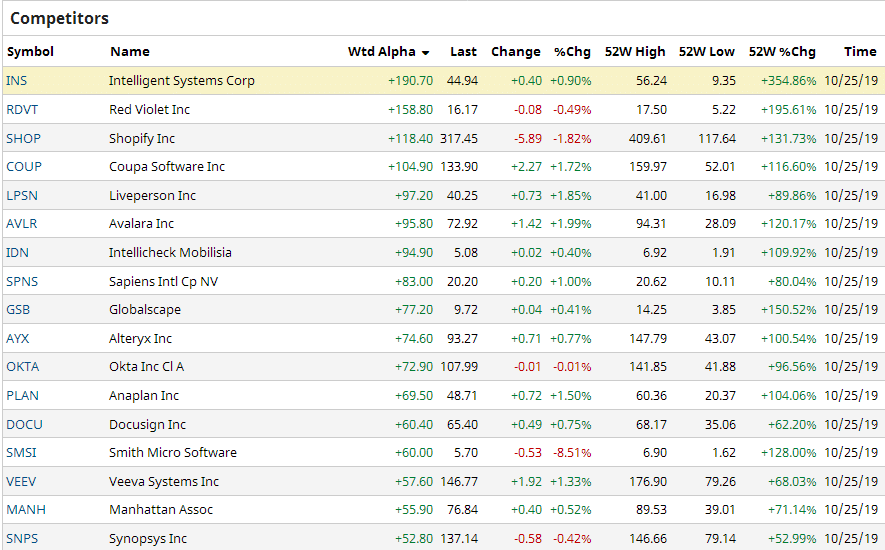
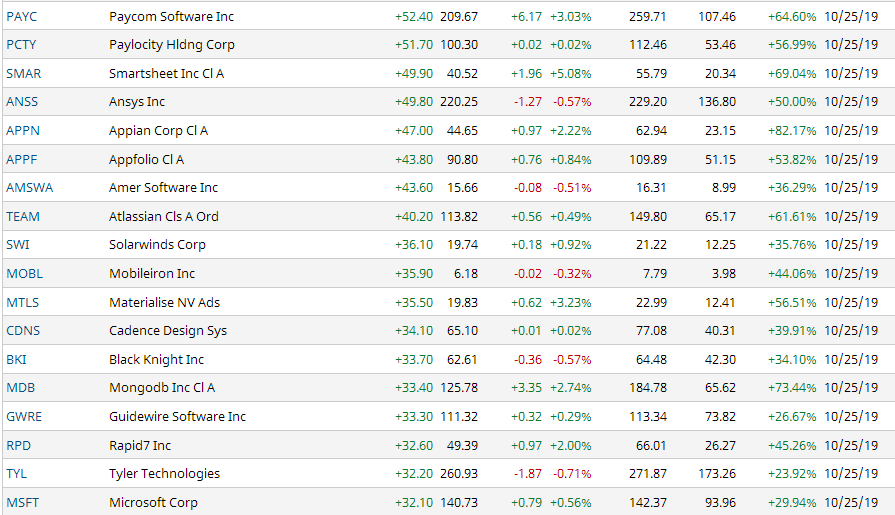
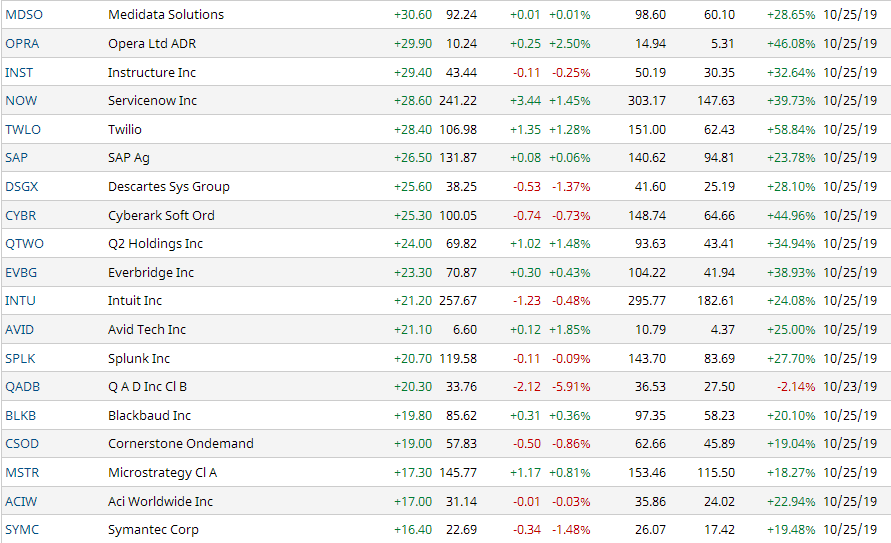
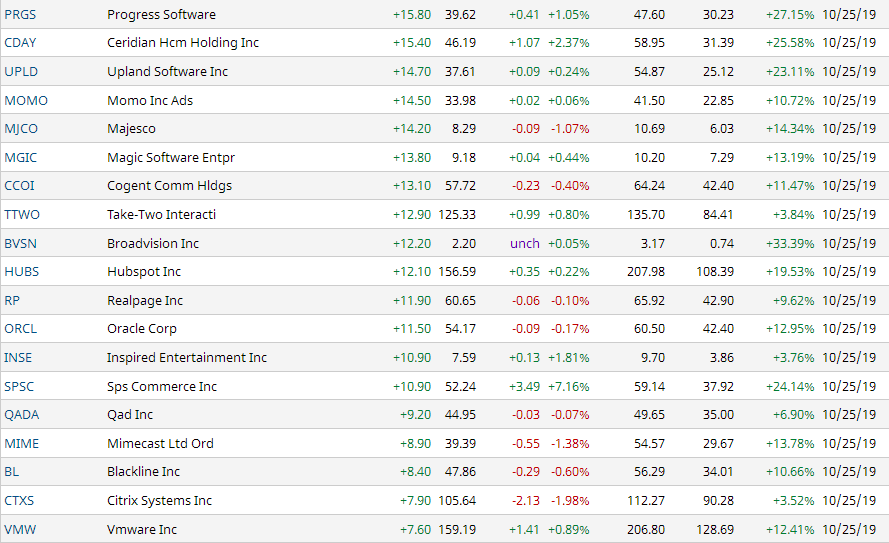
The business it is now in is one of the most competitive out
there with more than a score of competing companies, but this
one has stock performing at the top of the heap. It has
acquired several billion dollar major customers like banks, and
some analyst view it as a prime candidate for a buyout or merger
from another corporation.
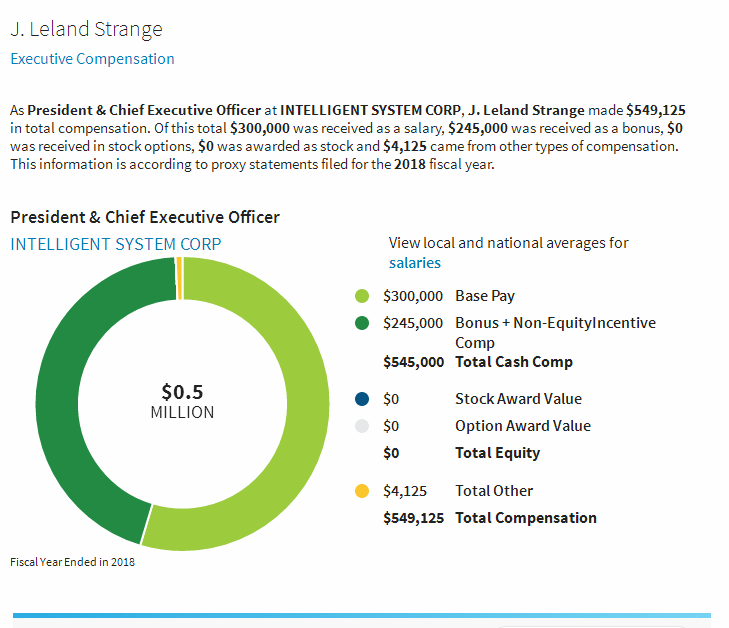
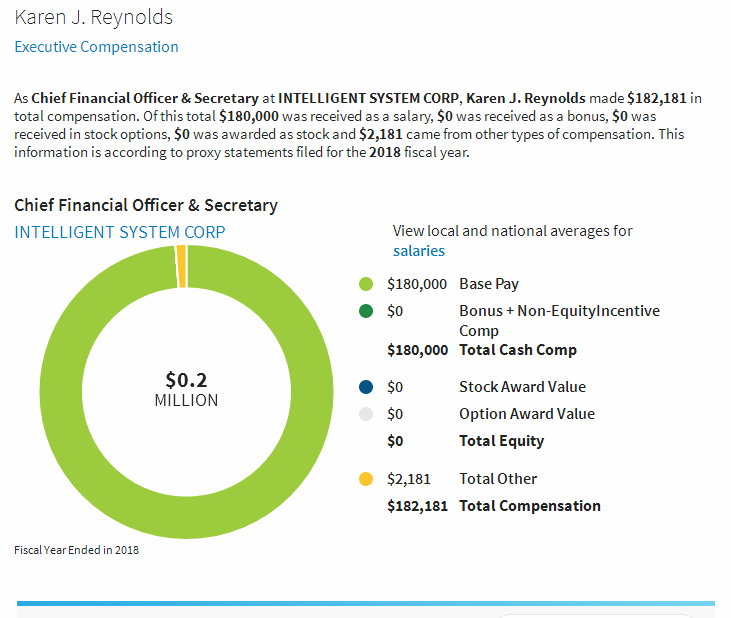
Executives are exceptionally modestly compensated. The balance
sheet looks good to us, the company has a very high Zenith
Index, but we question some of the company reporting. So do a
slew of attornies currently engaging in a class-action lawsuit
claiming company officers misrepresented prospects in a recent study.
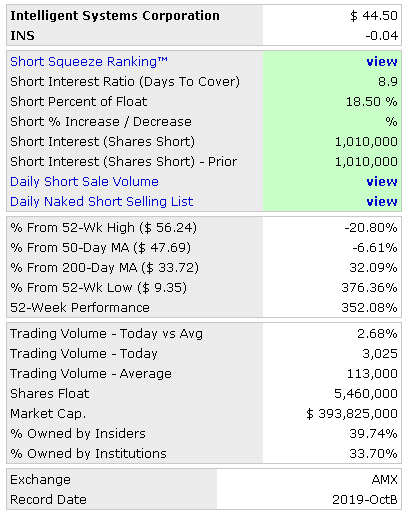
Holding this comany back from getting one of our top ratings is
a slew of technical indicators or chart pattern which indicates
toppiness and possible correction coming. We are already seeing
some signs of it in multiple tops. Standard & Poor's gives the
corporation its highest recommendations except for one category,
"Financial Health." How they come up with that exception is
unclear and disagrees with data we see elsewhere, but S&P has
been known to go its own way against other researchers,
sometimes on stocks that have subsequently performed very well.
Some research we normally use on this stock is somewhat hard to
find but apparently researchers are neutral to slightly
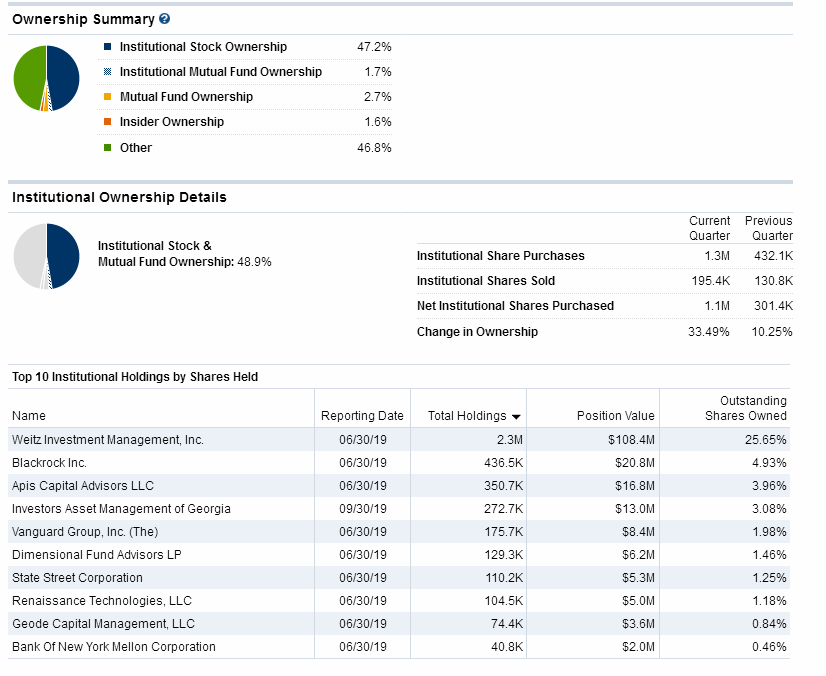
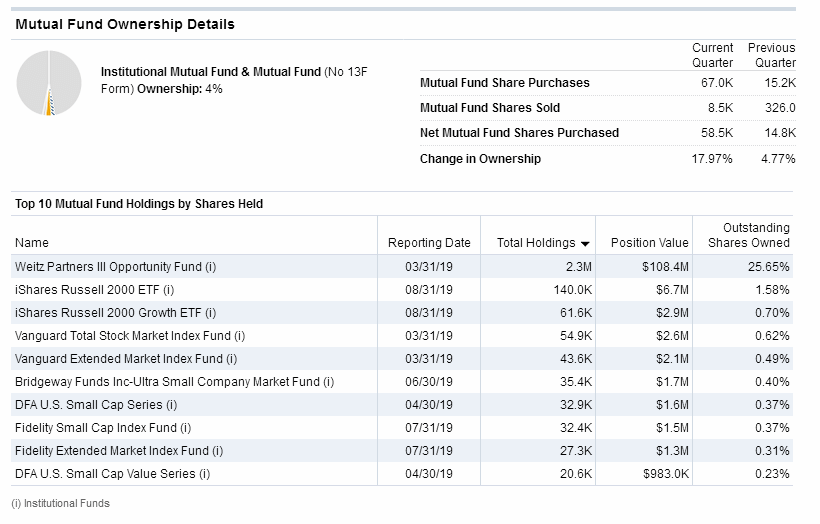
positive, while one analyst is very positive. Institutions are
net acquirers and seeing some further potential.
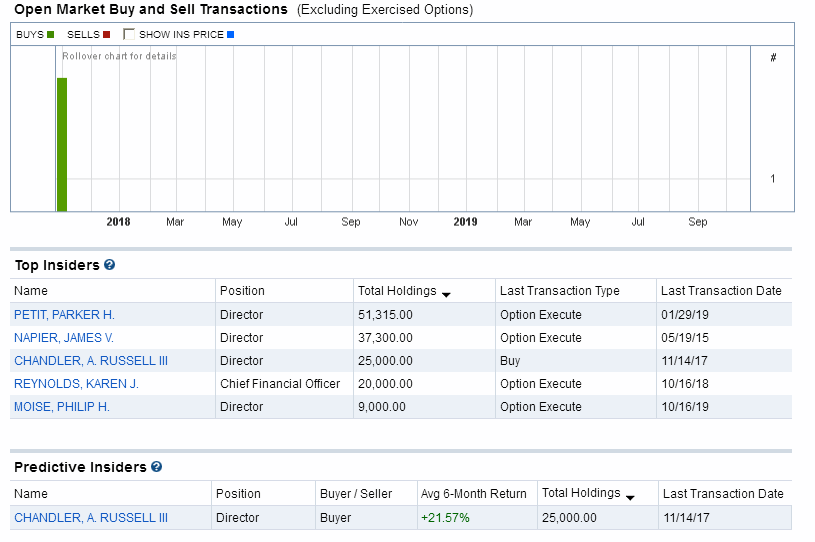
We also note the absence of stock options and stock option
perquisites, which for a company this size (average trading
volume) could be a very good sign. We would rate insider
activity as positive if for no other reason than the absence of
it recently, with officers holding significant shares.
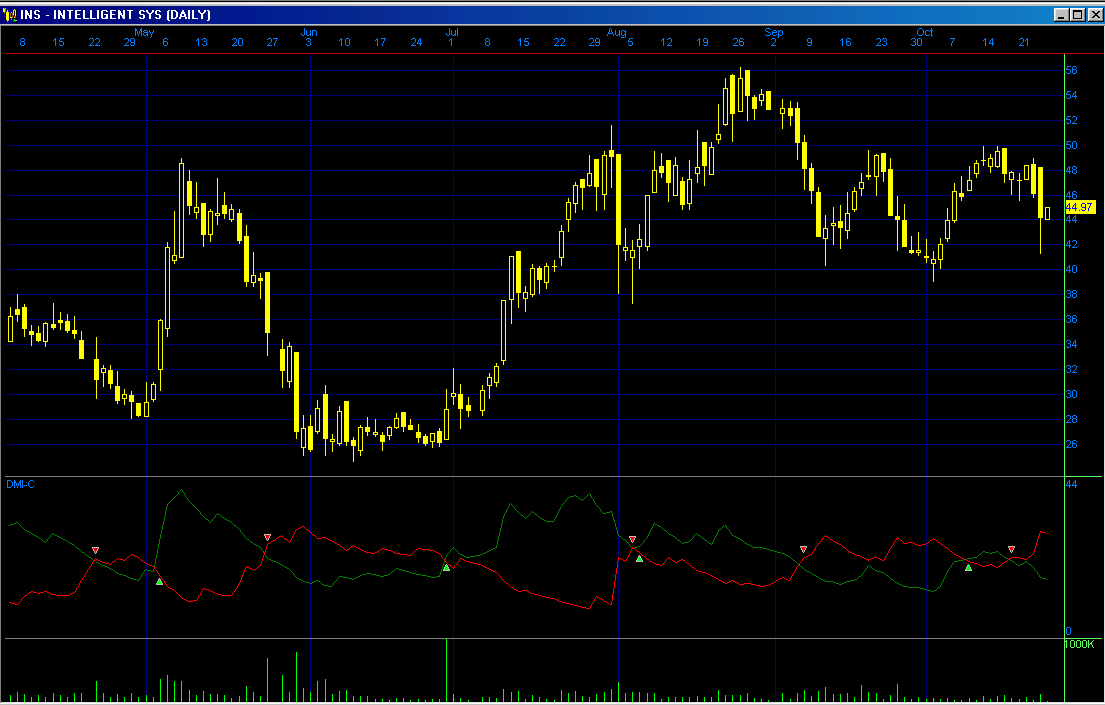
This stock can definitely be traded in ranges, showing
oscillatory characteristics, although in the long haul it
definitely appears more as a buy and hold stock.
(WAIT FOR PAGE TO LOAD COMPLETELY BEFORE LINKS WORK.)
Company Profile
News
Comparison with Peers
Bond Issue
Zenith Index
Financial Statements
Avg. P/E to Current P/E
Financial Ratios
Intrinsic Value (Disc. CashFlow)
Fair Value Estimator
Projected Earnings
Research Reports
Analysts' Opinions
Insider Activity
Institutional Activity
Sentiment
Short Interest
Standard & Poor's
Management's Discussion
Channel Potential
MACD Histogram
Intraday Chart
Val Idea
Stock Consultant
Point & Figure Chart
Wall Street Analyzer
Marketspace Chart
Time Series Forecast
Neural Network Prediction
Stock Options
Ultimate Trading Systems
Recommendation




Company Profile |

News |
Comparison |
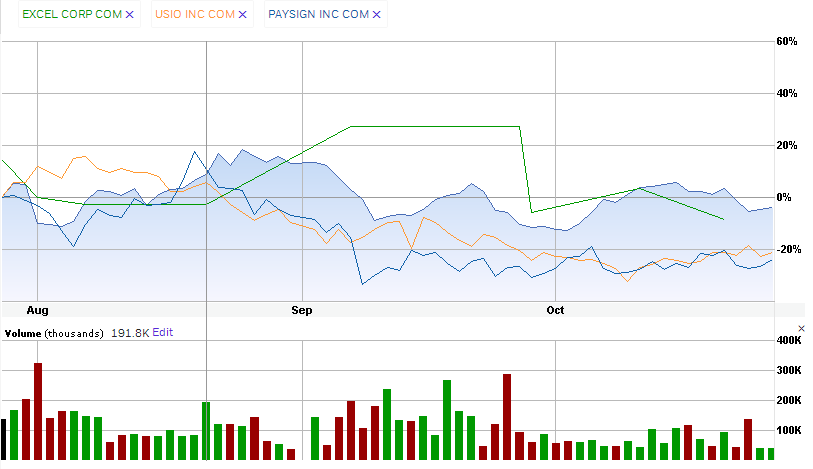
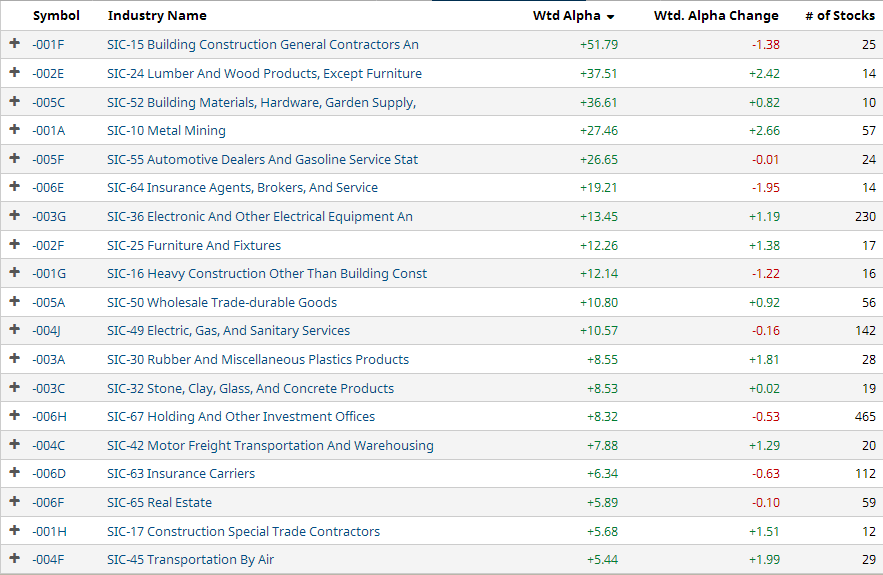
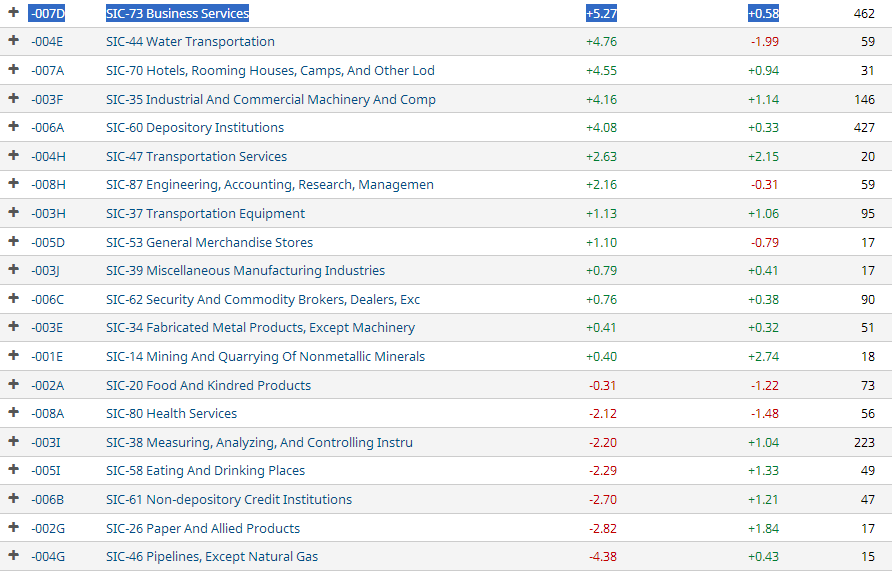
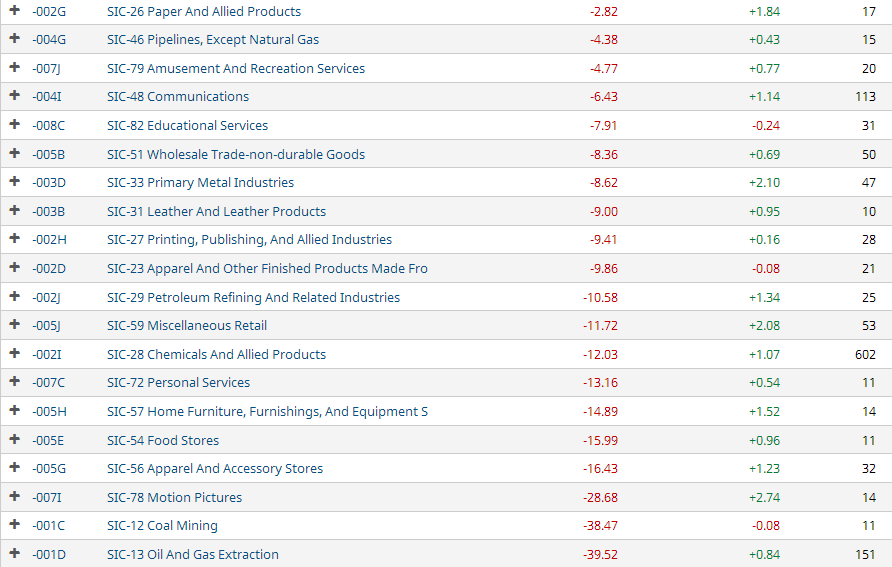
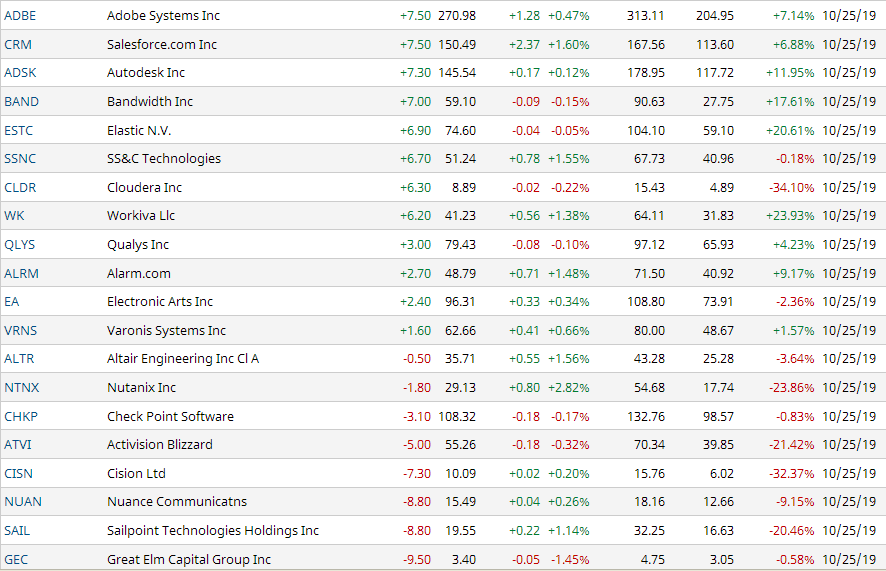

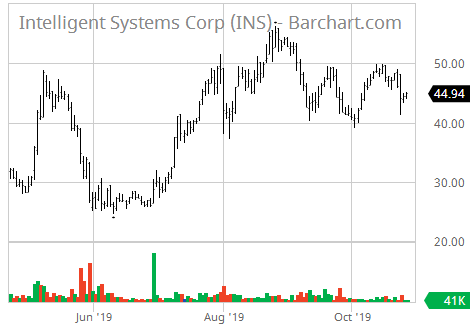
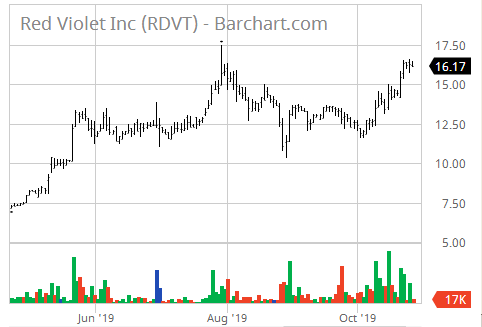
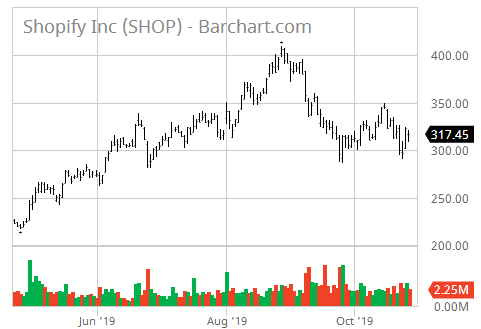
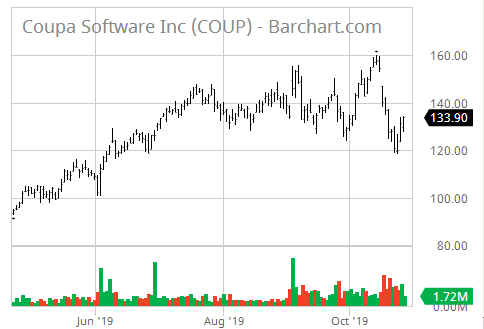
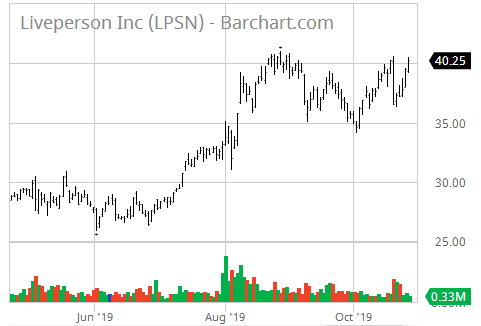
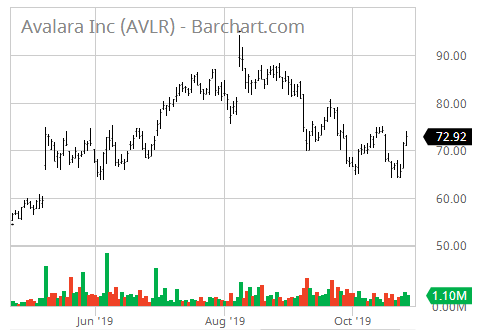
Similar Companies Performance:
Bond Issue |

Zenith Index |
Under current market conditions, a Zenith Index Score of 1.20 or above is required for a positive rating on this factor. 1.21 -1.30 is considered acceptable, 1.30-1.40 is considered strong and
> 1.40 is considered exceptionally strong. Accounting statements in this section often contain mistakes, especially in earlier years' totals, but data is deemed sufficient for us to give a rating. More accurate financial statements follow in the next section.
Intelligent Systems Corporation (INS)                     Exchange: NYSE A
4355 Shackleford Road
Norcross, GA 30093               Sector: Technology
United States                    Industry: Software - Infrastructure

Intelligent Systems Corporation, through its subsidiary, CoreCard
Software, Inc., provides technology solutions and processing services to
the financial technology and services market in the United States and
European Union. The company designs, develops, and markets a suite of
software solutions to accounts receivable businesses, financial
institutions, retailers, and processors. Its software solutions allow
companies to offer various types of debit and credit cards, as well as
installment and revolving loans; to set up and maintain account data; to
record advances and payments; to assess fees, interests, and other
charges; to resolve disputes and chargebacks; to manage collections of
accounts receivable; to generate reports; and to settle transactions
with financial institutions and network associations. The software also
allows managing prepaid cards, private label cards, fleet cards, bank
cards, and loyalty programs. The company's CoreCard software platform
and modules include CoreENGINE, CoreISSUE, CoreFraud, CoreCOLLECT,
CoreAPP, COREMONEY, and CoreACQUIRE. Intelligent Systems Corporation was
founded in 1973 and is headquartered in Norcross, Georgia.

Last Trade:  44.54                           52-Week Range:  56.24 -   9.35
Employees: 430                               Avg.Volume:     103,676 Shares

Corporate Governance:
Pillar scores are Audit: 5; Board: 10; Shareholder Rights: 4; Compensation: 6.
         (A lower number means less governance risk.)

EPS:  0.94    Dividend Amount: $ 0.00          Yield:  0.00%
             Ex-Dividend Date: Jan 26, 2016    Payout Ratio:   0.00

Key Statistics:

    Trailing P/E:  47.55              Forward P/E (est.):  35.44
                                           Target Price:  55.00

Qrtly Stock Price Growth (yoy): 350.81%               Beta:   2.05
Qrtly S&P Index   Growth (yoy):  64.30%        Short Ratio:   7.42%
    Qrtly Revenue Growth (yoy):  52.00%         Shares Out:  8850000
   Qrtly Earnings Growth (yoy):  99.20%

          Book Value:   3.41                    Debt/Equity:   3.68%
    Price/Book Value:  13.08        Operating Profit Margin:  35.48%
         Price/Sales:  15.23                  Profit Margin:  32.65%
         Market Cap:     395,221,000       Return on Equity:  32.80%
    Enterprise Value:     396,640,000      Return on Assets:  19.11%

    Operating Cash Flow:          6,656
         Free Cash Flow:          4,645

Annual Income Statement:                          (All numbers in thousands)
  Period Ending                             12/31/2018  12/31/2017  12/31/2016

  Total Revenue                                 20,100       9,302       8,178
  Cost of Revenue                                8,524       4,495       3,978
  Gross Profit                                  11,576       4,807       4,200

Operating Expenses:
  Research & Development                         3,353       4,367       2,740
  Selling, General & Administrative              2,081       1,843       2,147
  Total Operating Expenses                       5,434       6,210       4,887

Operating Income or Loss                         6,142      -1,403        -687

Income from Continuing Operations:
  Total Other Income/Expenses Net                  106       1,904        -565
  Interest Expense                                   0           0           0
  Income Before Taxes                            6,248         501      -1,252
  Income Tax Expense                                 4          28          -3

Net Income from Continuing Op.s                  6,244         473      -1,249

Non-recurring Events:
  Extraordinary Items                                0           0        -137
  Net Income                                     6,244         473      -1,112

Net Income Avail to Common Shares                6,244         473      -1,112


Annual Cash Flow Statement:                   (All numbers in thousands)
  Period Ending                         12/31/2018    12/31/2017    12/31/2016

  Net Income                                 6,244           473        -1,249

Operating Activities:
  Depreciation                                 614           330           248
  Changes in Accounts Recv'bls              -2,523           121          -367
  Changes in Liabilities                     5,791        -3,361        -1,690
  Changes in Inventories                         0             0             0
  Changes in other Oper'g Acts                -313        -1,612        -1,081

Total Cash Flow f Operations                 6,656        -2,467        -1,377

Investing Activities:
  Capital Exenditures                         -865          -894          -313
  Investments                                    0        -1,000           -50
  Other Cash Flows fr Investing             -1,035        -1,250             0

Total Cash Flows from Investing             -1,900        -1,208         4,085

Financing Activities:
  Dividends Paid                                 0             0        -3,056
  Sale of Purchase of Stock                      0             0             0
  Other Cash Flows fr Financing                  0             0             0

Total Cash Flows from Financing                111             0        -3,042

Change in Cash & Cash Equiv.                 4,895        -3,700          -335


Annual Balance Sheets:                              (All Numbers in Thousands)
  Period Ending                          12/31/2018    12/31/2017    12/31/2016
Current Assets:
  Cash & Cash Equivalents                    14,024        17,724        18,059
  Short Term Investments                        438           418           396
  Net Receivables                             1,208         1,329           962
  Inventory                                       0             0             0
  Other Current Assets                        2,373         1,160         2,846
  Total Current Assets                       18,059        20,631        24,463

  Long-Term Investments                       2,980         2,158         2,941
  Property, Plant & Equipt                    1,262           700           636
  Goodwill                                        0             0             0
  Intangible Assets                               0             0             0
  Other Assets                                  173           101            59

Total Assets                                 21,779        22,704        26,173

Current Liabilities:
  Accounts Payable                              321           301            78
  Current Portion LT Debt                       693           558           520
  Other Current Liabilities                     408         1,338           363
  Total Current Liabilities                   2,275         3,671          2,791

  Long Term Debt                                  0             0             0
  Other Liabilities                               0            18            18

Total Liabilities                             2,326         3,774         3,004

Stockholder Equity:
  Common Stock                                   88            87            87
  Retained Earnings                           4,631         4,158         5,270
  Capital Surplus                              -143          -163          -184
  Total Stockholder Equity                   19,453        21,946        26,048


Intelligent Systems Corporation (INS)       [Indices near +3.0, near zero,
                                            or < zero bear special attention.]
P/E Ratio Tests:
P/E Ratio < 28?            0.5889          P/E Ratio > 5?             1.0000
P/E Ratio Vs Growth Rate:  3.0000          Forward P/E Ratio < 28?    0.7901
Price/Sales Ratio < 2.3?   0.1510          Inventory/Sales < 5%?      1.0000
Sales < $1 Billion?        3.0000          Operating Margin < 7.5%?   0.2114

Balance Sheet Tests:
Debt/Equity < 0.40?        3.0000          Long-Term Debt Service:    3.0000
LTD Being Reduced?         0.0000          Short-Term Debt Service:   3.0000
Current Ratio > 2?         3.0000          Working Capital >= 1.5?    0.1915
Leverage Ratio < 20%?      3.0000          Debt/Assets < 1?           3.0000
Quick Ratio > 1?           3.0000          Inventory Turnover > 1?    1.0000
Share Equity Increase:     1.7289          Market Cap.< 1.5 Billion?  3.0000
                                           Intangibles < 3% Assets?   3.0000
Income Tests:
Profit Margin < 7.5%?      3.0000          EPS Annual Growth > 10%?   0.0076
Dividend Yield > 2.0%?     0.0000          EPS 3-yr Growth > 15?     -0.0267
Enterprise Value/Revenue   3.0000          EPS Growth Consistent?     2.0000
Enterprise Value/EBITDA:   3.0000          Collection < 45 days?      2.0514
EPS Qrtly Growth > 10%?    0.0010          Gross Pft/Cur. LTD > 1?    3.0000
                                           Borrowing Int. Rate < 6%?  3.0000
Stock Performance Tests:
Volatility > 25%?          3.0000          % Held by Insiders < 5%?   0.1258
Beta > 1.25?               1.6400          % Held by Institut. < 50?  1.4837
50 Da MA > 200 Da MA?      0.3745          % Held by Institut. > 30?  1.1233
52-Wk Change vs. S&P 500:  3.0000          Short Ratio > 5?           1.4840
Price/Book Value < 3?      3.0000          Short % of Float > 20?     1.1225
Return on Assets > 17%?    1.1241          Average Volume > 100,000?  1.0368

Cash Flow Tests:
Oper. C.F. > Lever'd C.F:  1.4329          Positive Free Cash Flow?   3.0000
Positive Oper. Cash Flow?  3.0000          Price to C.F.Ratio < 14?:  0.3070
                                           Cash Flow / Assets > 10%?  3.0000

INS    Intelligent Systems Corporation     Overall Zenith Index:      1.7949
Financial Statements |
INTELLIGENT SYSTEMS CORP (INS) INCOME STATEMENT Fiscal year ends in December. 2014-12 2015-12 2016-12 2017-12 2018-12 TTM Revenue 14,586,000 4,782,000 8,178,000 9,302,000 20,100,000 25,947,000 Cost of revenue 7,851,000 2,550,000 3,978,000 4,495,000 8,524,000 10,172,000 Gross profit 6,735,000 2,232,000 4,200,000 4,807,000 11,576,000 15,775,000 Operating expenses Research and development 3,207,000 2,877,000 2,740,000 4,367,000 3,353,000 3,750,000 Sales, General and administrative 4,709,000 2,177,000 2,147,000 1,843,000 2,081,000 2,818,000 Total operating expenses 7,916,000 5,054,000 4,887,000 6,210,000 5,434,000 6,568,000 Operating income -1,181,000 -2,822,000 -687,000 -1,403,000 6,142,000 9,207,000 Other income (expense) 179,000 1,356,000 -565,000 1,904,000 106,000 476,000 Income before taxes -1,002,000 -1,466,000 -1,252,000 501,000 6,248,000 9,683,000 Provision for income taxes 53,000 3,000 -3,000 28,000 4,000 1,210,000 Net income from continuing operations -1,055,000 -1,469,000 -1,249,000 473,000 6,244,000 8,473,000 Net income from discontinuing ops 100,000 18,799,000 0 0 0 0 Other 879,000 690,000 137,000 0 0 0 Net income -76,000 18,020,000 -1,112,000 473,000 6,244,000 8,473,000 Net income available to common shareholders -76,000 18,020,000 -1,112,000 473,000 6,244,000 8,473,000 Earnings per share Basic -0.01 2.05 -0.13 0.05 0.71 0.96 Diluted -0.01 2.02 -0.13 0.05 0.70 0.94 Weighted average shares outstanding Basic 8,958,028 8,806,875 8,736,299 8,766,425 8,796,321 8,827,071 Diluted 8,958,028 8,912,109 8,736,299 8,881,814 8,948,518 8,998,474 ____________________________________________________________________________________________________________________________________________ INTELLIGENT SYSTEMS CORP (INS) BALANCE SHEET Fiscal year ends in December. 2014-12 2015-12 2016-12 2017-12 2018-12 Assets Current assets Cash Short-term investments 463,000 396,000 418,000 438,000 349,000 Total cash 3,087,000 18,455,000 18,142,000 14,462,000 19,268,000 Receivables 1,777,000 962,000 1,329,000 1,208,000 3,731,000 Inventories 1,042,000 0 0 0 0 Other current assets 509,000 5,046,000 1,160,000 2,389,000 1,783,000 Total current assets 6,415,000 24,463,000 20,631,000 18,059,000 24,782,000 Non-current assets Property, plant and equipment Gross property, plant and equipment 5,049,000 2,941,000 2,158,000 2,980,000 3,828,000 Accumulated Depreciation -3,980,000 -2,305,000 -1,458,000 -1,718,000 -2,315,000 Net property, plant and equipment 1,069,000 636,000 700,000 1,262,000 1,513,000 Equity and other investments 1,605,000 1,015,000 1,272,000 1,035,000 760,000 Intangible assets 19,000 0 0 0 0 Other long-term assets 97,000 59,000 101,000 1,423,000 2,249,000 Total non-current assets 2,790,000 1,710,000 2,073,000 3,720,000 4,522,000 Total assets 9,205,000 26,173,000 22,704,000 21,779,000 29,304,000 Liabilities and stockholders' equity Liabilities Current liabilities Accounts payable 280,000 78,000 301,000 321,000 272,000 Taxes payable 0 0 0 0 284,000 Accrued liabilities 1,016,000 520,000 558,000 693,000 1,216,000 Deferred revenues 636,000 1,830,000 1,474,000 853,000 781,000 Other current liabilities 274,000 363,000 1,338,000 408,000 719,000 Total current liabilities 2,206,000 2,791,000 3,671,000 2,275,000 3,272,000 Non-current liabilities Deferred revenues 191,000 195,000 85,000 51,000 111,000 Minority interest -2,189,000 -2,879,000 -3,016,000 0 0 Other long-term liabilities 230,000 18,000 18,000 0 0 Total non-current liabilities -1,768,000 -2,666,000 -2,913,000 51,000 111,000 Total liabilities 438,000 125,000 758,000 2,326,000 3,383,000 Stockholders' equity Common stock 90,000 87,000 87,000 88,000 88,000 Additional paid-in capital 21,537,000 20,875,000 17,864,000 14,877,000 15,050,000 Retained earnings -12,750,000 5,270,000 4,158,000 4,631,000 10,875,000 Accumulated other comprehensive income -110,000 -184,000 -163,000 -143,000 -92,000 Total stockholders' equity 8,767,000 26,048,000 21,946,000 19,453,000 25,921,000 Total liabilities and stockholders' equity 9,205,000 26,173,000 22,704,000 21,779,000 29,304,000 ____________________________________________________________________________________________________________________________________________ INTELLIGENT SYSTEMS CORP (INS) Statement of CASH FLOW Fiscal year ends in December. USD. 2014-12 2015-12 2016-12 2017-12 2018-12 TTM Cash Flows From Operating Activities Net income -855,000 -1,469,000 -1,249,000 473,000 6,244,000 8,473,000 Depreciation & amortization 398,000 217,000 248,000 330,000 614,000 789,000 Investments losses (gains) -127,000 1,005,000 750,000 103,000 363,000 0 Deferred income taxes 0 0 0 0 -280,000 0 Stock based compensation 49,000 19,000 31,000 52,000 62,000 116,000 Change in working capital -47,000 -1,852,000 -1,081,000 -1,612,000 -313,000 5,404,000 Accounts receivable 650,000 -461,000 -367,000 121,000 -2,523,000 -671,000 Inventory 64,000 0 0 0 0 0 Accounts payable -192,000 -12,000 223,000 20,000 -49,000 162,000 Accrued liabilities -387,000 -86,000 38,000 135,000 523,000 251,000 Other working capital -182,000 -1,293,000 -975,000 -1,888,000 1,736,000 5,662,000 Other non-cash items 1,000 -175,000 -76,000 -1,813,000 -34,000 -217,000 Net cash provided by operating activities -581,000 -2,255,000 -1,377,000 -2,467,000 6,656,000 14,565,000 Cash Flows From Investing Activities Investments in property, plant, and equipmen -277,000 -272,000 -313,000 -894,000 -865,000 -1,871,000 Acquisitions, net 171,000 -430,000 4,398,000 936,000 0 0 Purchases of investments -132,000 0 0 0 0 0 Other investing activities 0 19,082,000 0 -1,250,000 -1,035,000 -1,575,000 Net cash used for investing activities -238,000 18,380,000 4,085,000 -1,208,000 -1,900,000 -3,446,000 Cash Flows From Financing Activities Common stock repurchased 0 -692,000 0 0 0 0 Dividend paid 0 0 -3,056,000 0 0 0 Other financing activities 0 8,000 14,000 0 111,000 136,000 Net cash provided by (used for) financing 0 -684,000 -3,042,000 0 111,000 136,000 Effect of exchange rate changes 10,000 -6,000 -1,000 -25,000 28,000 -23,000 Net change in cash -809,000 15,435,000 -335,000 -3,700,000 4,895,000 11,232,000 Cash at beginning of period 3,433,000 2,624,000 18,059,000 17,724,000 14,024,000 10,643,000 Cash at end of period 2,624,000 18,059,000 17,724,000 14,024,000 18,919,000 21,875,000 Free Cash Flow Operating cash flow -581,000 -2,255,000 -1,377,000 -2,467,000 6,656,000 14,565,000 Capital expenditure -277,000 -272,000 -313,000 -894,000 -865,000 -1,871,000 Free cash flow -858,000 -2,527,000 -1,690,000 -3,361,000 5,791,000 12,694,000
Average to Current P/E Ratios |
              (INS)     Intelligent Systems Corp.

                               2014    2015    2016    2017    2018

          Annual Earnings:    -0.01   -0.09   -0.13    0.04    0.70
Average Price During Year:     1.57    2.72    3.73    4.27   11.75

                P/E Ratio:   157.08   30.22   28.72  106.73   16.79

 Average 5-Year P/E Ratio  =  67.91
             Current Price =  44.94

Previous 5 Quarter Earnings:   0.12    0.21    0.27    0.23    0.23

          Current Annualized (Last Four Quarters) Earnings =   0.73
                                                           ________
                                 Average PE / Current PE =     1.10
                                                           --------

                                      ...a number above 1.00 is good
                                                1.00 or below is bad
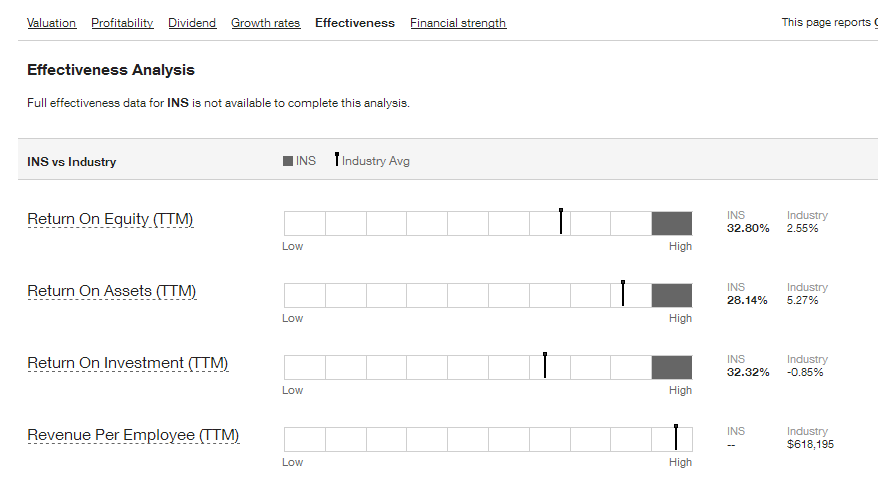
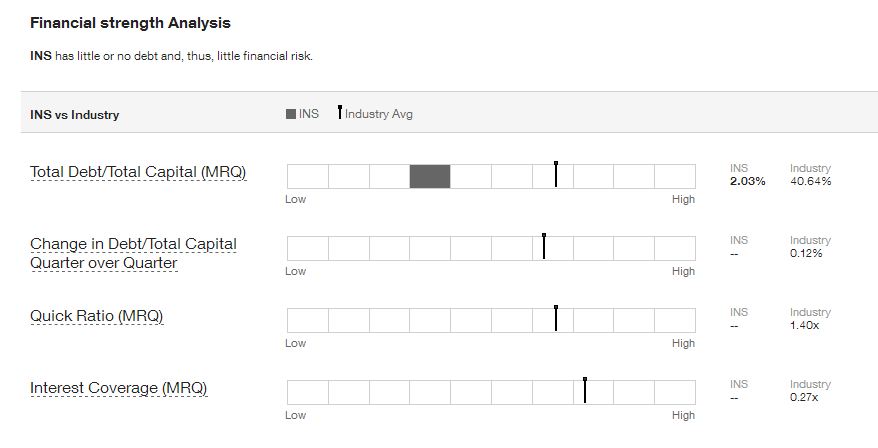
Financial Ratios |
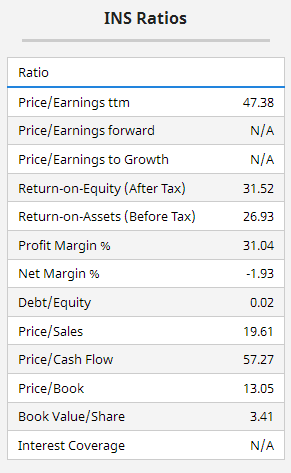
. . . . . . . . . . . . Lowest to Highest, Compared to Industry
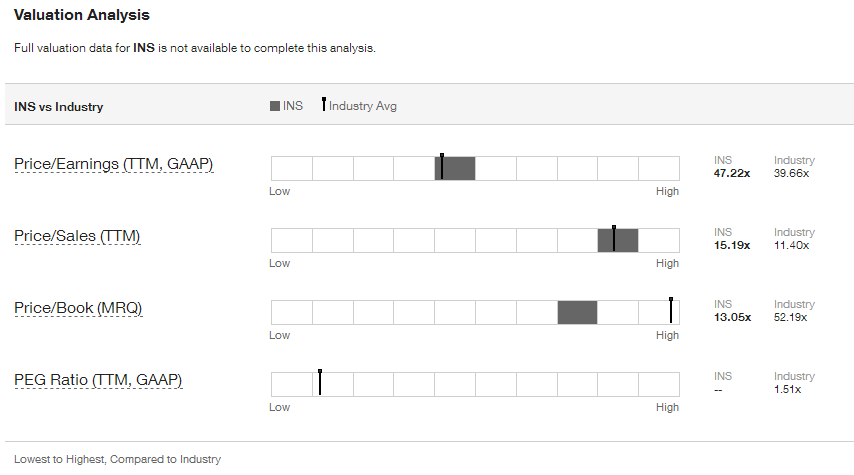
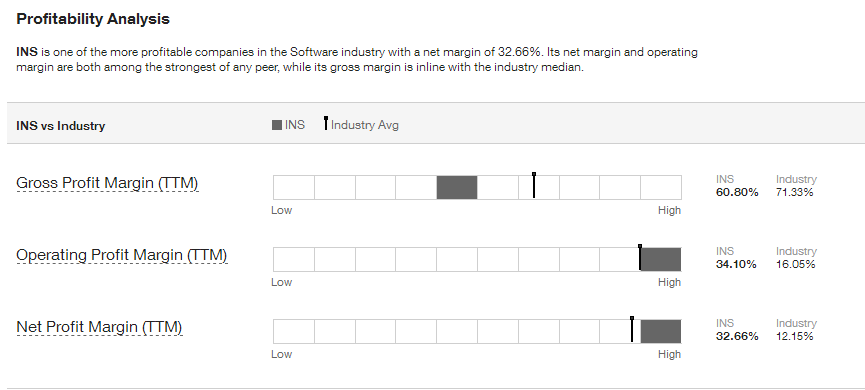
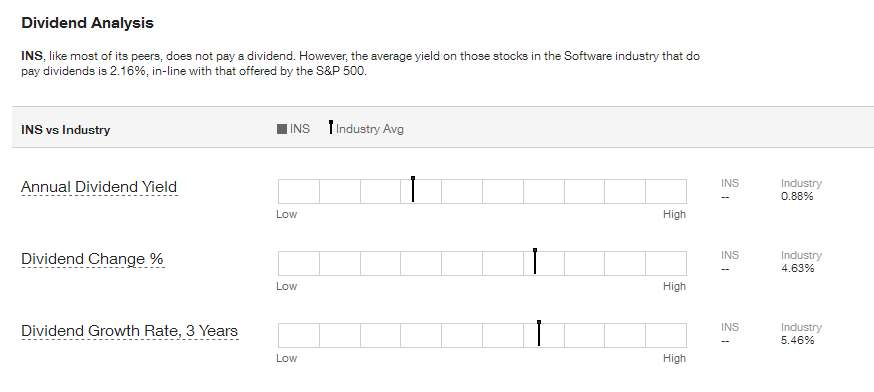
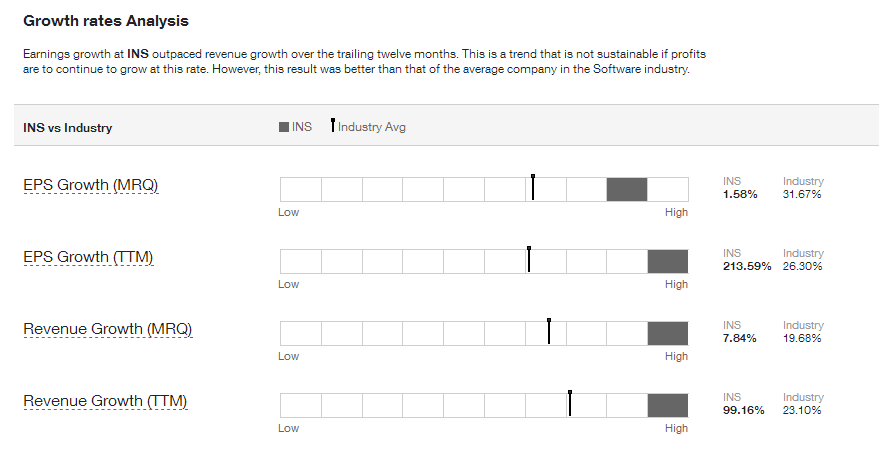
Intrinsic Value (DCF) |
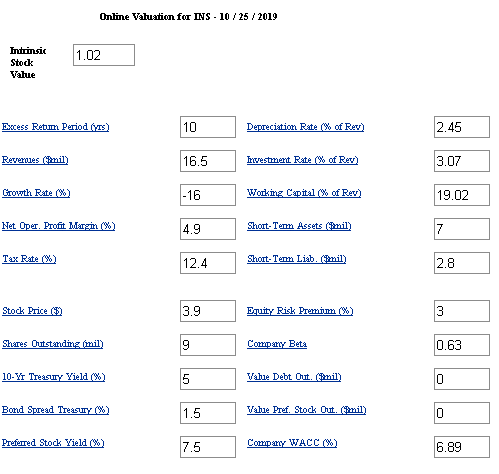
Intrinsic Value by Discounted Cash Flow Method:
Fair Value Estimator |
Fair Value Estimate:

Projected Earnings |

Research Reports |
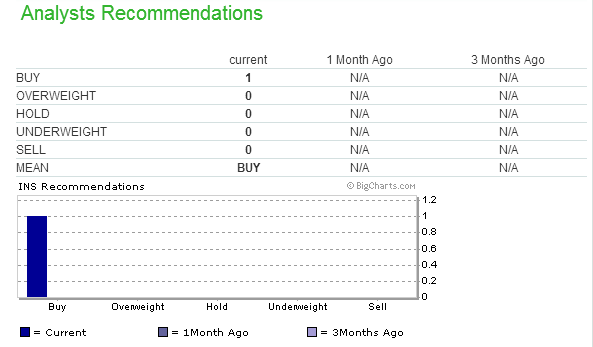
Analysts' Opinions |
Insider Activity |


Institutional Activity |
Institutional Ownership:
Sentiment |
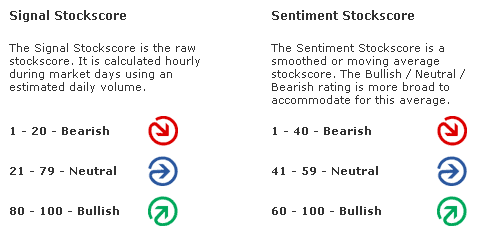
Zenith uses the "sentiment" score above or below 50 to award a positive or negative point in the Decision Matrix.


Short Interest Ratio |
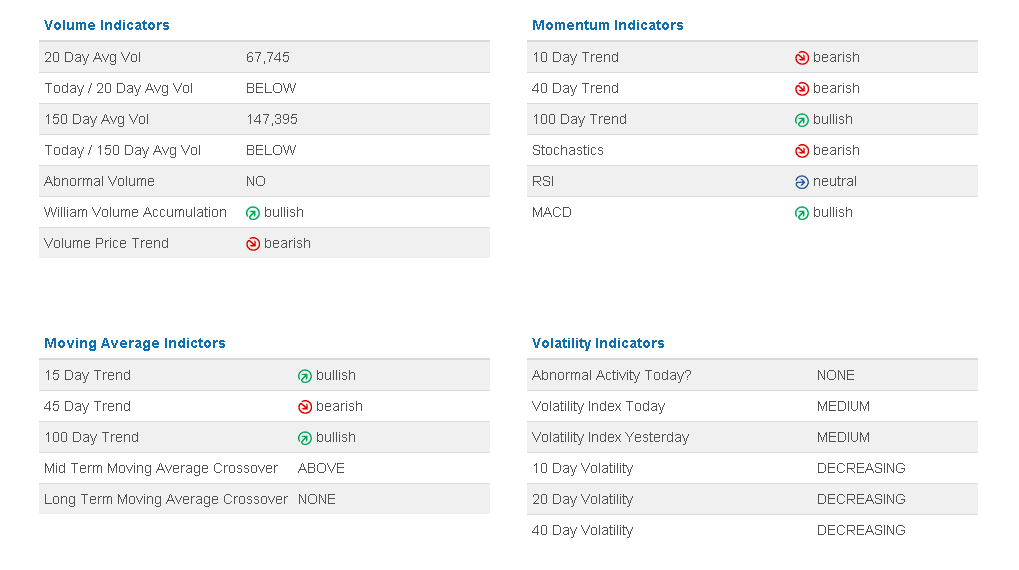
As the short interest rises as a percentage of average daily share volume (Days to Cover), this is considered a measure of negative sentiment. Similarly, a decrease in that percentage is considered positive sentiment.

Standard & Poor's |
Management's Discussion of Results of Operations Excerpts |
Channeling Potential |
The summary below includes a value for `Degree,' which refers on a
scale of 1 to 10 the range of a channel in the period under consi-
deration compared to the total range of price movement. It also looks
for the last closing price to be within the channel, otherwise zeroed.
The `Index' is the `Degree' weighted for volatility.  Generally, the
the higher the index, the more suitable is the stock for trading as
a `rolling stock' between channel high and low points.

Results for INTELLIGENT SYSTEMS CORP.:
Symbol? INS
Total Months Available:  97
       Months in Cycle?   4

Months Covered by Periods:  12

Period 1           Period 2          Period 3
   H1      L1        H2      L2        H3      L3
  26.13    9.35     48.93   17.16     56.24   25.68

RANGE   =  56.24  TO    9.35            Close =  44.97
CHANNEL =  26.13  TO   25.68           Degree =   0
Volatility =   1.00%                    Index =   0
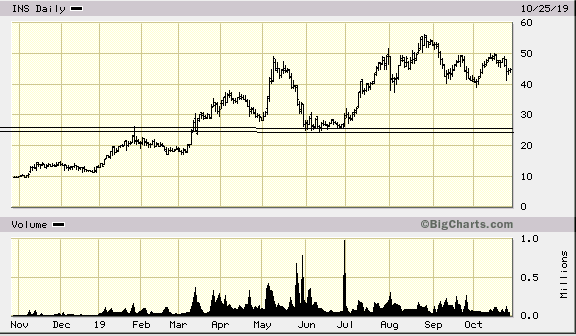
MACD Histogram Divergence |
The theory is that connecting the two most recent peaks or valleys of the MACD histogram will signal the direction of the next major move.
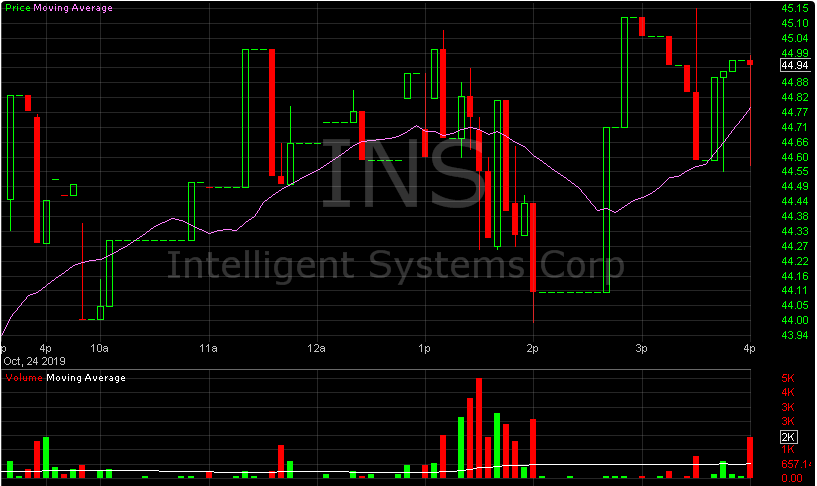
Intraday Chart |
2 Days:
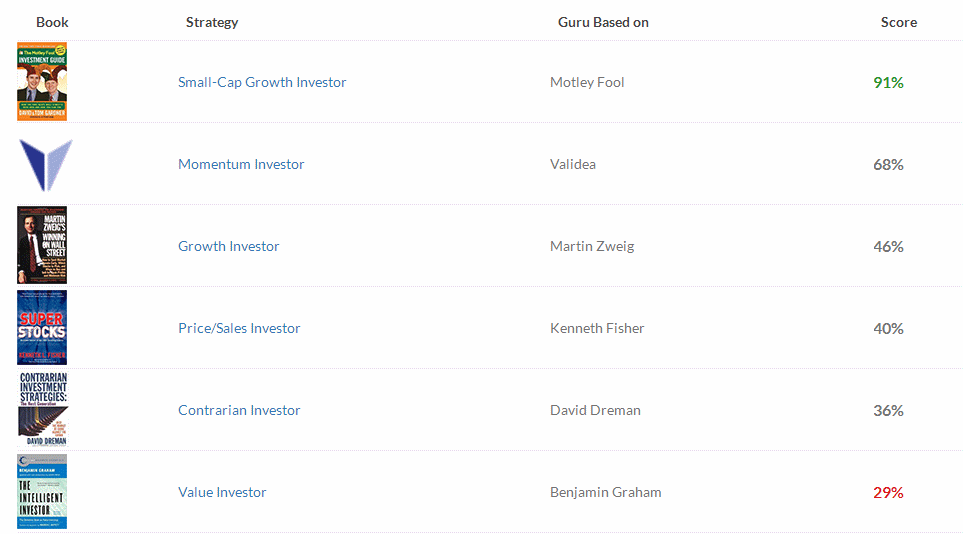
Val Idea |
2 out of 9 favorable, (negative opinion.)

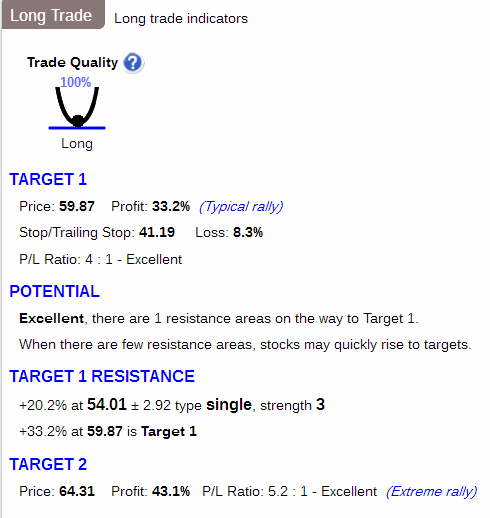
Stock Consultant |
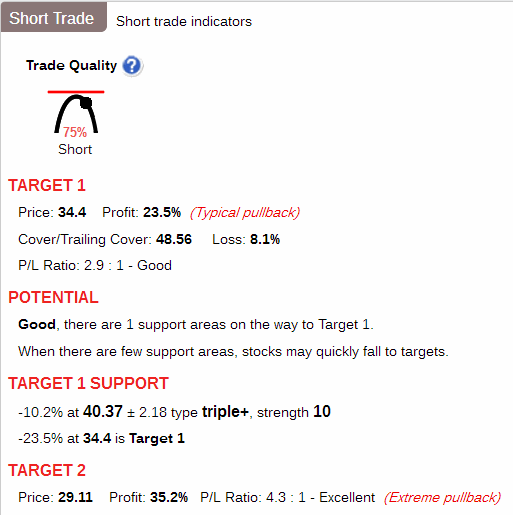
Point & Figure Chart |
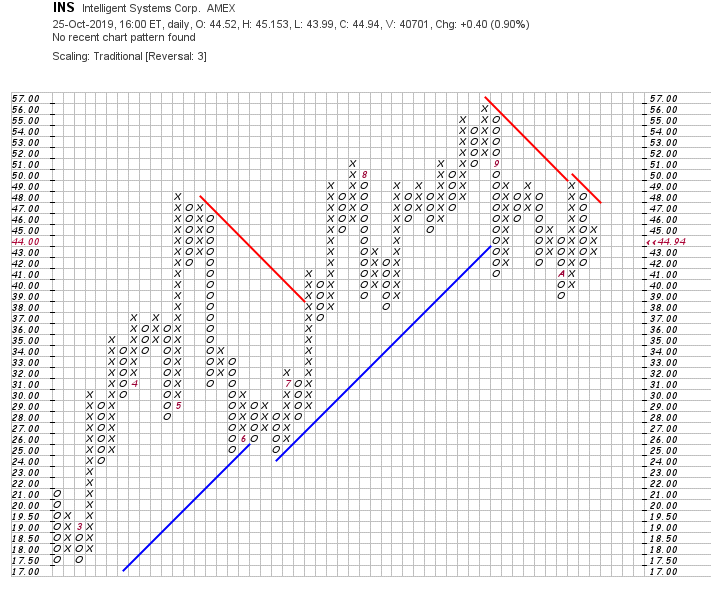
Wall Street Analyzer |
Marketspace Chart |
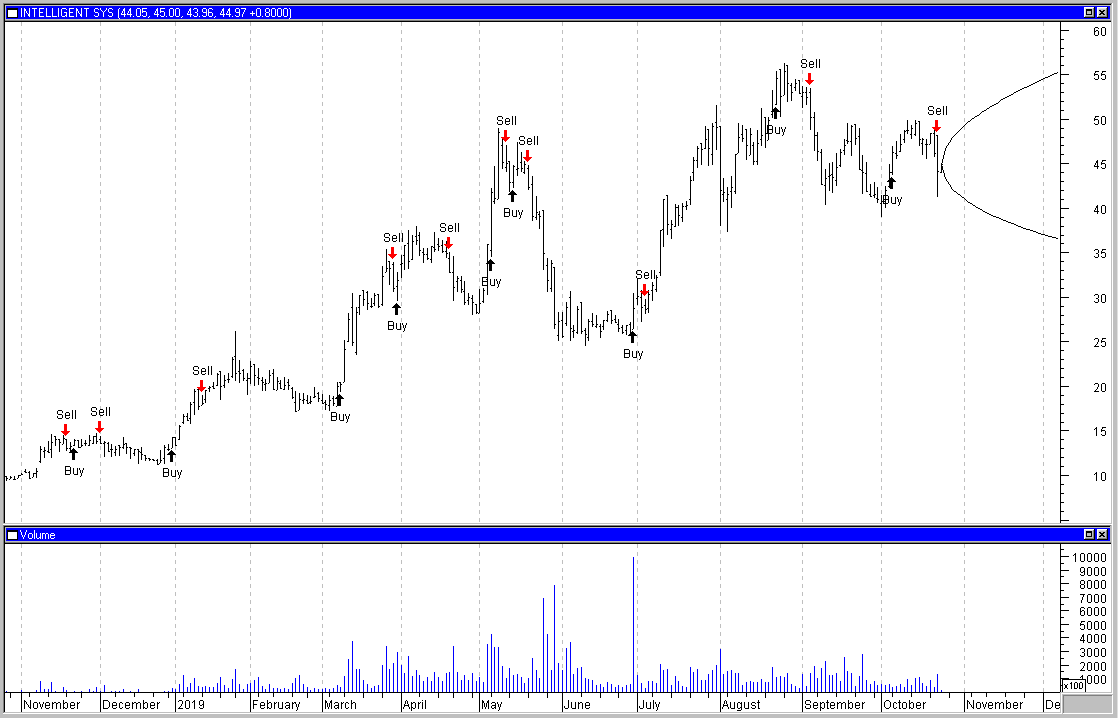
Time Series Forecast |
Neural Network Prediction |
"Neurostock" can only track long trades. Therefore its performance, as tracked by itself on stocks which are consistently falling, may not appear as good as it could if each "sell" signal were a "short sale."

![]()
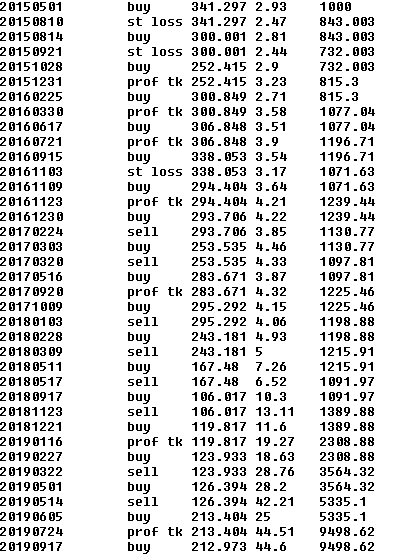

Ultimate Trading Systems |
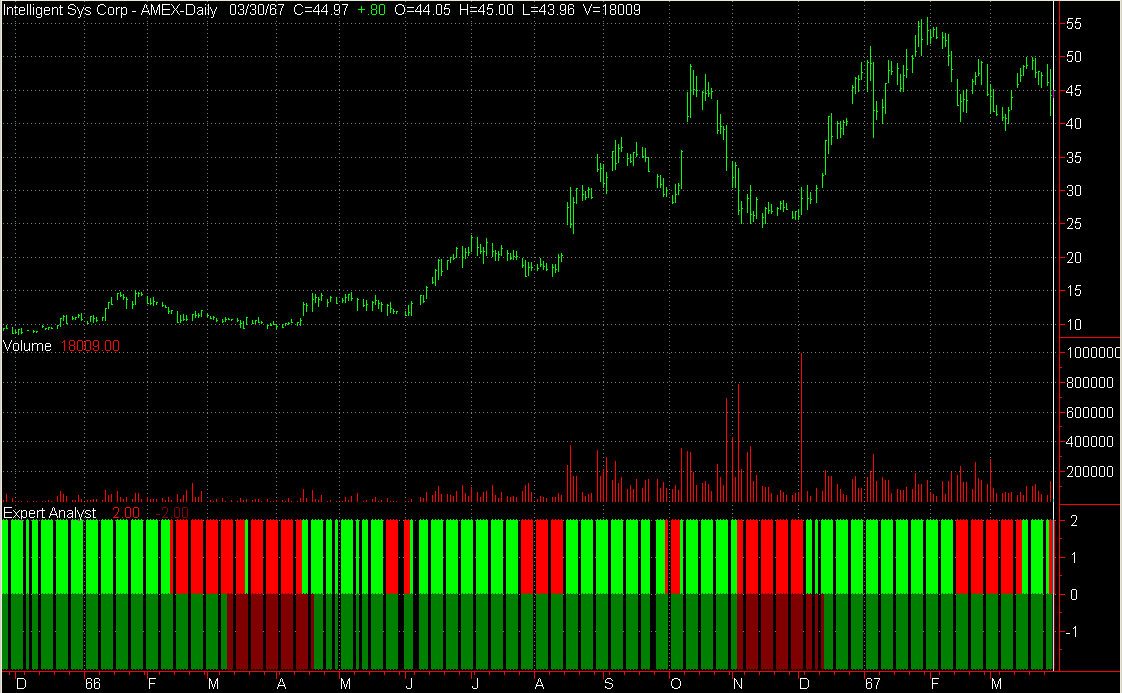
3 out of 3 of the ultimate systems favor a downmove.
System Below:
Short term outlook: Positive: Bright Green, Negative: Bright Red
Long term outlook: Postive: Dark Green, Negative: Dark Red.

Recommendation |
| Factors | Weighted Points |
|---|---|
| News | + 1 |
| Comparison | - 1 |
| Industry | + 1 |
| Bond Issue | 0 |
| Zenith Index | + 1 |
| Non-GAAP vs. GAAP Earnings | - 1 |
| Cash Flow | + 1 |
| Average to Current P/E | + 1 |
| Ratios | + 1 |
| Intrinsic Value DCF | - 1 |
| Fair Value Estimator | - 1 |
| Projected Earnings | + 1 |
| Research Reports | + 1 |
| Analysts | + 1 |
| Executive Perquisites | + 1 |
| Insider Activity | + 1 |
| Institutional Activity | + 1 |
| Management Reporting | + 1 |
| Short Interest | 0 |
| Sentiment | + 1 |
| Standard & Poor's | + 1 |
| MACD Histogram Divergence | + 1 |
| Val Idea | - 1 |
| Stock Consultant | + 1 |
| Point & Figure | + 1 |
| Wall Street Analyzer | + 1 |
| Marketspace Chart | - 1 |
| Time Series Chart | - 1 |
| Neural Network | - 1 |
| Stock Options | - 1 |
| Ultimate Trading Systems | - 1 |
| Total | + 9 |
Place 680 shares of Intelligent Systems, Inc. (INS) on the Active List.