![]()
Corporate Webpages Flowserve Corporation
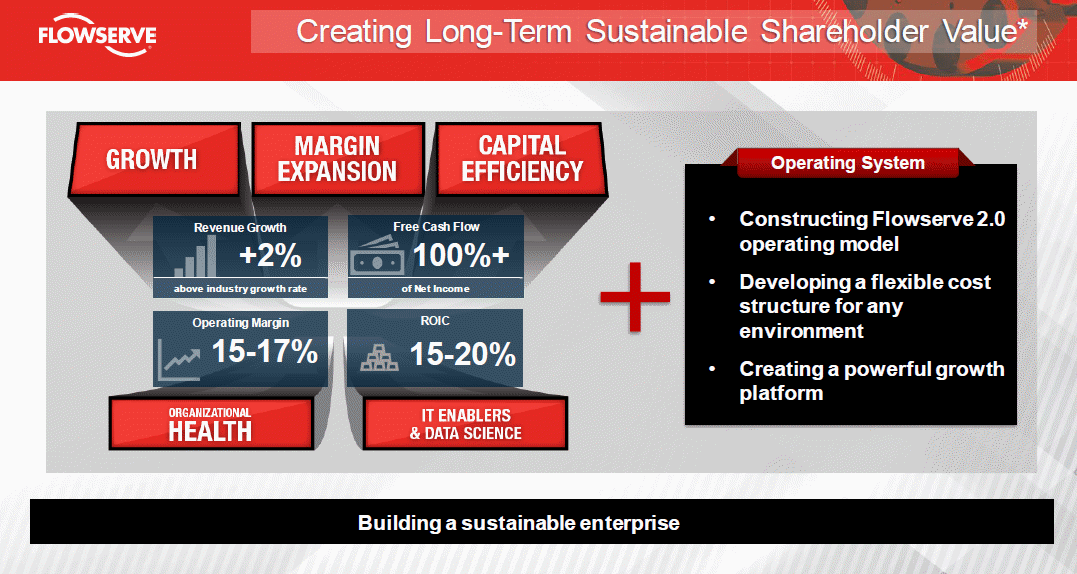
Flowserve Corporation (FLS) is an old-line company that's been
around in one form or another since 1912, but formed under its
present name in 1997 after a large merger. The company
manufactures parts used to control fluids and gasses flow in
various industrial and manufacturing processes. It appears to
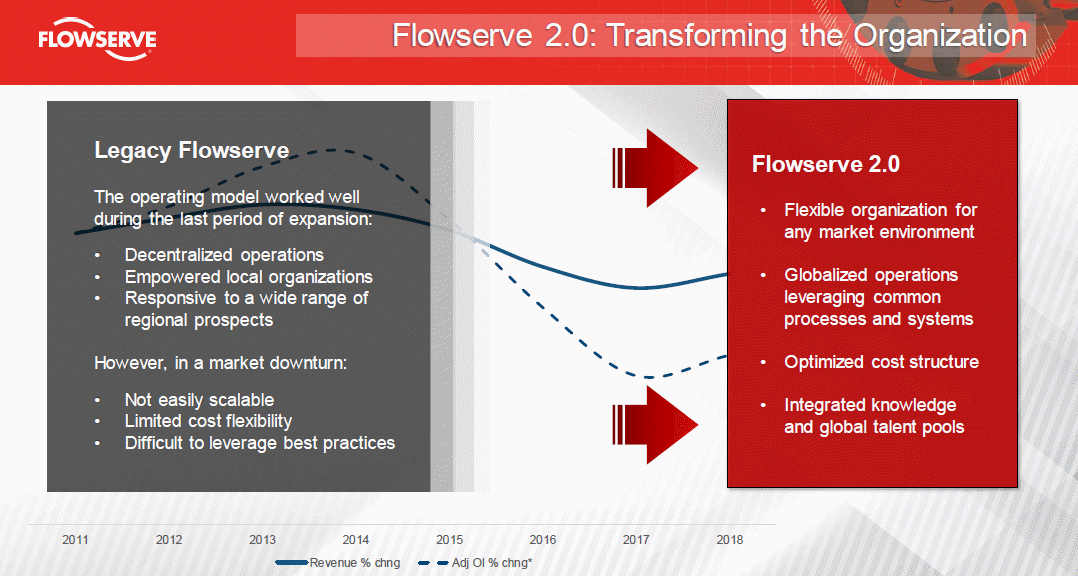
us to get the bulk of its revenues from the oil and gas
industry, which latter has been suffering lately, with reduced
capital expenditures, and impacting FLS profits. However, the
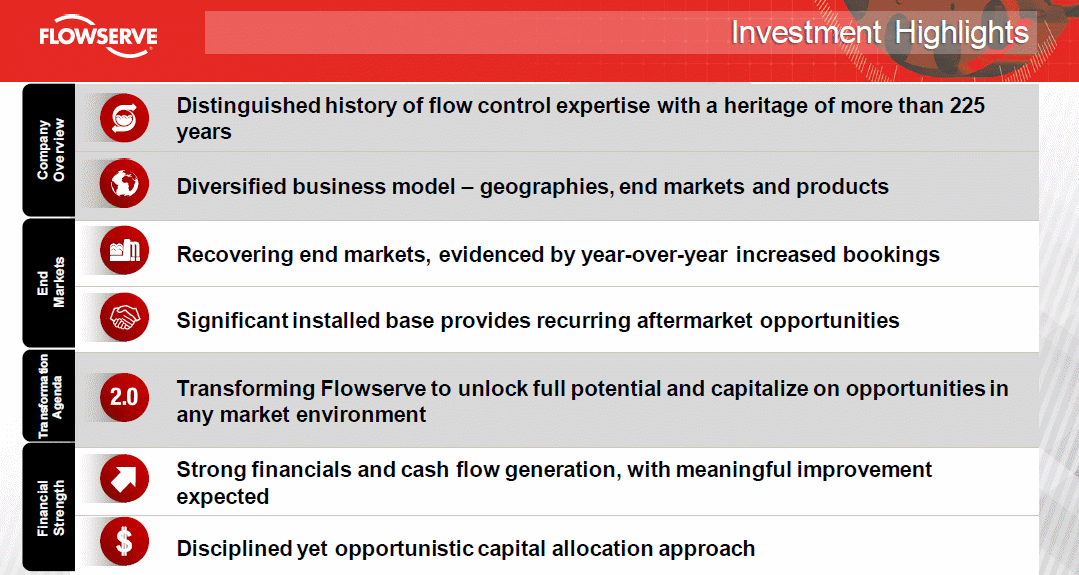
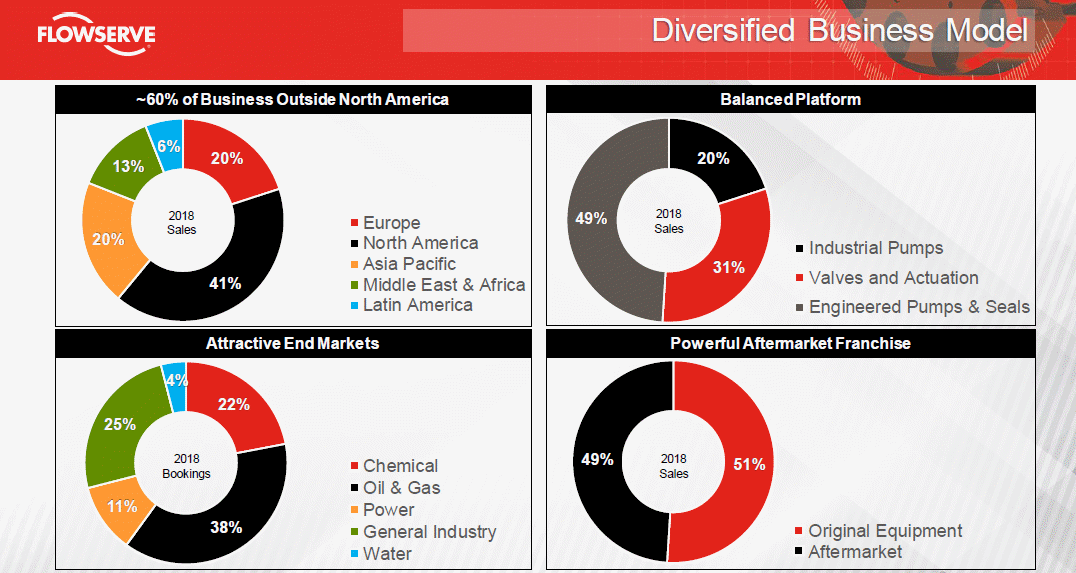
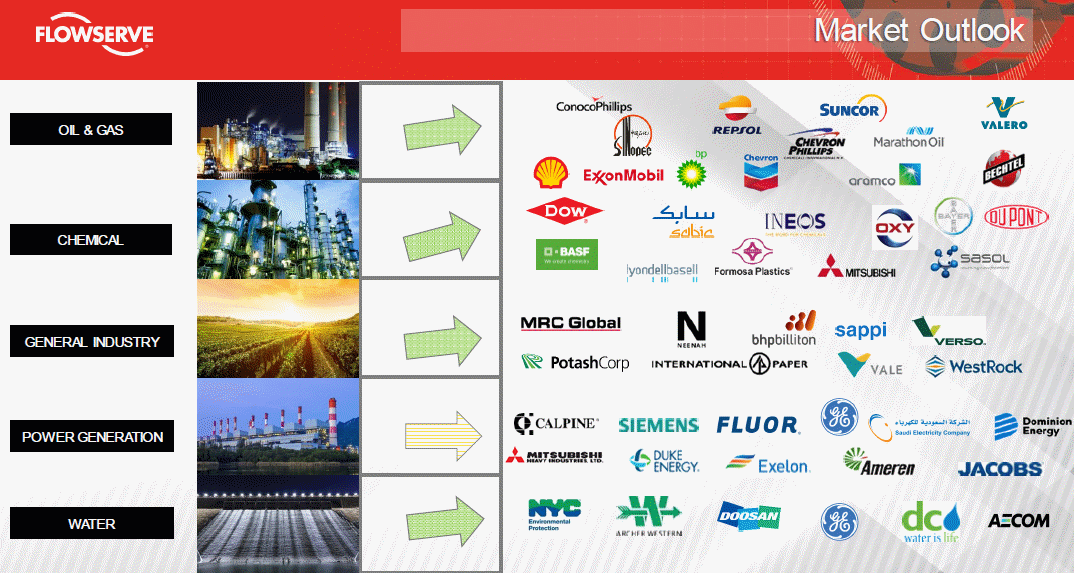
company has a diversified list of clients in other industries,
including water treatment and desalinization plants. Its
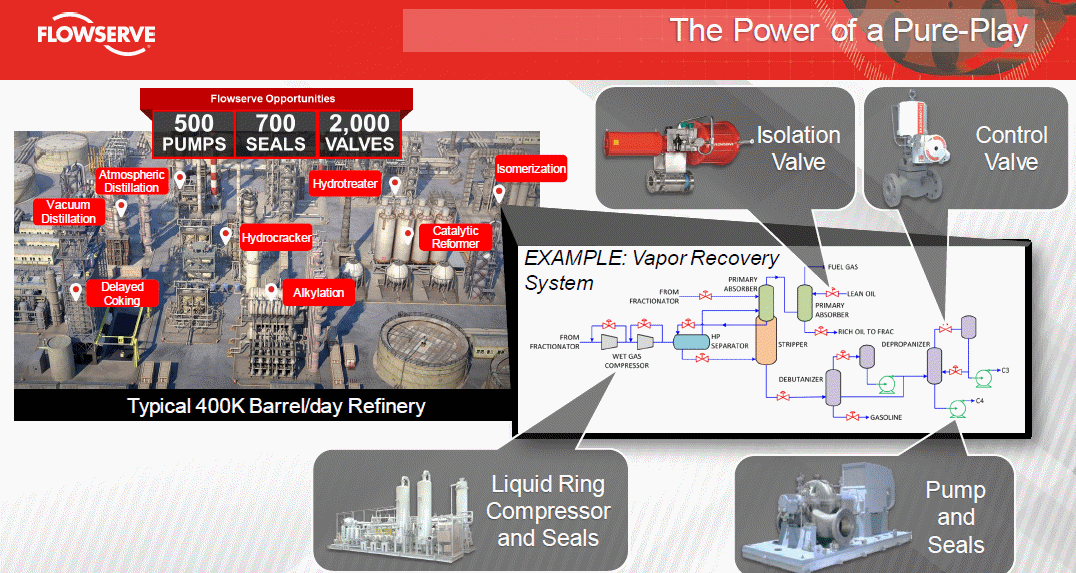
customers include refineries, chemical plants, utilities,
industrial manufacturers, and paper plants to name a few.
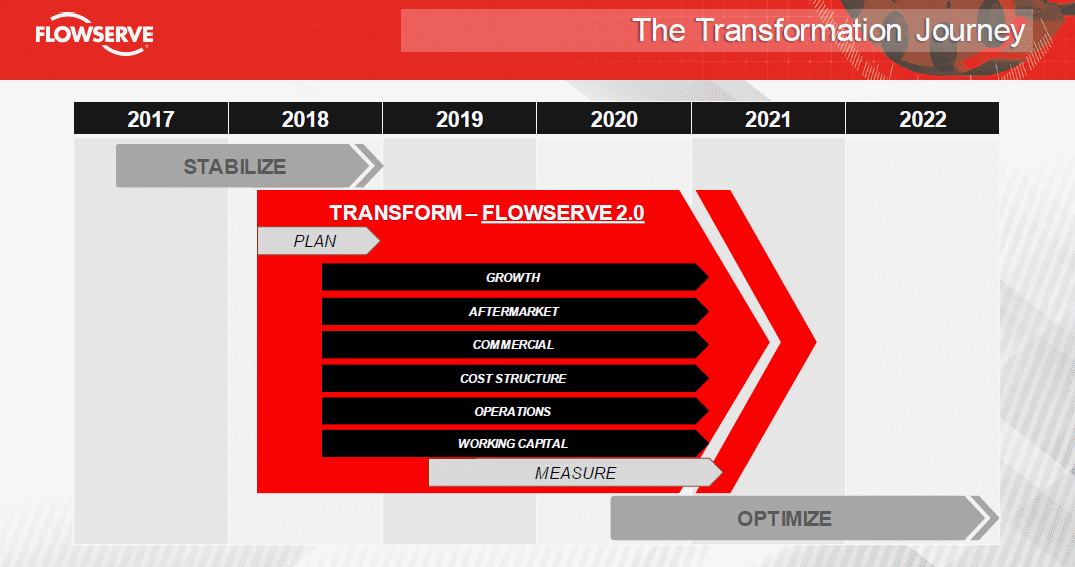
It appears the company has the potential to rebound earnings
after recent bad years, and is a rare case of having a current
p/e ratio well below its average. It has a good website with
CEO Letter to Shareholders, pays a dividend between 1 and 2%
regularly, and appears to us to be well managed with proper reporting.
Because of its relation to oil and gas industry, the stock has
suffered, not participating much in the current stock market
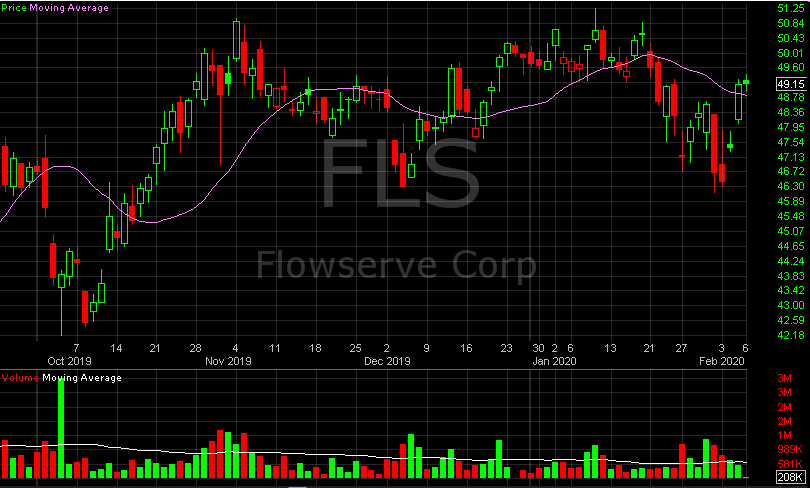
boom. It looks to us like a potential trading range stock,
currently just outside the top of a recent trading range, ready
to break up, or break back down. Recent earnings reports have
exceeded Wall St. expectations. Analysts and particularly
researchers do not favor the stock. Institutions and neutral
but mutual funds are buying.
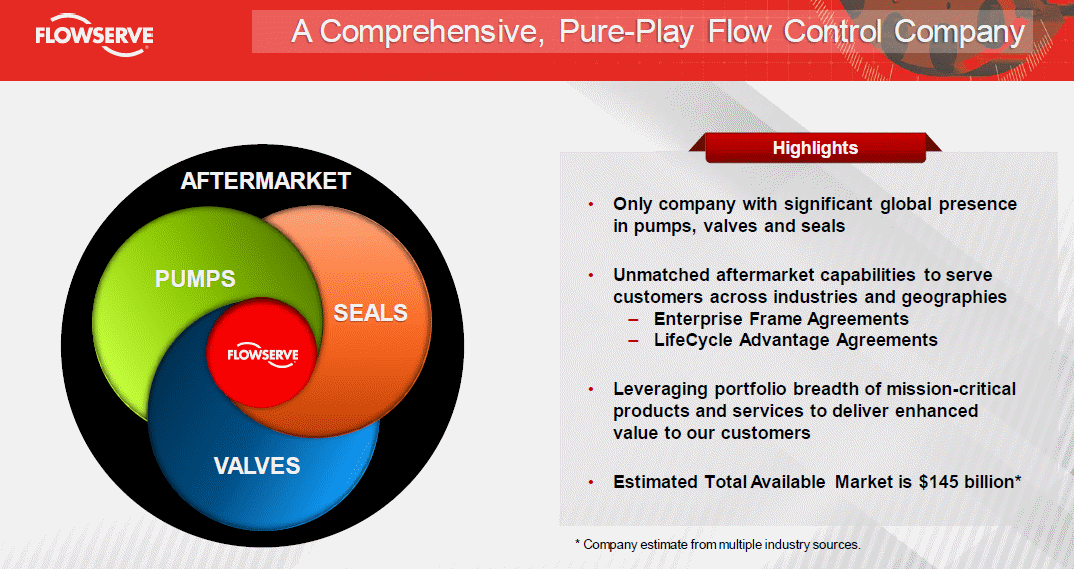
The company describes itself as a "pure play flow control
company." In that sense, it has a LOT of competitors. It has a
large amount of international business especiallly in developing
parts of the world. It maintains subsidiaries in a remarkable
number of world countries on most continents, and is based in Texas.
It has increasing debt and potential cash flow problems giving
it a substandard Zenith Index. That suggests potential
fundamental finance problems. But the company has been around a
long time and is well established. It continues to make acquisitions.
Despite the stock's appearance of a potential large upside
breakout, we would be tempted more to trade it as a channeling
range trading stock, where range-trading opportunities appear to abound in the
competitive flow control machinery industry.
(WAIT FOR PAGE TO LOAD COMPLETELY BEFORE LINKS WORK.)
Company Profile
Company History
News
Comparison with Peers
Bond Issue
Zenith Index
Financial Statements
Avg. P/E to Current P/E
Financial Ratios
Intrinsic Value (Disc. CashFlow)
Fair Value Estimator
Projected Earnings
Research Reports
Analysts' Opinions
Insider Activity
Institutional Activity
Sentiment
Short Interest
Standard & Poor's
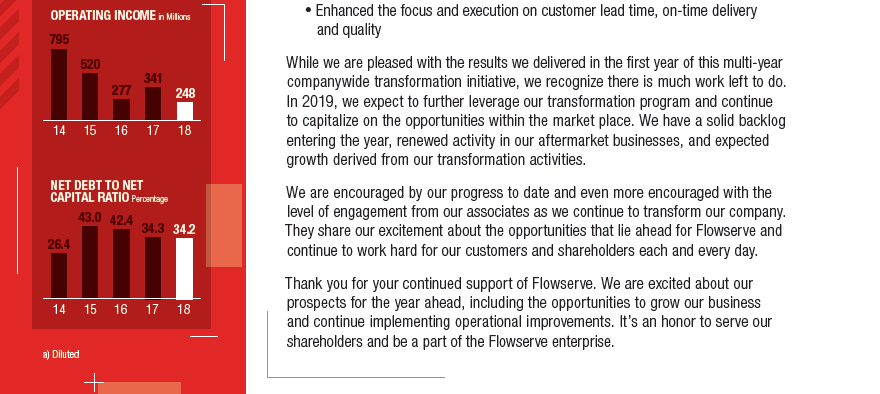
Management's Discussion
Channel Potential
MACD Histogram
Intraday Chart
Val Idea
wpStock Consultant
Point & Figure Chart
Wall Street Analyzer
Marketspace Chart
Time Series Forecast
Neural Network Prediction
Stock Options
Ultimate Trading Systems
Recommendation





Company Profile |

Company History |

News |
Comparison |
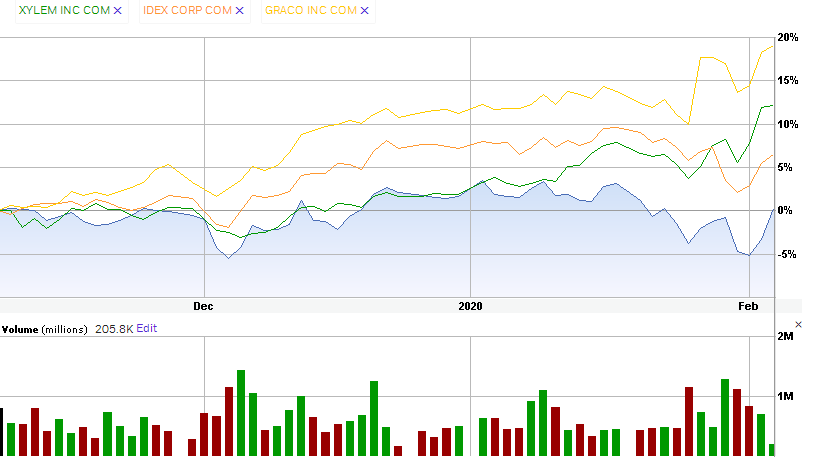
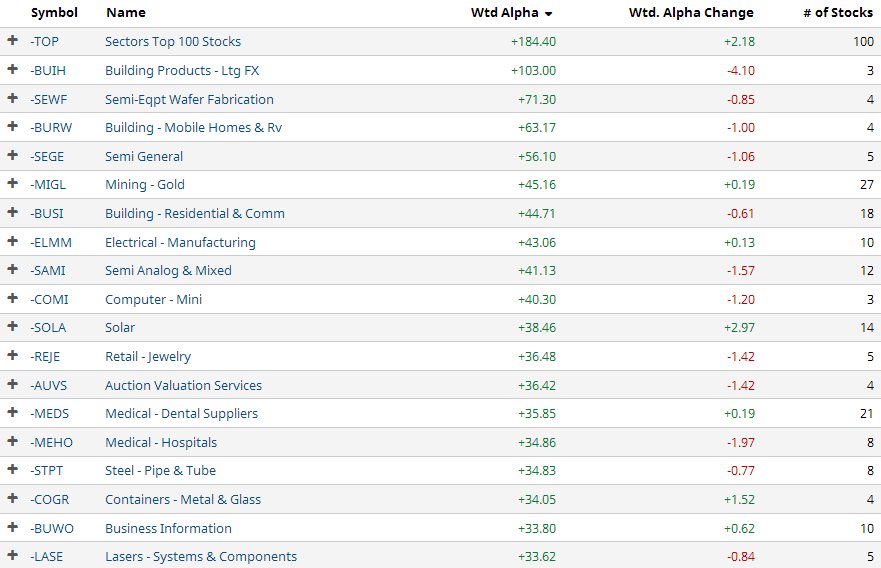
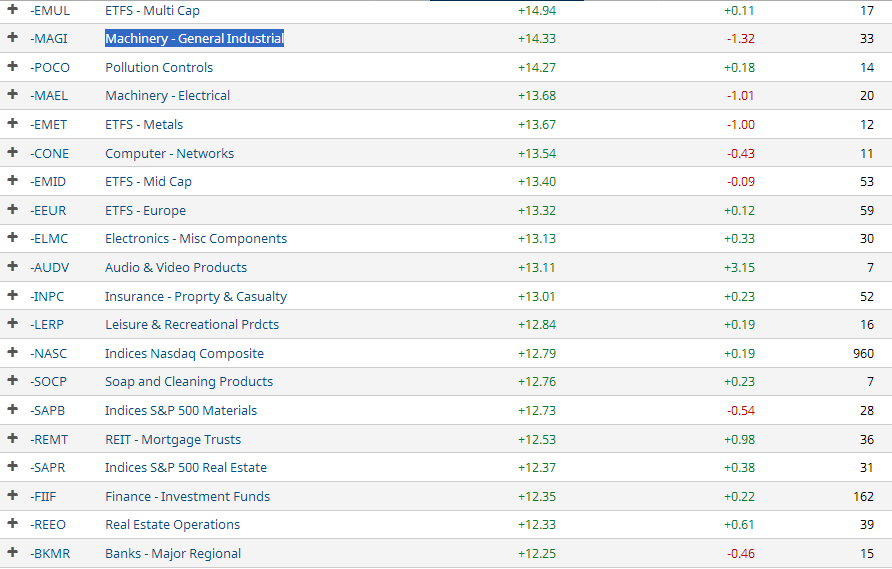
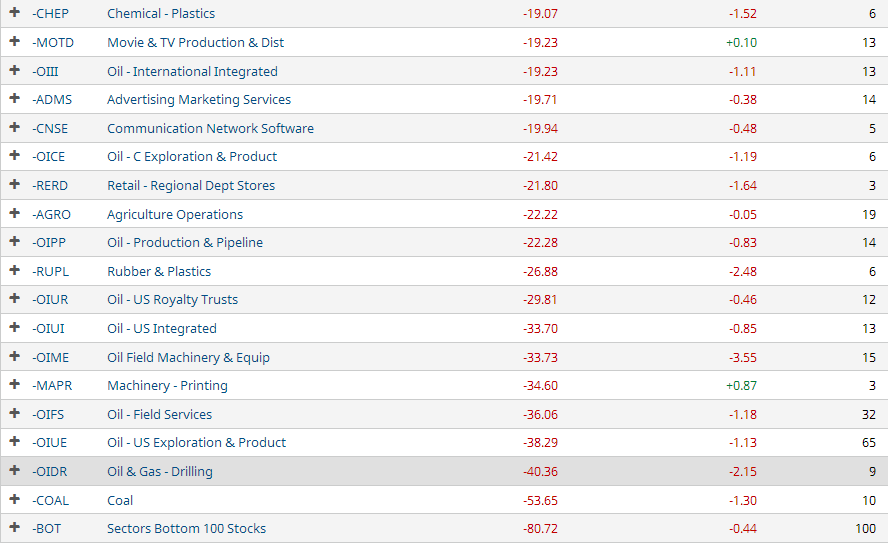
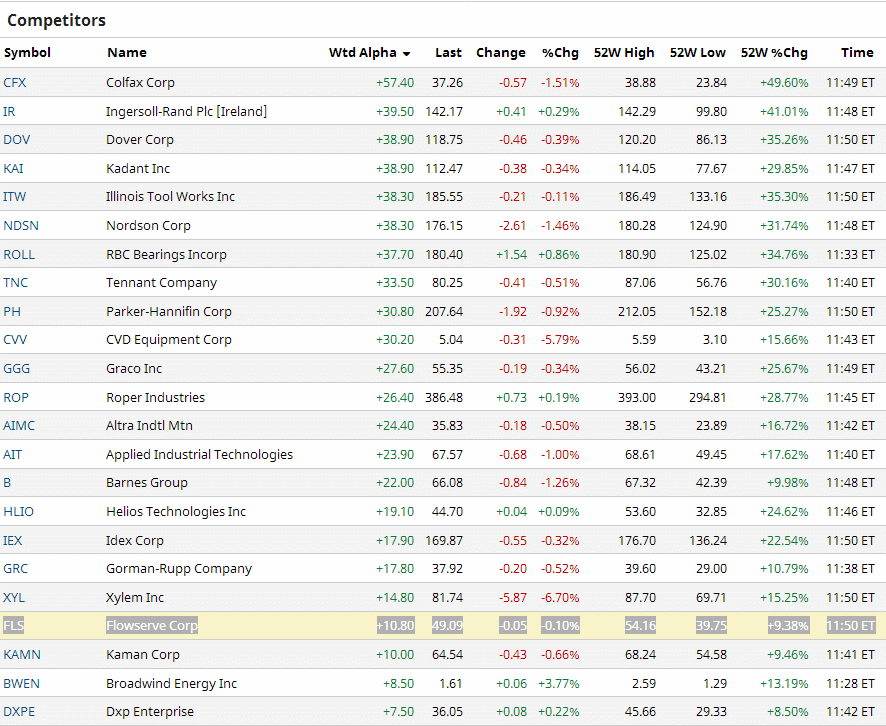
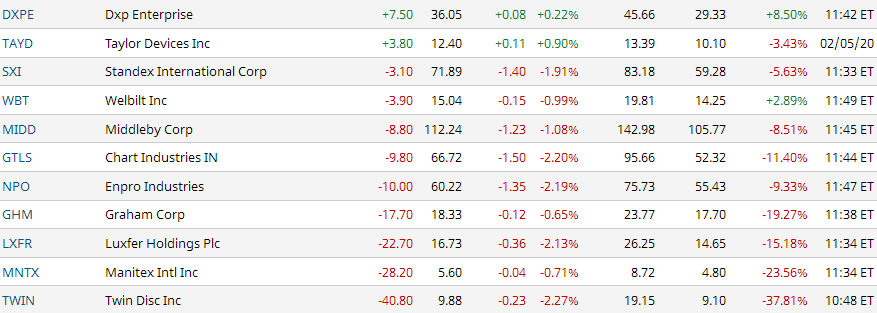
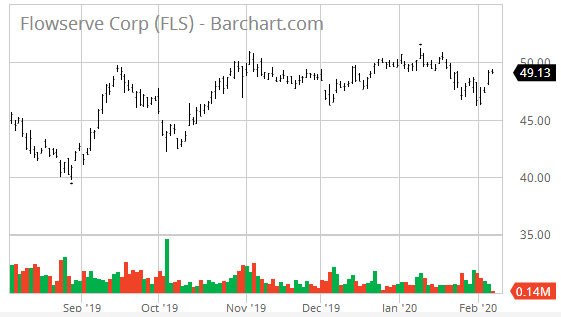
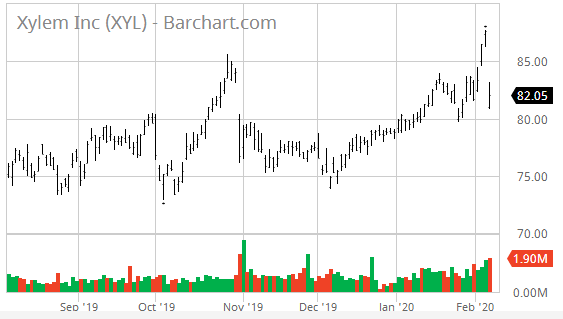
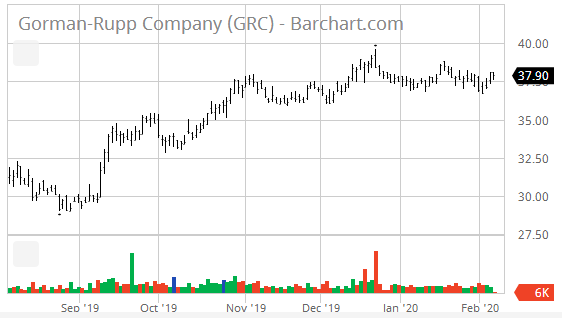
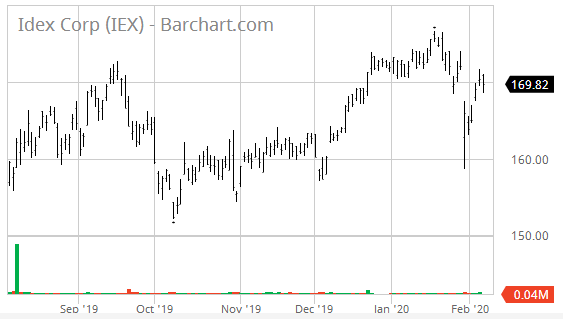
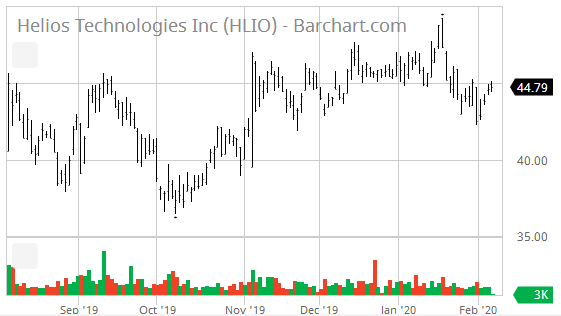
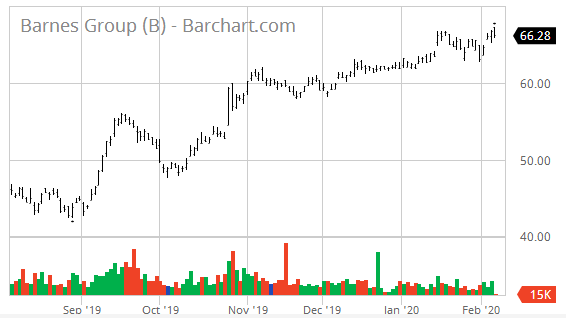
Similar Companies Performance:
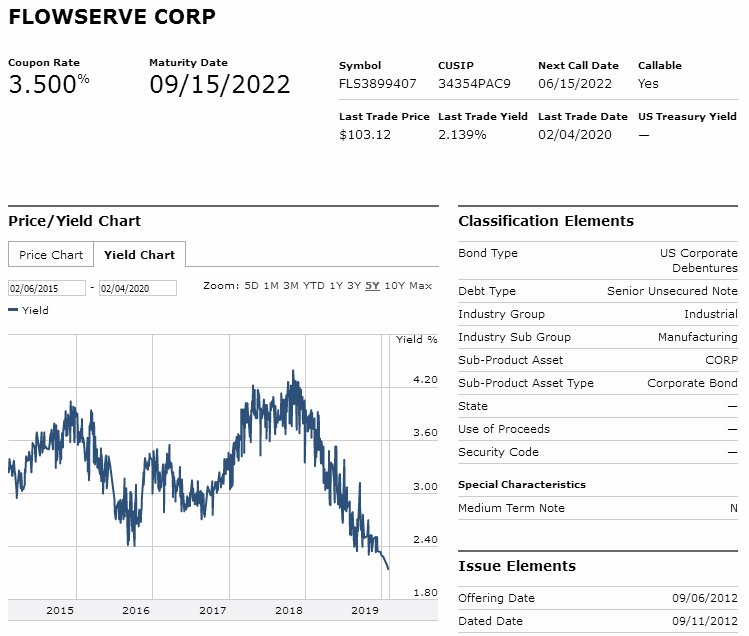
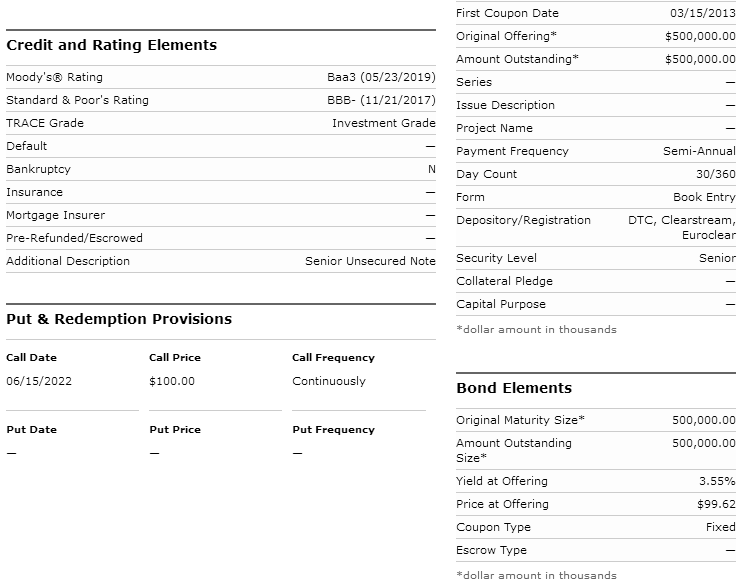
Bond Issue |
Zenith Index |
Under current market conditions, a Zenith Index Score of 1.20 or above is required for a positive rating on this factor. 1.21 -1.30 is considered acceptable, 1.30-1.40 is considered strong and
> 1.40 is considered exceptionally strong. Accounting statements in this section often contain mistakes, especially in earlier years' totals, but data is deemed sufficient for us to give a rating. More accurate financial statements follow in the next section.
oil and gas, chemical and pharmaceuticals, power generation, and water
management markets, as well as general industries, including mining and
ore processing, pulp and paper, food and beverage, and other smaller
applications. The company distributes its products through direct sales,
distributors, and sales representatives. Flowserve Corporation was
incorporated in 1912 and is headquartered in Irving, Texas.

Last Trade:  47.37                           52-Week Range:  54.16 -  39.75
Employees: 17,000                            Avg.Volume:     649,841 Shares

Corporate Governance:
Pillar scores are Audit: 3; Board: 4; Shareholder Rights: 9; Compensation: 8.
         (A lower number means less governance risk.)

EPS:  1.88    Dividend Amount: $ 0.76          Yield:  1.64%
             Ex-Dividend Date: Dec 26, 2019    Payout Ratio:  40.43

Key Statistics:

    Trailing P/E:  26.14                      Target Price:  51.18

Qrtly Stock Price Growth (yoy):   5.29%               Beta:   1.71
Qrtly S&P Index   Growth (yoy):   4.60%        Short Ratio:   6.19%
    Qrtly Revenue Growth (yoy):  52.00%         Shares Out:  130860000
   Qrtly Earnings Growth (yoy): 142.70%

          Book Value:  13.34                    Debt/Equity:  87.12%
    Price/Book Value:   0.00        Operating Profit Margin:  11.01%
         Price/Sales:   0.00                  Profit Margin:   6.39%
         Market Cap:   6,430,000,000       Return on Equity:  14.99%
    Enterprise Value:               0      Return on Assets:   5.68%

    Operating Cash Flow:        190,831
         Free Cash Flow:        -63,919


Annual Income Statement:                          (All numbers in thousands)
  Period Ending                             12/31/2018  12/31/2017  12/31/2016

  Total Revenue                              3,832,666   3,660,831   3,991,462
  Cost of Revenue                            2,644,830   2,575,454   2,759,908
  Gross Profit                               1,187,836   1,085,377   1,231,554

Operating Expenses:
  Research & Development                             0           0           0
  Selling, General & Administrative            943,714     903,864     965,322
  Total Operating Expenses                     943,714     903,864     965,322

Operating Income or Loss                       244,122     181,513     266,232

Income from Continuing Operations:
  Total Other Income/Expenses Net              -16,153     137,795      14,524
  Interest Expense                              58,160      59,730      60,137
  Income Before Taxes                          176,274     263,007     223,423
  Income Tax Expense                            51,224     258,679      75,286

Net Income from Continuing Op.s                125,050       4,328     148,137

Non-recurring Events:
  Extraordinary Items                            5,379       1,676       3,077
  Net Income                                   119,671       2,652     145,060

Net Income Avail to Common Shares              119,671       2,652     145,066


Annual Cash Flow Statement:                   (All numbers in thousands)
  Period Ending                         12/31/2018    12/31/2017    12/31/2016

  Net Income                               125,050         4,328       148,137

Operating Activities:
  Depreciation                             112,473       118,454       116,752
  Changes in Accounts Recv'bls             -25,448        60,216        37,695
  Changes in Liabilities                   106,838       249,464       137,895
  Changes in Inventories                   -29,314        48,642        30,877
  Changes in other Oper'g Acts            -104,729       158,374      -147,097

Total Cash Flow f Operations               190,831       311,066       227,594

Investing Activities:
  Capital Exenditures                      -83,993       -61,602       -89,699
  Investments                               -3,663             0        -5,064
  Other Cash Flows fr Investing              6,190         5,435         3,294

Total Cash Flows from Investing            -81,466       176,600       -91,469

Financing Activities:
  Dividends Paid                           -99,416       -99,233       -97,746
  Sale of Purchase of Stock                      0             0             0
  Other Cash Flows fr Financing            -13,868       -26,120         3,294

Total Cash Flows from Financing           -173,284      -185,353      -130,839

Change in Cash & Cash Equiv.               -83,762       336,283           718


Annual Balance Sheets:                              (All Numbers in Thousands)
  Period Ending                          12/31/2018    12/31/2017    12/31/2016
Current Assets:
  Cash & Cash Equivalents                   619,683       703,445       367,162
  Short Term Investments                          0             0             0
  Net Receivables                           792,434       856,711       894,749
  Inventory                                 633,871       884,273       919,251
  Other Current Assets                            0             0             0
  Total Current Assets                    2,383,145     2,558,745     2,331,361

  Long-Term Investments                   1,566,730     1,639,829     1,605,779
  Property, Plant & Equipt                  610,096       671,796       723,628
  Goodwill                                1,197,640     1,218,188     1,205,054
  Intangible Assets                         190,550       210,049       214,528
  Other Assets                              190,164       199,722       181,014

Total Assets                              4,616,277     4,910,474     4,742,762

Current Liabilities:
  Accounts Payable                          418,893       443,113       412,087
  Current Portion LT Debt                   168,744       223,249       240,817
  Other Current Liabilities                       0             0             0
  Total Current Liabilities               1,080,975     1,242,908      1,178,141

  Long Term Debt                          1,499,658     1,485,258             0
  Other Liabilities                               0             0             0

Total Liabilities                         2,955,497     3,239,520     3,073,567

Stockholder Equity:
  Common Stock                              220,991       220,991       220,991
  Retained Earnings                       3,543,007     3,503,947     3,632,163
  Capital Surplus                          -566,830      -499,119      -618,241
  Total Stockholder Equity                1,642,315     1,654,587     1,648,234


Flowserve Corporation (FLS)                 [Indices near +3.0, near zero,
                                            or < zero bear special attention.]
P/E Ratio Tests:
P/E Ratio < 28?            1.0712          P/E Ratio > 5?             1.0000
P/E Ratio Vs Growth Rate:  3.0000          Forward P/E Ratio < 28?    0.0000
Price/Sales Ratio < 2.3?   1.0000          Inventory/Sales < 5%?      0.3023
Sales < $1 Billion?        0.2609          Operating Margin < 7.5%?   0.6812

Balance Sheet Tests:
Debt/Equity < 0.40?        0.4591          Long-Term Debt Service:    1.1074
LTD Being Reduced?        -3.0000          Short-Term Debt Service:   0.0000
Current Ratio > 2?         1.1023          Working Capital >= 1.5?    0.6895
Leverage Ratio < 20%?      0.3178          Debt/Assets < 1?           3.0000
Quick Ratio > 1?           3.0000          Inventory Turnover > 1?    0.6717
Share Equity Increase:     1.9964          Market Cap.< 1.5 Billion?  0.2333
                                           Intangibles < 3% Assets?   0.0998
Income Tests:
Profit Margin < 7.5%?      0.8520          EPS Annual Growth > 10%?   0.0022
Dividend Yield > 2.0%?     1.2195          EPS 3-yr Growth > 15?      0.1818
Enterprise Value/Revenue   1.6779          EPS Growth Consistent?     0.0000
Enterprise Value/EBITDA:   3.0000          Collection < 45 days?      0.5963
EPS Qrtly Growth > 10%?    0.0007          Gross Pft/Cur. LTD > 1?    3.0000
                                           Borrowing Int. Rate < 6%?  1.5471
Stock Performance Tests:
Volatility > 25%?          1.0643          % Held by Insiders < 5%?   3.0000
Beta > 1.25?               1.3680          % Held by Institut. < 50?  0.4987
50 Da MA > 200 Da MA?      0.1210          % Held by Institut. > 30?  3.0000
52-Wk Change vs. S&P 500:  0.1017          Short Ratio > 5?           1.2380
Price/Book Value < 3?      3.0000          Short % of Float > 20?     0.2040
Return on Assets > 17%?    0.3341          Average Volume > 100,000?  3.0000

Cash Flow Tests:
Oper. C.F. > Lever'd C.F: -2.9855          Positive Free Cash Flow?  -1.0000
Positive Oper. Cash Flow?  3.0000          Price to C.F.Ratio < 14?:  0.9702
                                           Cash Flow / Assets > 10%?  0.9652

FLS    Flowserve Corporation               Overall Zenith Index:      0.9588
Financial Statements |
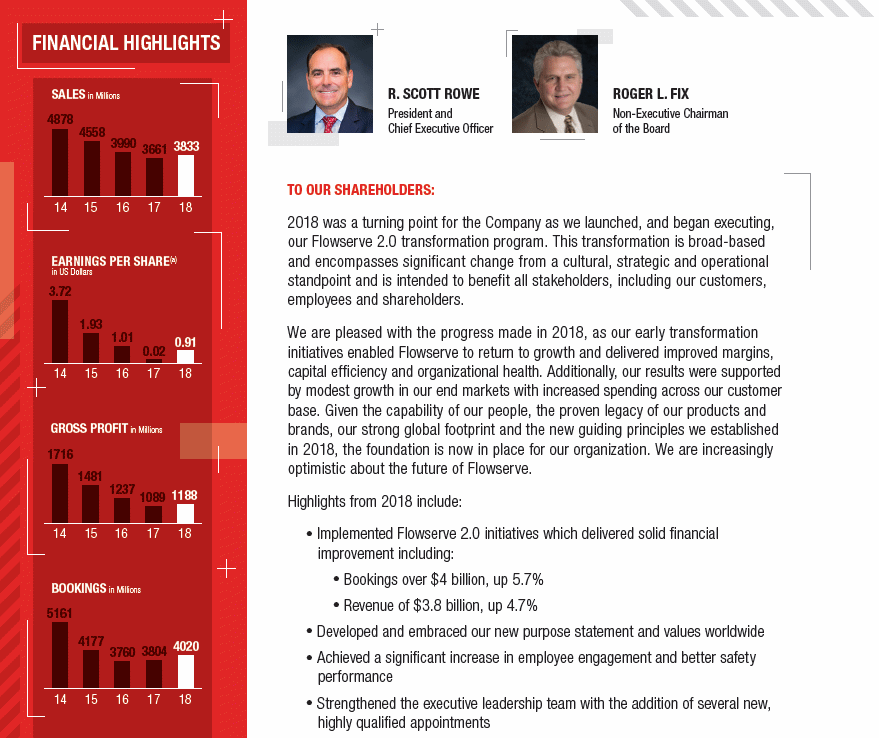
FLOWSERVE CORP (FLS) INCOME STATEMENT Fiscal year ends in December. USD in thousand 2014-12 2015-12 2016-12 2017-12 2018-12 TTM Revenue 4,877,885 4,561,030 3,991,462 3,660,831 3,832,666 3,863,547 Cost of revenue 3,163,268 3,073,712 2,759,908 2,575,454 2,644,830 2,595,904 Gross profit 1,714,617 1,487,318 1,231,554 1,085,377 1,187,836 1,267,643 Operating expenses Sales, General and administrative 936,900 971,611 965,322 903,864 943,714 886,915 Total operating expenses 936,900 971,611 965,322 903,864 943,714 886,915 Operating income 777,717 515,707 266,232 181,513 244,122 380,728 Interest Expense 60,322 65,270 60,137 59,730 58,160 56,540 Other income (expense) 15,795 -28,241 17,328 141,224 -9,688 9,553 Income before taxes 733,190 422,196 223,423 263,007 176,274 333,741 Provision for income taxes 208,305 148,922 75,286 258,679 51,224 78,842 Net income from continuing operations 524,885 273,274 148,137 4,328 125,050 254,899 Other -6,061 -5,605 -3,077 -1,676 -5,379 -7,921 Net income 518,824 267,669 145,060 2,652 119,671 246,978 Preferred dividend -12 -12 -6 0 0 0 Net income available to common shareholders 518,836 267,681 145,066 2,652 119,671 246,978 Earnings per share Basic 3.79 2.01 1.11 0.02 0.91 1.88 Diluted 3.76 2.00 1.11 0.02 0.91 1.88 Weighted average shares outstanding Basic 136,912 133,074 130,432 130,703 130,823 131,030 Diluted 137,843 133,811 130,975 131,358 131,271 131,626 ____________________________________________________________________________________________________________________________________________ FLOWSERVE CORP (FLS) BALANCE SHEET Fiscal year ends in December. USD in thousand 2014-12 2015-12 2016-12 2017-12 2018-12 Assets Current assets Cash Total cash 450,350 366,444 367,162 703,445 619,683 Receivables 1,082,447 988,391 894,749 856,711 792,434 Inventories 995,564 995,565 919,251 884,273 633,871 Deferred income taxes 158,912 155,982 0 0 0 Prepaid expenses 106,890 125,410 150,199 114,316 108,578 Other current assets 0 0 0 0 228,579 Total current assets 2,794,163 2,631,792 2,331,361 2,558,745 2,383,145 Non-current assets Property, plant and equipment Gross property, plant and equipment 1,530,862 1,613,641 1,605,779 1,639,829 1,566,730 Accumulated Depreciation -836,981 -855,214 -882,151 -968,033 -956,634 Net property, plant and equipment 693,881 758,427 723,628 671,796 610,096 Goodwill 1,067,255 1,223,986 1,205,054 1,218,188 1,197,640 Intangible assets 146,337 228,777 214,528 210,049 190,550 Deferred income taxes 31,419 26,264 87,178 51,974 44,682 Other long-term assets 234,965 234,604 181,014 199,722 190,164 Total non-current assets 2,173,857 2,472,058 2,411,402 2,351,729 2,233,132 Total assets 4,968,020 5,103,850 4,742,763 4,910,474 4,616,277 Liabilities and stockholders' equity Liabilities Current liabilities Short-term debt 53,131 60,434 85,365 75,599 68,218 Accounts payable 611,715 491,378 412,087 443,113 418,893 Deferred income taxes 12,957 11,386 0 0 0 Taxes payable 53,725 56,488 29,827 42,692 24,351 Accrued liabilities 188,234 256,229 240,817 223,249 168,744 Deferred revenues 325,625 323,595 262,339 277,538 202,458 Other current liabilities 226,488 160,452 147,706 180,717 198,311 Total current liabilities 1,471,875 1,359,962 1,178,141 1,242,908 1,080,975 Non-current liabilities Long-term debt 1,101,791 1,570,836 1,485,258 1,499,658 1,414,829 Pensions and other benefits 452,511 489,319 410,168 496,954 459,693 Minority interest 10,281 17,256 20,961 16,367 18,465 Total non-current liabilities 1,564,583 2,077,411 1,916,387 2,012,979 1,892,987 Total liabilities 3,036,458 3,437,373 3,094,528 3,255,887 2,973,962 Stockholders' equity Common stock 220,991 220,991 220,991 220,991 220,991 Other Equity -380,406 -540,043 -626,748 -505,473 -573,947 Additional paid-in capital 495,600 494,961 491,848 488,326 494,551 Retained earnings 3,415,738 3,587,120 3,632,163 3,503,947 3,543,007 Treasury stock -1,830,919 -2,106,785 -2,078,527 -2,059,558 -2,049,404 Accumulated other comprehensive income 10,558 10,233 8,507 6,354 7,117 Total stockholders' equity 1,931,562 1,666,477 1,648,234 1,654,587 1,642,315 Total liabilities and stockholders' equity 4,968,020 5,103,850 4,742,762 4,910,474 4,616,277 ____________________________________________________________________________________________________________________________________________ FLOWSERVE CORP (FLS) Statement of CASH FLOW Fiscal year ends in December. USD in thousand 2014-12 2015-12 2016-12 2017-12 2018-12 TTM Cash Flows From Operating Activities Net income 524,885 273,274 148,137 4,328 125,050 254,899 Depreciation & amortization 110,277 127,087 116,752 118,454 112,473 106,398 Investment/asset impairment charges 0 0 80,570 0 0 0 Stock based compensation 42,675 34,816 30,213 22,820 19,912 28,289 Change in working capital -124,512 -84,160 -147,097 158,374 -104,729 -71,538 Accounts receivable -79,655 50,441 37,695 60,216 -25,448 -29,318 Inventory -35,519 -26,232 30,877 48,642 -29,314 -51,310 Prepaid expenses -9,371 -121 -26,221 42,159 -7,869 12,257 Accounts payable 50,752 -113,639 -69,831 12,403 -4,823 7,251 Accrued liabilities -22,669 25,523 -97,668 -3,383 -18,248 -10,965 Other working capital -28,050 -20,132 -21,949 -1,663 -19,027 547 Other non-cash items 17,637 66,075 -981 7,090 38,125 -9,564 Net cash provided by operating activities 570,962 417,092 227,594 311,066 190,831 308,484 Cash Flows From Investing Activities Investments in property, plant, and equipmen -132,619 -181,861 -89,699 -61,602 -83,993 -78,641 Acquisitions, net 46,805 -353,654 -5,064 232,767 -3,663 0 Other investing activities 1,731 10,220 3,294 5,435 6,190 42,901 Net cash used for investing activities -84,083 -525,295 -91,469 176,600 -81,466 -35,740 Cash Flows From Financing Activities Debt issued 0 526,332 0 0 0 0 Debt repayment -40,000 -45,000 -60,000 -60,000 -60,000 -195,000 Common stock repurchased -246,504 -303,651 0 0 0 0 Excess tax benefit from stock based compe 8,587 6,813 2,477 0 0 0 Dividend paid -85,118 -93,650 -97,746 -99,233 -99,416 -99,563 Other financing activities -4,623 -29,522 24,430 -26,120 -13,868 58,961 Net cash provided by (used for) financing -367,658 61,322 -130,839 -185,353 -173,284 -235,602 Effect of exchange rate changes -32,675 -37,025 -4,568 33,970 -19,843 -19,814 Net change in cash 86,546 -83,906 718 336,283 -83,762 17,328 Cash at beginning of period 363,804 450,350 366,444 367,162 703,445 529,942 Cash at end of period 450,350 366,444 367,162 703,445 619,683 547,270 Free Cash Flow Operating cash flow 570,962 417,092 227,594 311,066 190,831 308,484 Capital expenditure -132,619 -181,861 -89,699 -61,602 -83,993 -78,641 Free cash flow 438,343 235,231 137,895 249,464 106,838 229,843 ____________________________________________________________________________________________________________________________________________
Average to Current P/E Ratios |
              (FLS)     Flowserve Corp.

                               2015    2016    2017    2018    2019

          Annual Earnings:     3.76    1.93    1.01    0.02    0.91
Average Price During Year:    32.87   33.15   37.11   41.19   47.30

                P/E Ratio:     8.74   17.17   36.74  %2059.46   51.98

 Average 5-Year P/E Ratio  = 434.82
             Current Price =  49.14

Previous 5 Quarter Earnings:   0.21    0.48    0.44    0.44    0.52

          Current Annualized (Last Four Quarters) Earnings =   1.40
                                                           ________
                                 Average PE / Current PE =    12.39
                                                           --------

                                      ...a number above 1.00 is good
                                                1.00 or below is bad
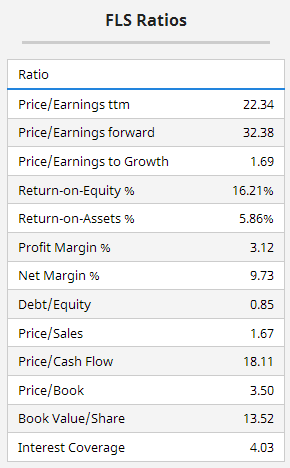
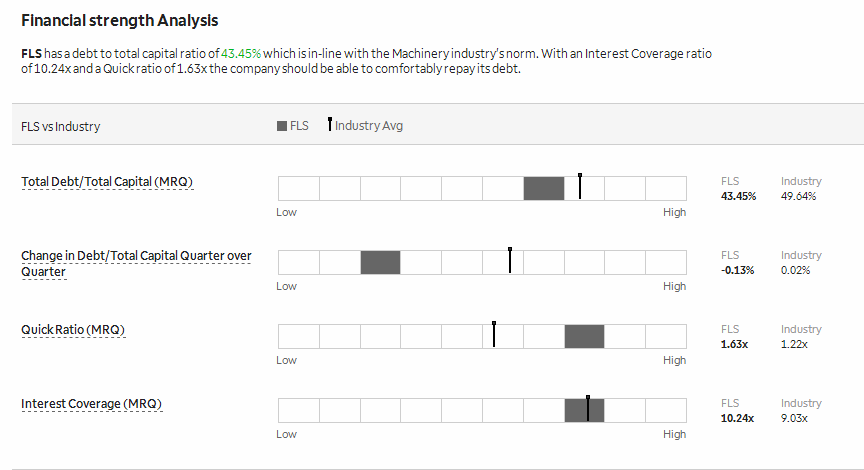
Financial Ratios |
. . . . . . . . . . . . Lowest to Highest, Compared to Industry
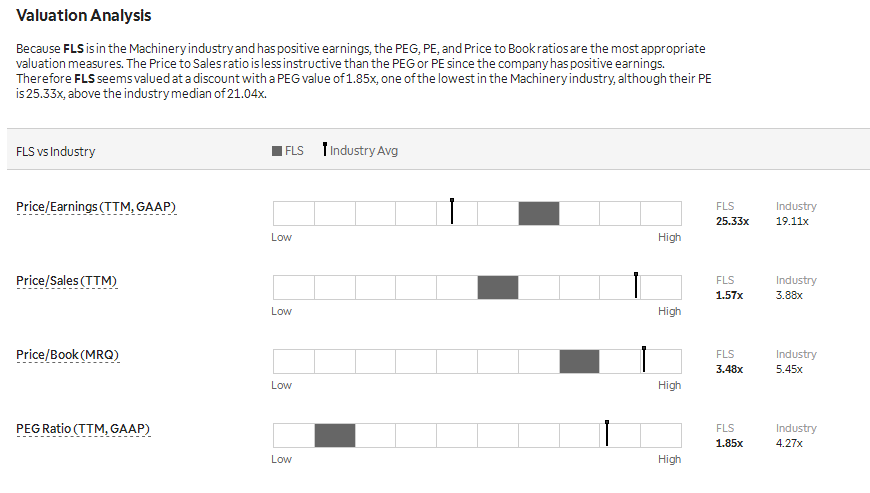
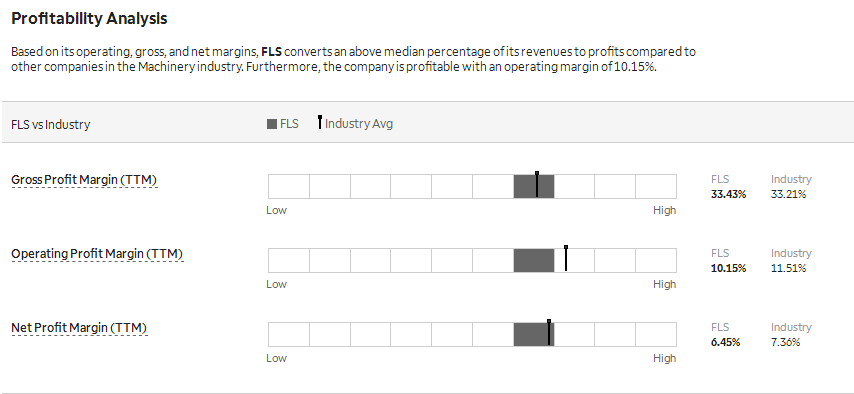
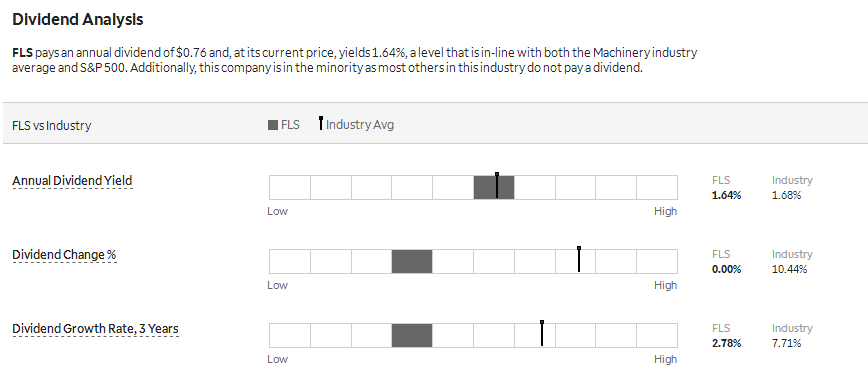
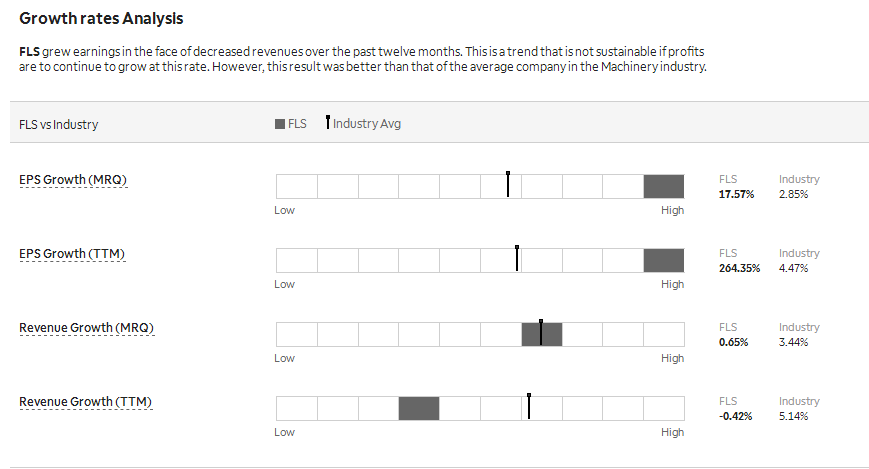
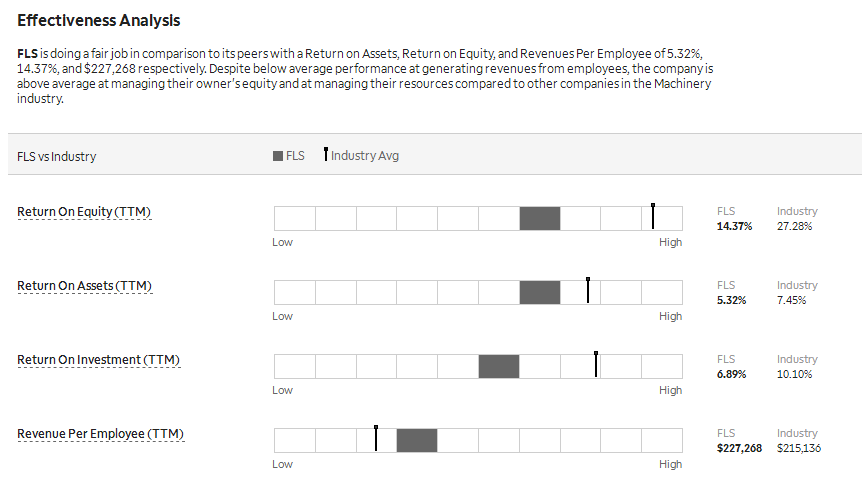
Intrinsic Value (DCF) |
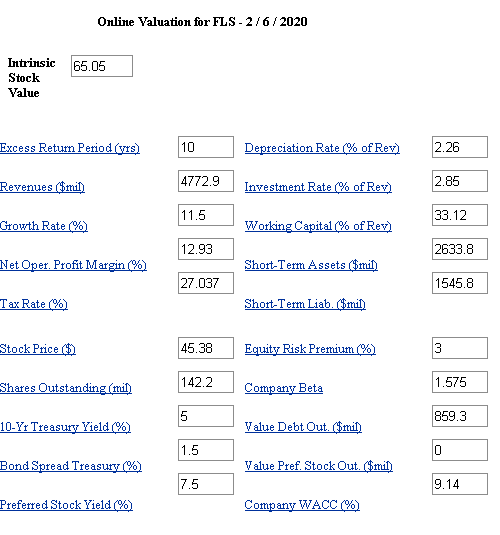
Intrinsic Value by Discounted Cash Flow Method:
Fair Value Estimator |
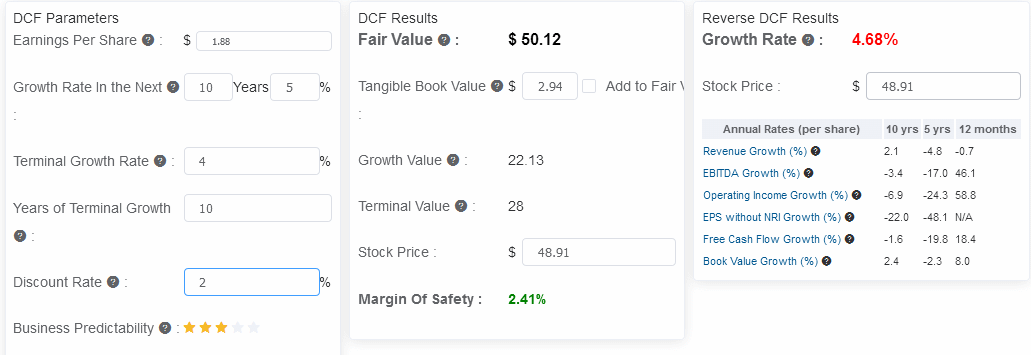
Fair Value Estimate:
Projected Earnings |

Research Reports |
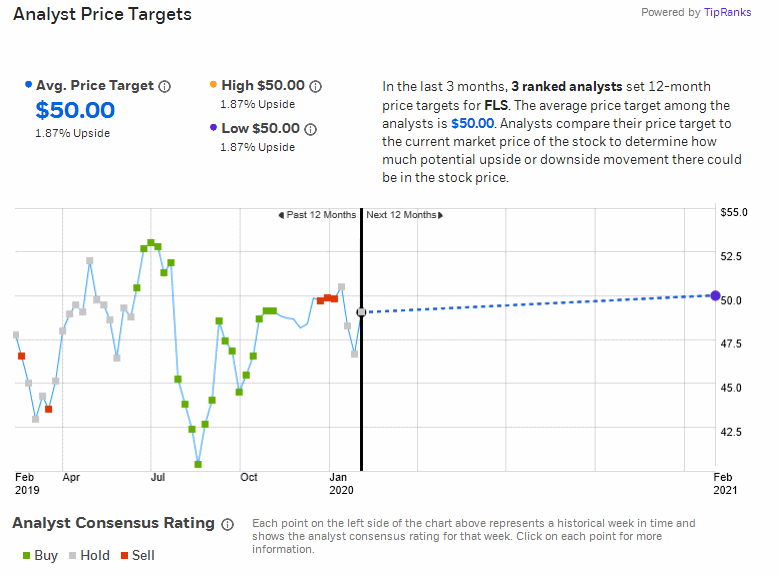
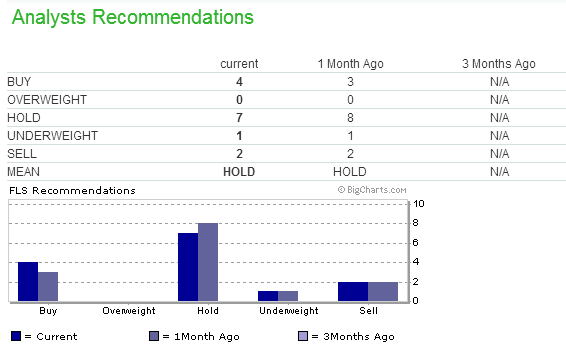
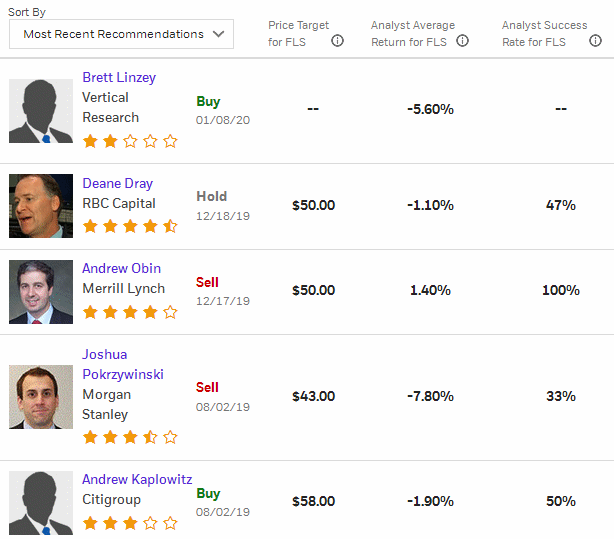
Analysts' Opinions |


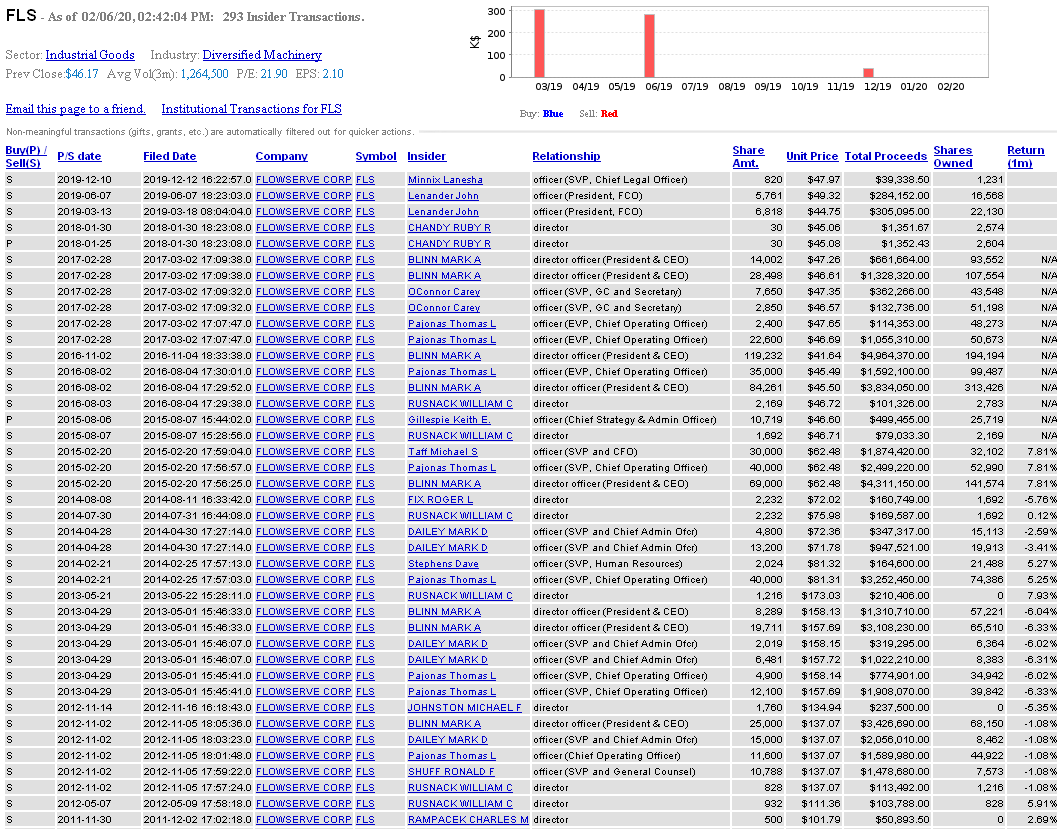
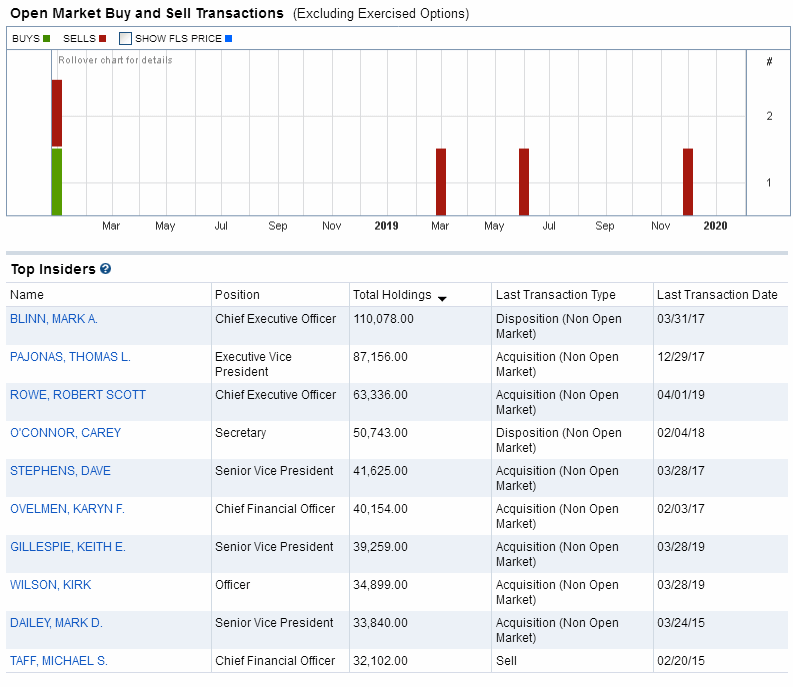
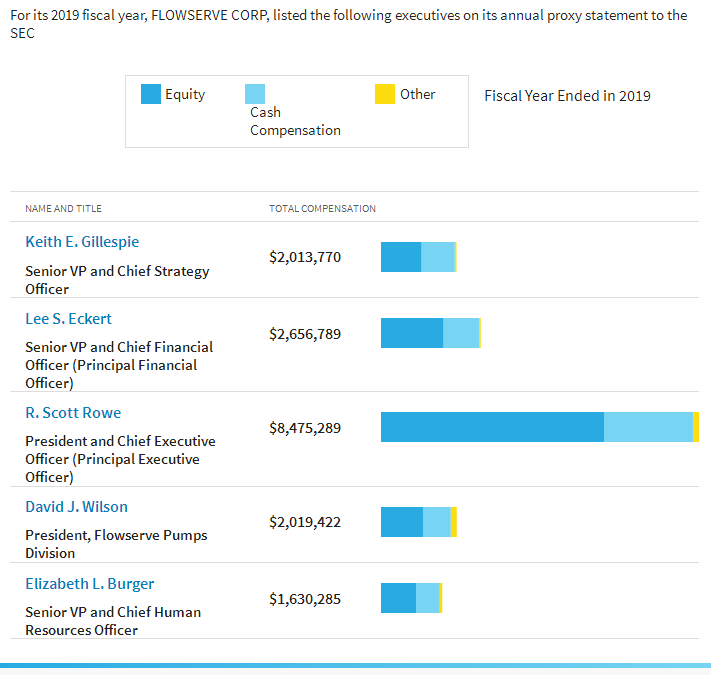
Insider Activity |

Institutional Activity |
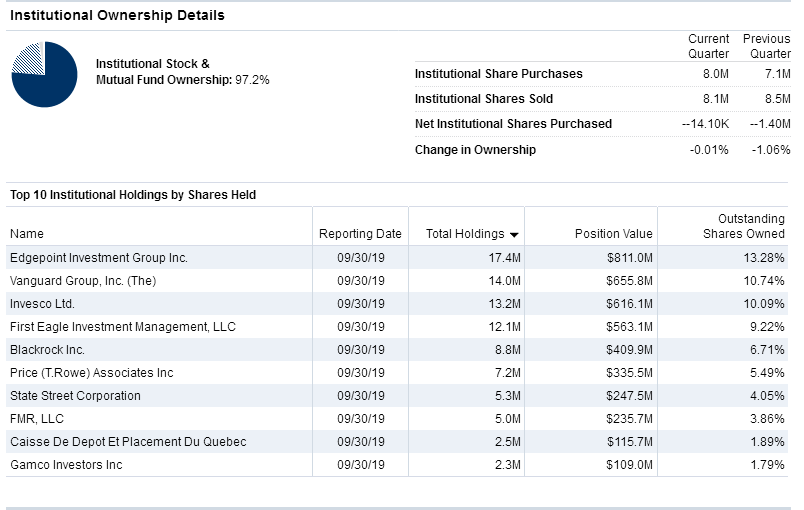
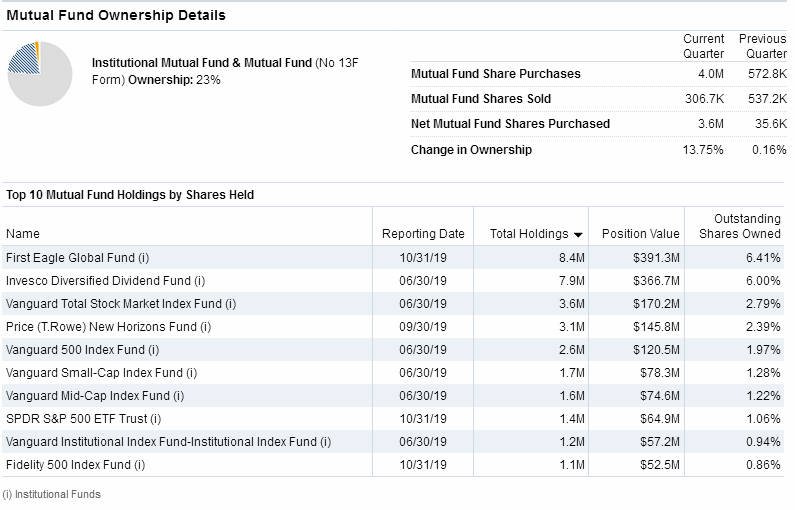
Institutional Ownership:
Sentiment |
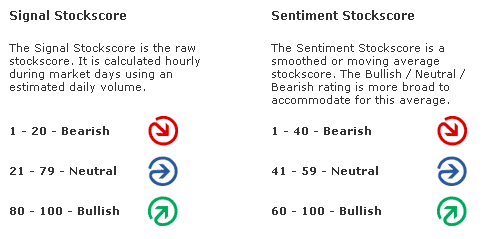
Zenith uses the "sentiment" score above or below 50 to award a positive or negative point in the Decision Matrix.


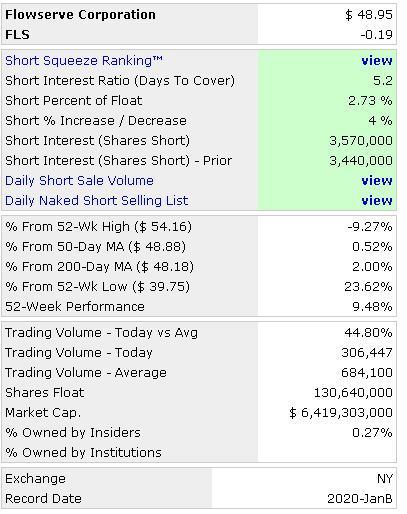
Short Interest Ratio |
As the short interest rises as a percentage of average daily share volume (Days to Cover), this is considered a measure of negative sentiment. Similarly, a decrease in that percentage is considered positive sentiment.

Standard & Poor's |
Management's Discussion of Results of Operations Excerpts |
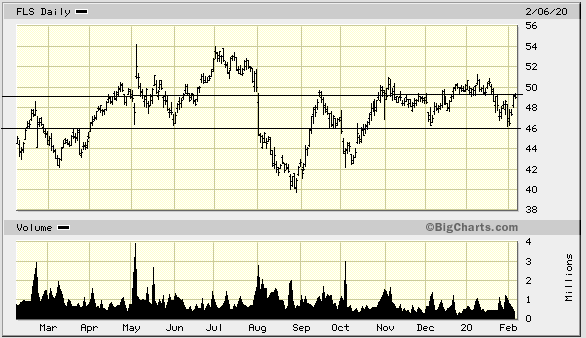
Channeling Potential |
The summary below includes a value for `Degree,' which refers on a
scale of 1 to 10 the range of a channel in the period under consi-
deration compared to the total range of price movement. It also looks
for the last closing price to be within the channel, otherwise zeroed.
The `Index' is the `Degree' weighted for volatility.  Generally, the
the higher the index, the more suitable is the stock for trading as
a `rolling stock' between channel high and low points.

Results for FLOWSERVE CORPORATION:
Symbol? FLS
Total Months Available:  25
       Months in Cycle?   4

Months Covered by Periods:  12

Period 1           Period 2          Period 3
   H1      L1        H2      L2        H3      L3
  51.03   46.03     51.18   43.69     48.58   43.42

RANGE   =  51.18  TO   43.42            Close =  48.38
CHANNEL =  48.58  TO   46.03           Degree =   3
Volatility =   5.27%                    Index =   1
MACD Histogram Divergence |
The theory is that connecting the two most recent peaks or valleys of the MACD histogram will signal the direction of the next major move.
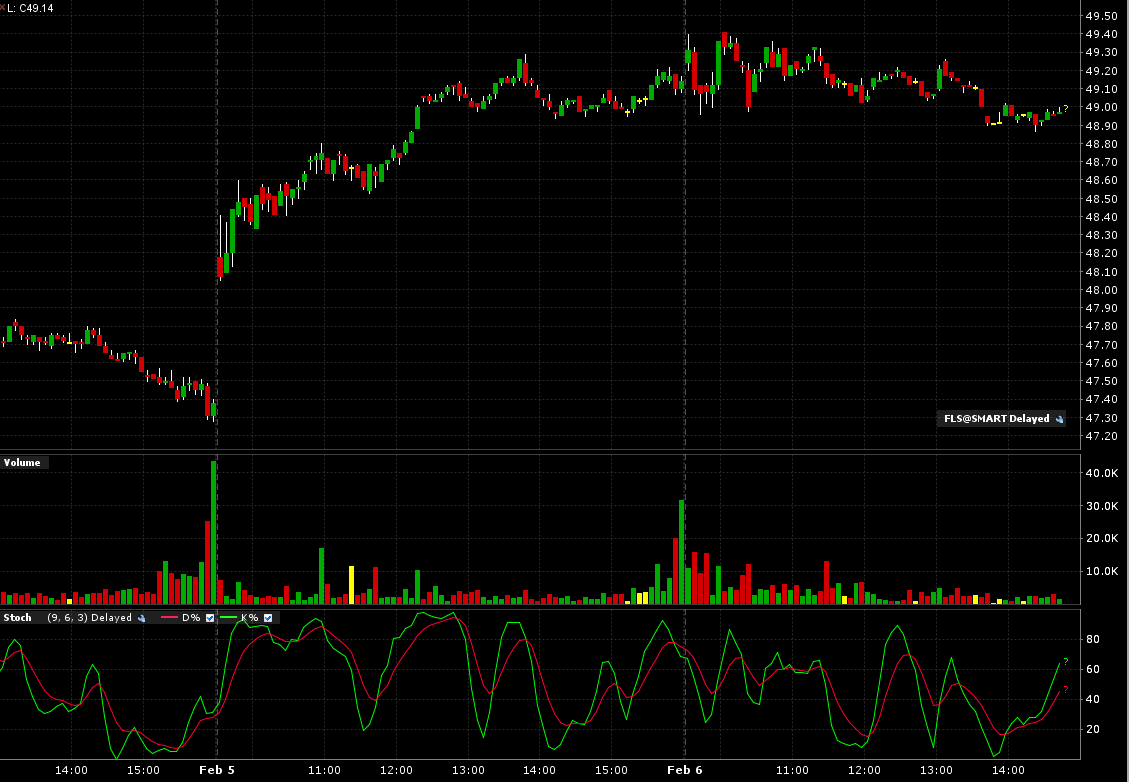
Intraday Chart |
2 Days:
Val Idea |
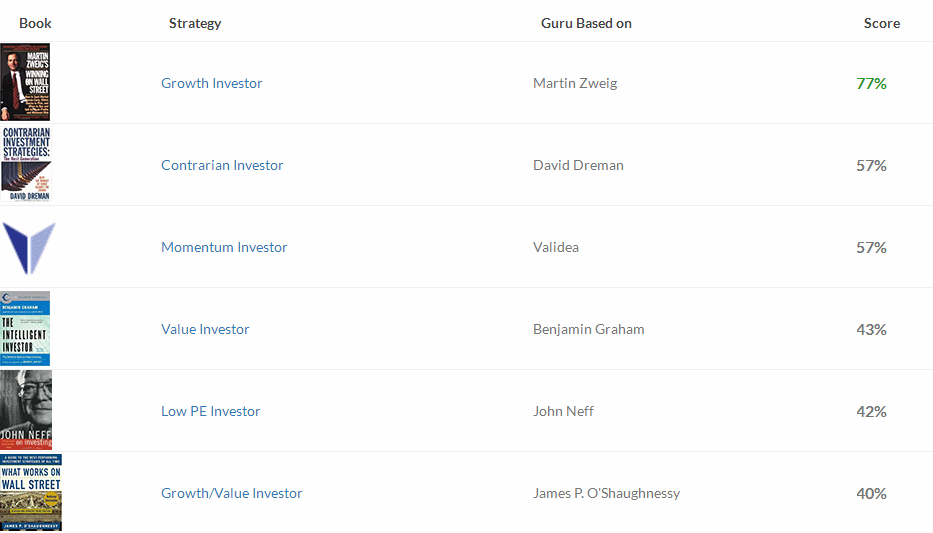
3 out of 8 favorable, (negative opinion.)

Stock Consultant |
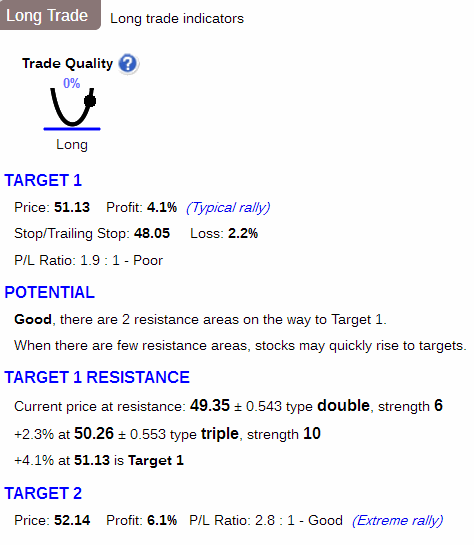
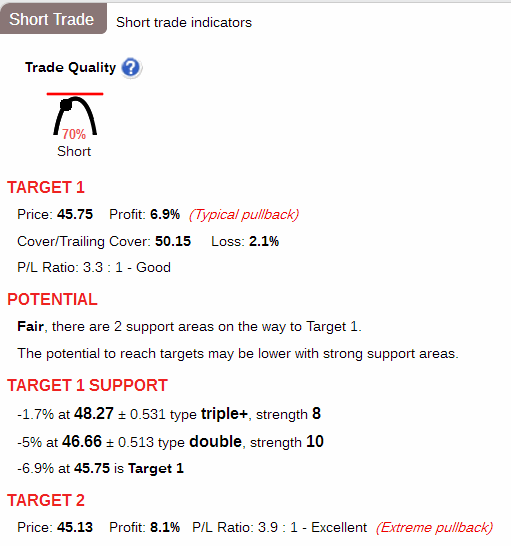
Point & Figure Chart |
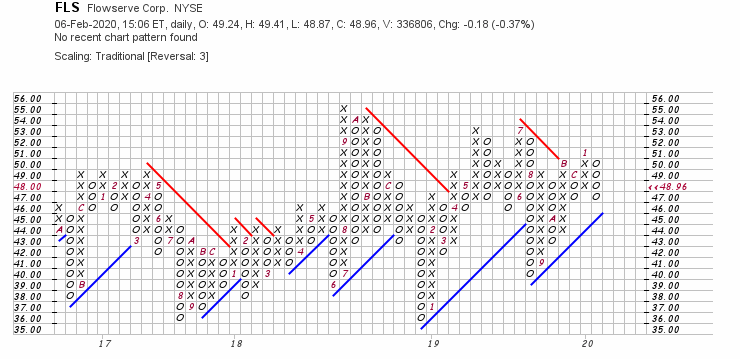
Wall Street Analyzer |
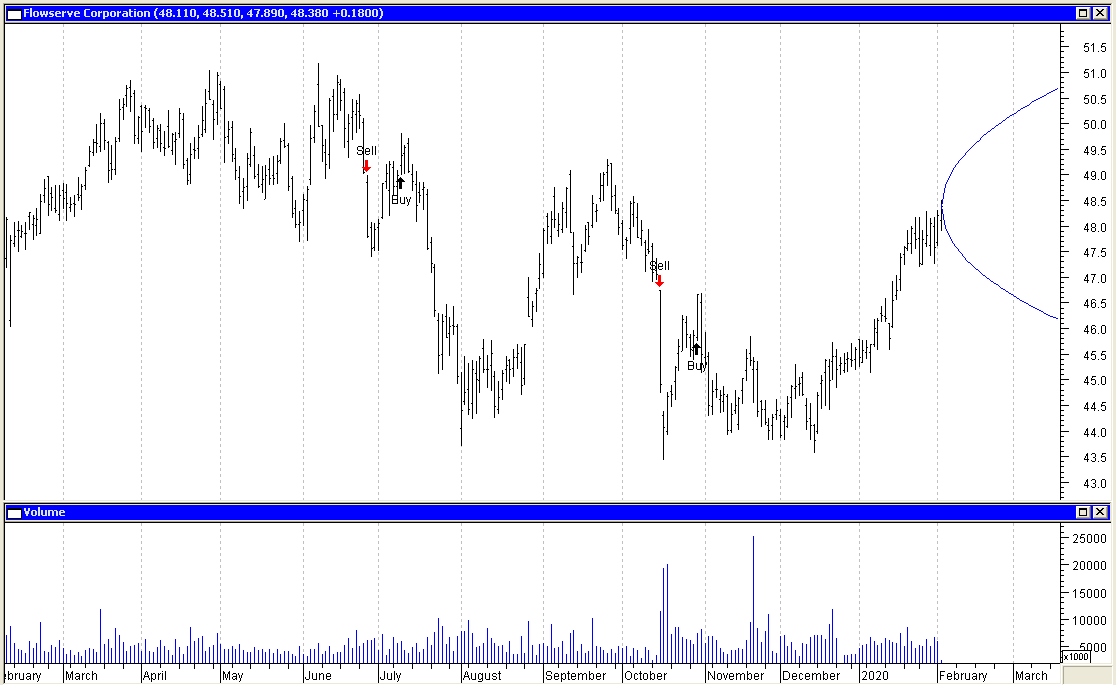
Marketspace Chart |
Time Series Forecast |
Neural Network Prediction |
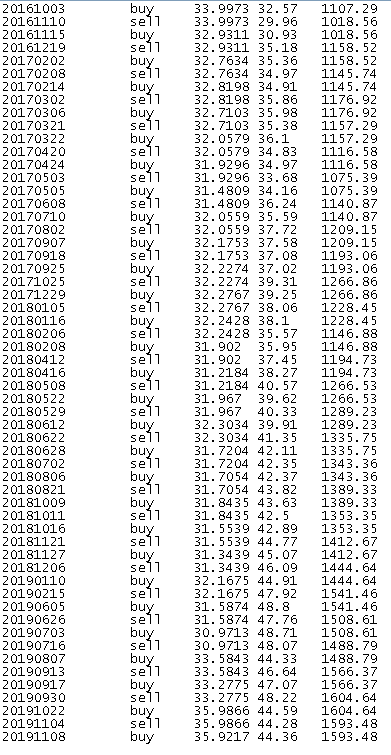
"Neurostock" can only track long trades. Therefore its performance, as tracked by itself on stocks which are consistently falling, may not appear as good as it could if each "sell" signal were a "short sale."

![]()

Ultimate Trading Systems |
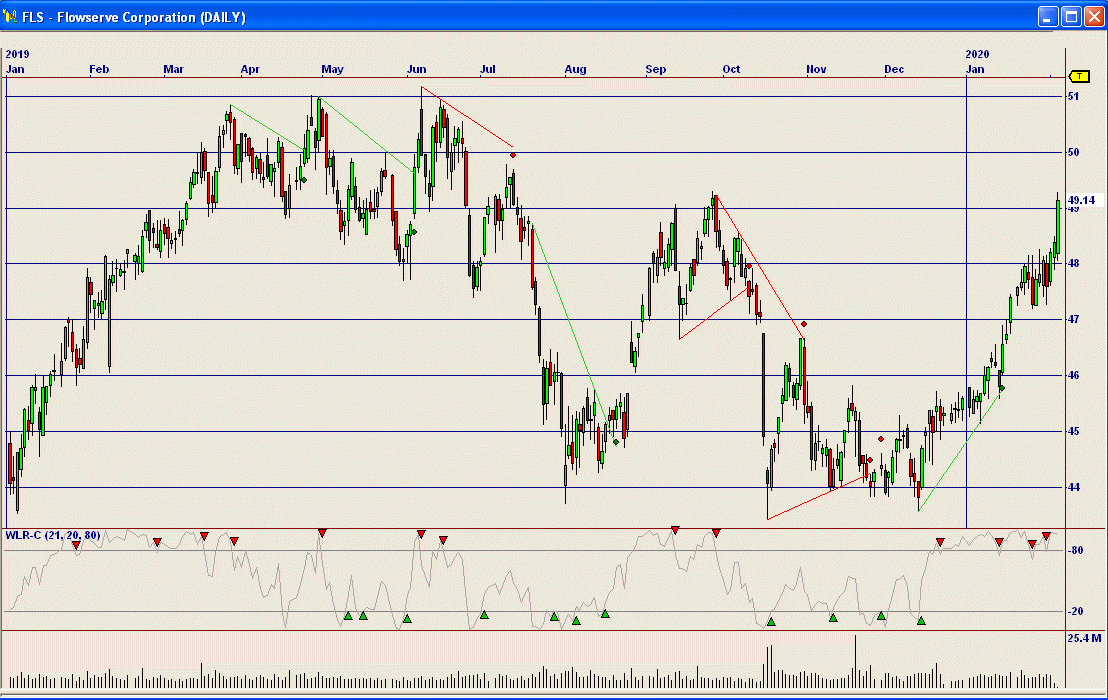
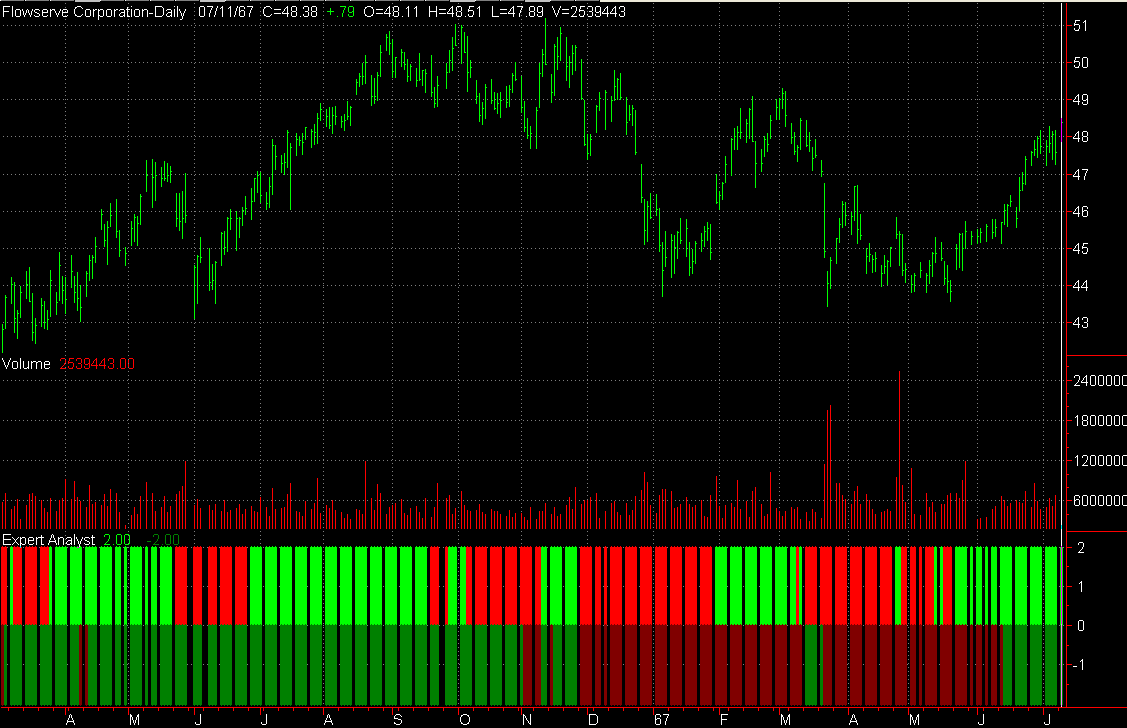
2 out of 3 of the ultimate systems favor a downmove.
System Below:
Short term outlook: Positive: Bright Green, Negative: Bright Red
Long term outlook: Postive: Dark Green, Negative: Dark Red.

Recommendation |
| Factors | Weighted Points |
|---|---|
| News | + 1 |
| Comparison | + 1 |
| Industry | + 1 |
| Bond Issue | + 1 |
| Zenith Index | - 1 |
| Non-GAAP vs. GAAP Earnings | + 1 |
| Cash Flow | + 1 |
| Average to Current P/E | + 1 |
| Ratios | + 1 |
| Intrinsic Value DCF | + 1 |
| Fair Value Estimator | + 1 |
| Projected Earnings | + 1 |
| Research Reports | - 1 |
| Analysts | - 1 |
| Executive Perquisites | - 1 |
| Insider Activity | - 1 |
| Institutional Activity | + 1 |
| Management Reporting | + 1 |
| Short Interest | - 1 |
| Sentiment | + 1 |
| Standard & Poor's | - 1 |
| MACD Histogram Divergence | - 1 |
| Val Idea | - 1 |
| Stock Consultant | - 1 |
| Point & Figure | + 1 |
| Wall Street Analyzer | - 1 |
| Marketspace Chart | + 1 |
| Time Series Chart | + 1 |
| Neural Network | - 1 |
| Stock Options | + 1 |
| Ultimate Trading Systems | - 1 |
| Total | + 3 |
Place 610 shares of Flowserve Corporation (FLS) on the Active List.