![]()
Corporate Webpages Quest Diagnostics, Inc.
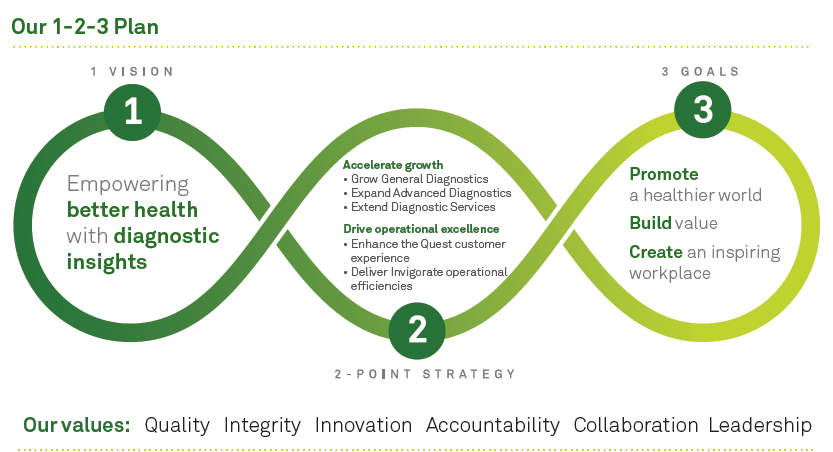
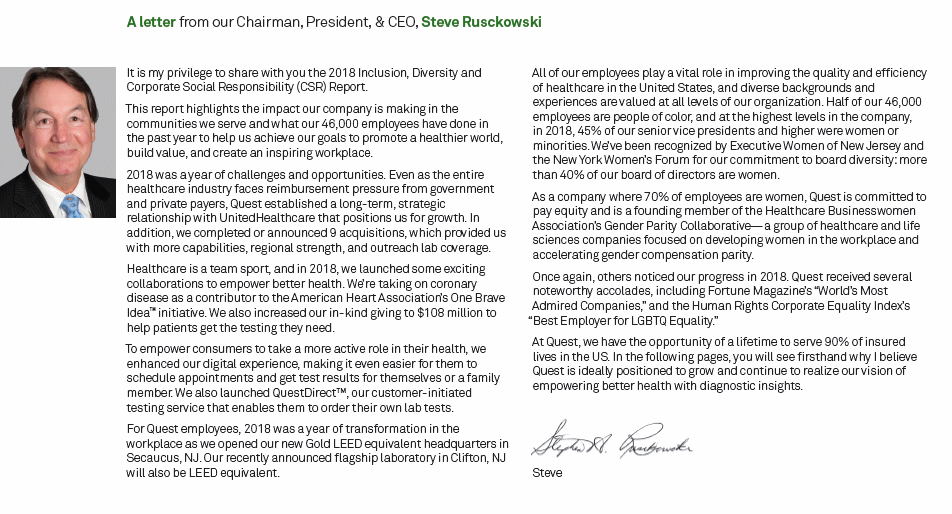
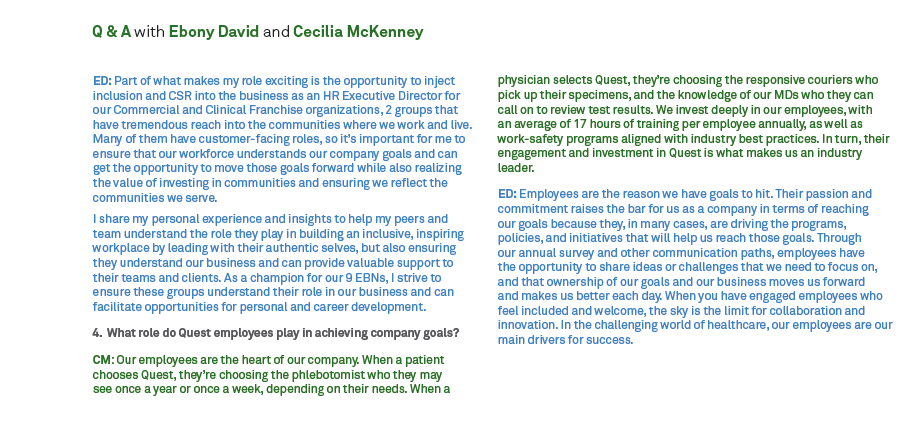
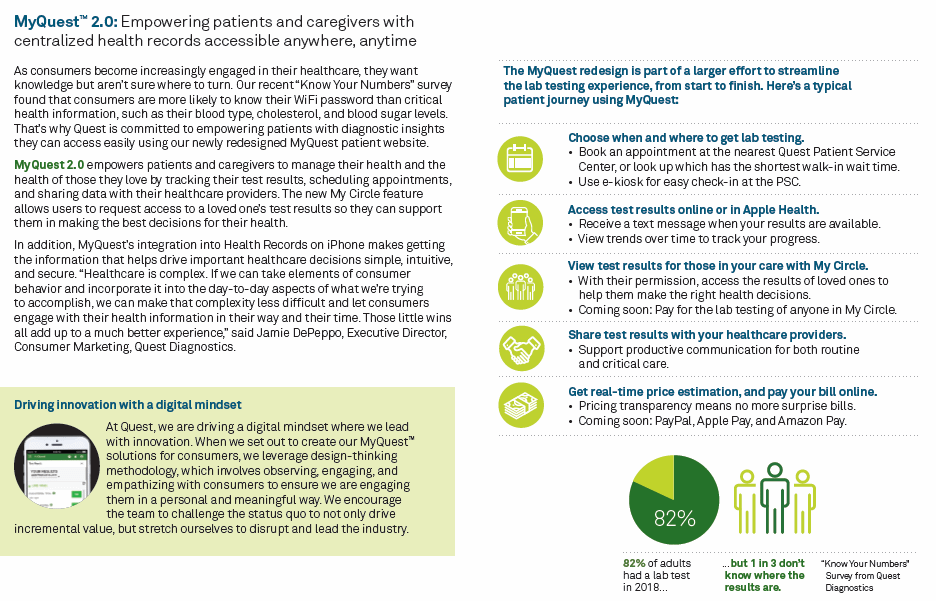
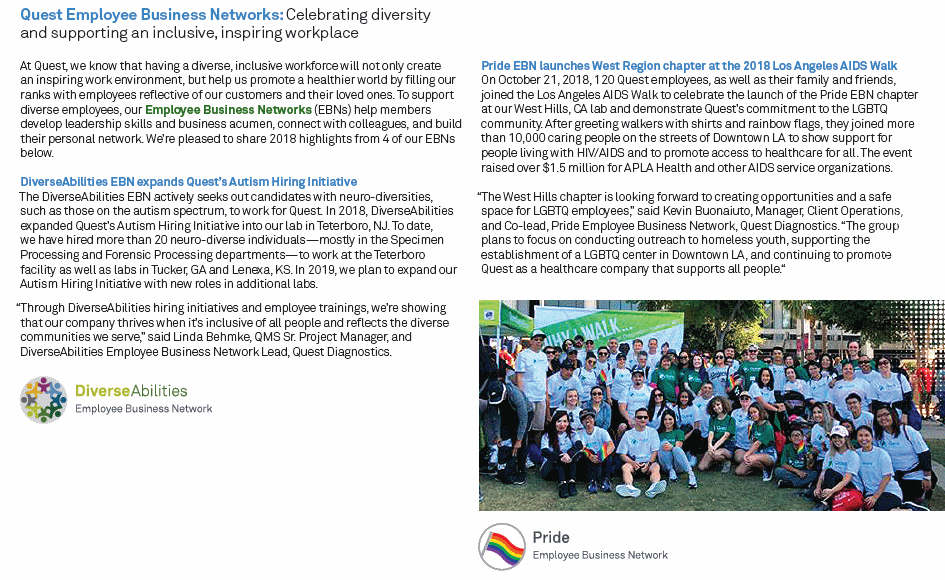
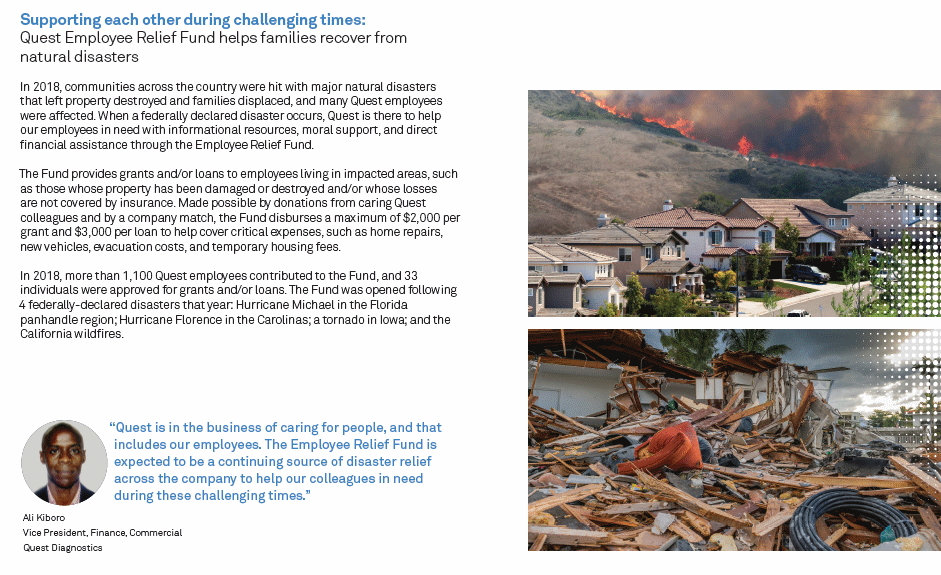
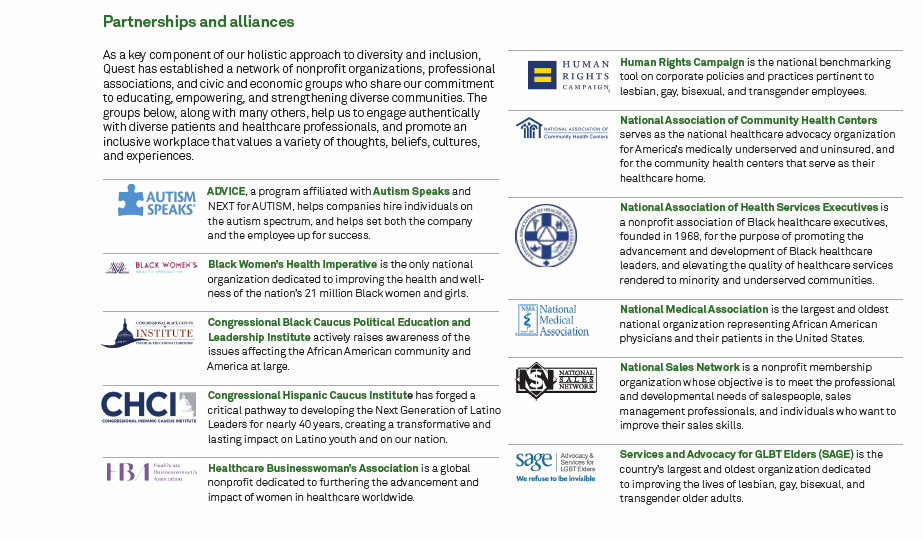
One of the things that catch one's eye immediately about Quest
Diagnostics, Inc., is the company's emphasis on diversity in the
work place. The company is active in human rights, womens'
rights, trans-gender and inter-racial activists. Its main
function seems to be to offer diagnostic medical tests to
individuals without a doctor's prescription and to serve medical
institutions with advanced testing equipment.
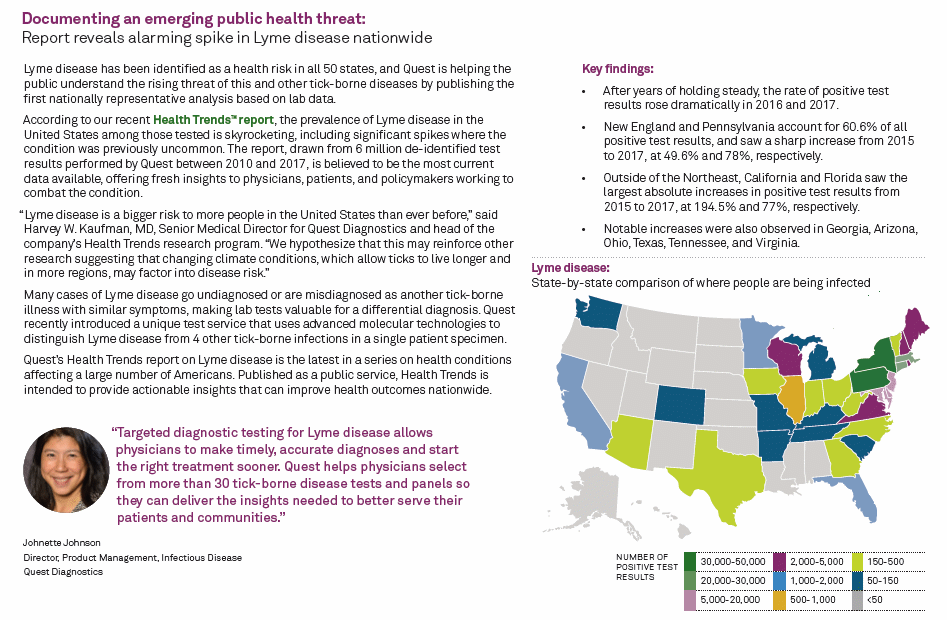
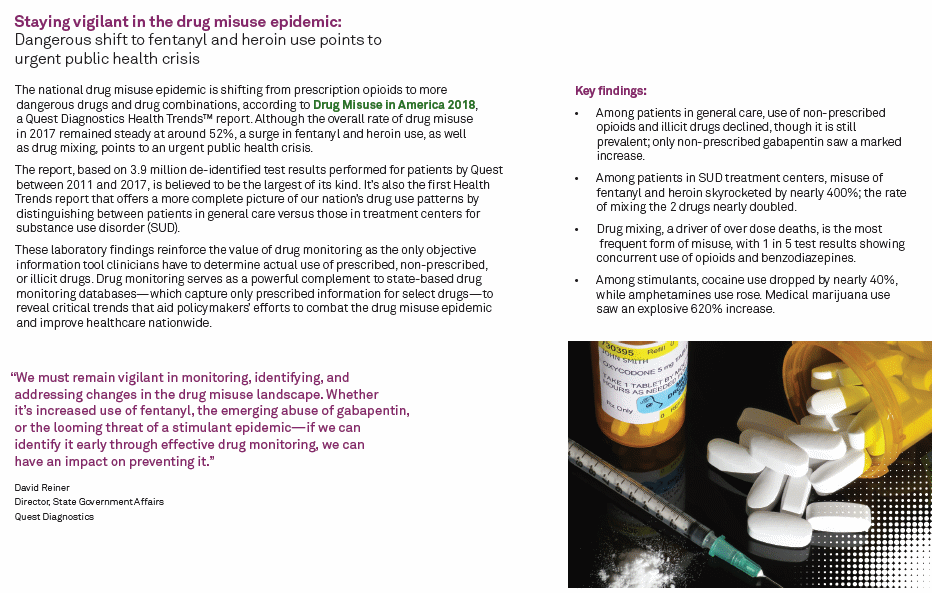
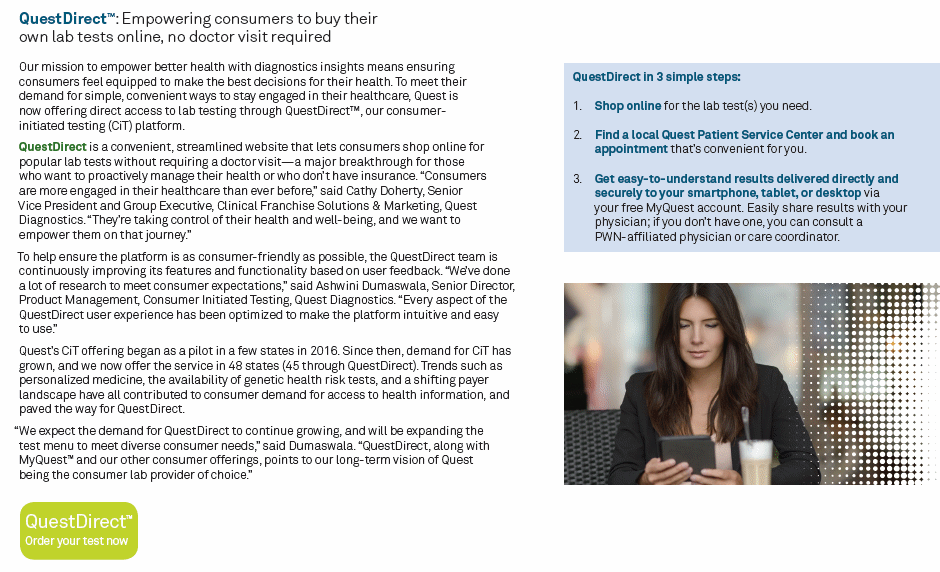
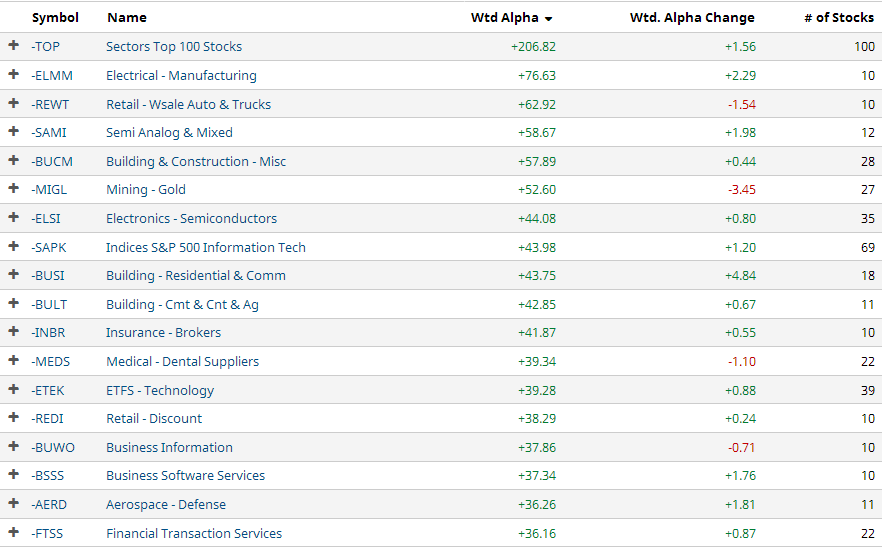
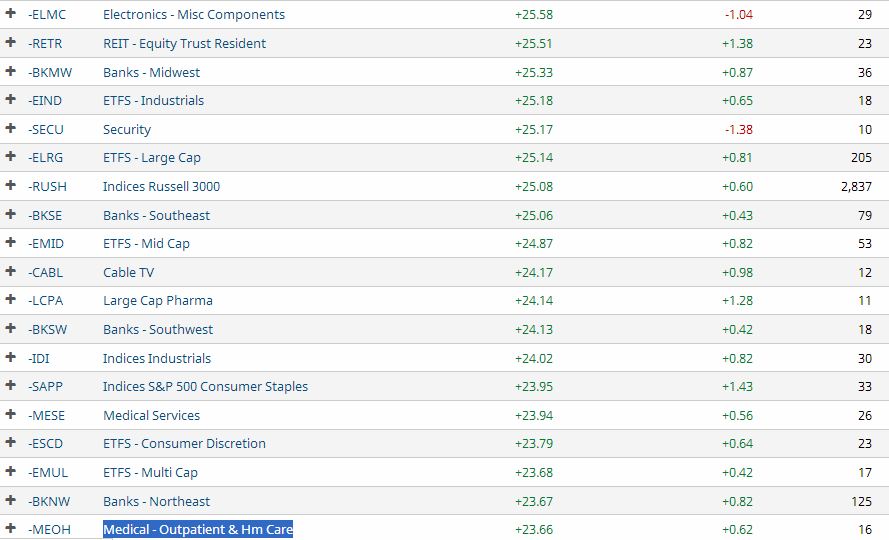
The stock has recently had some ups and downs in a strugging
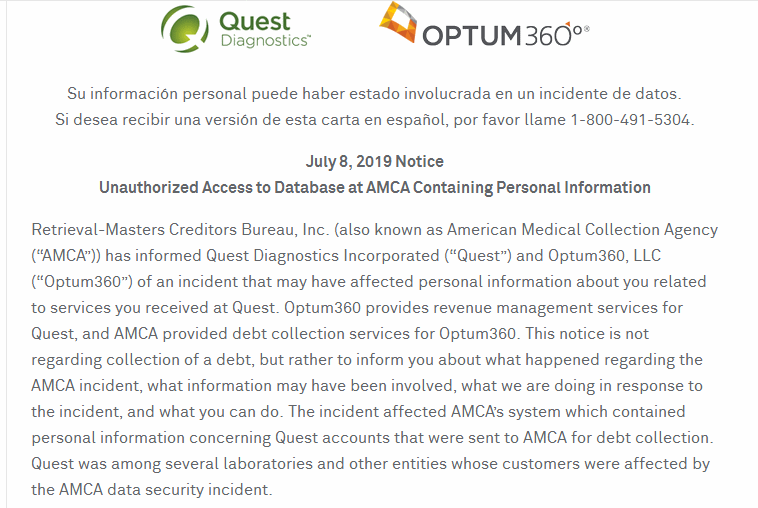
medical outpatient care industry. Recently it had a data breach
where confidential information was hacked, which took a toll on
confidence in the company. This resulted in a number of class
action lawsuits around June, 2019.
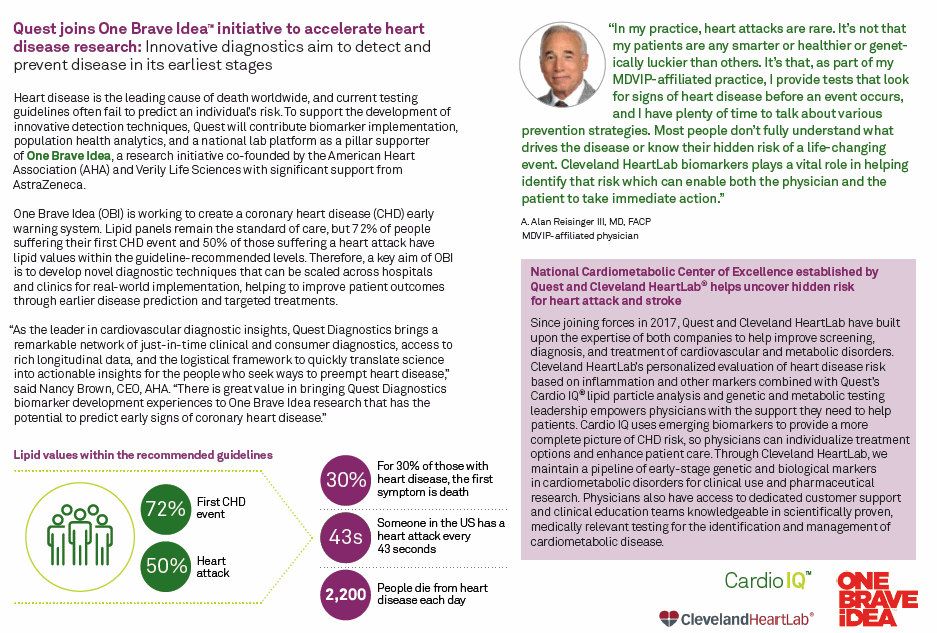
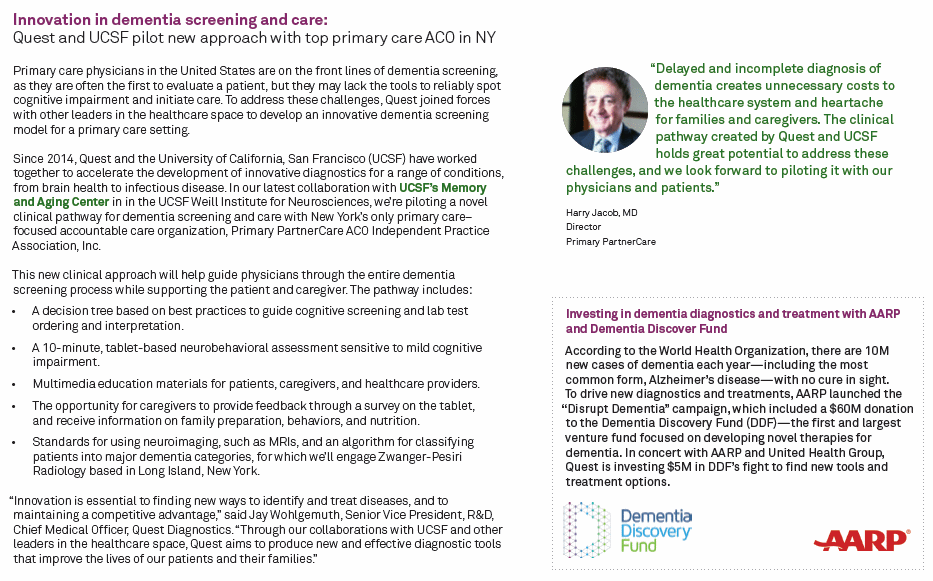
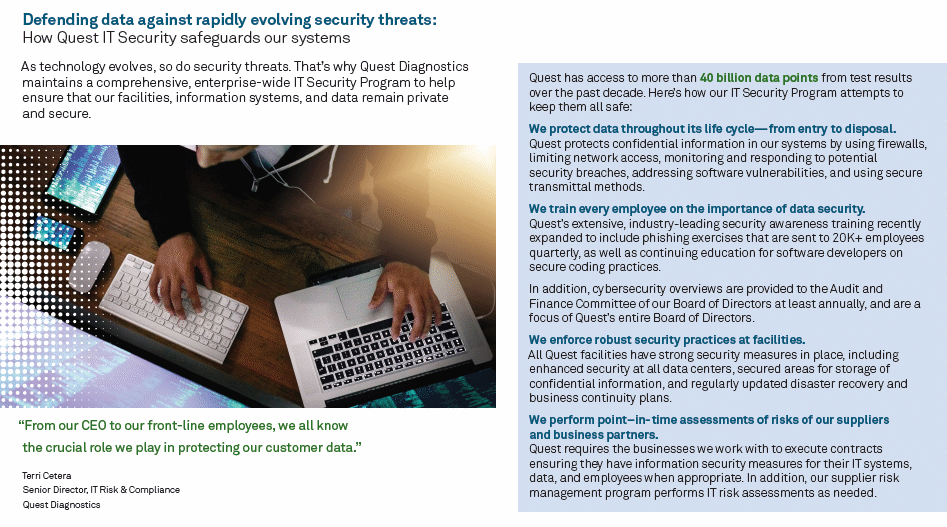
The company has developed and supplies a number of innovative
patented test procedures.
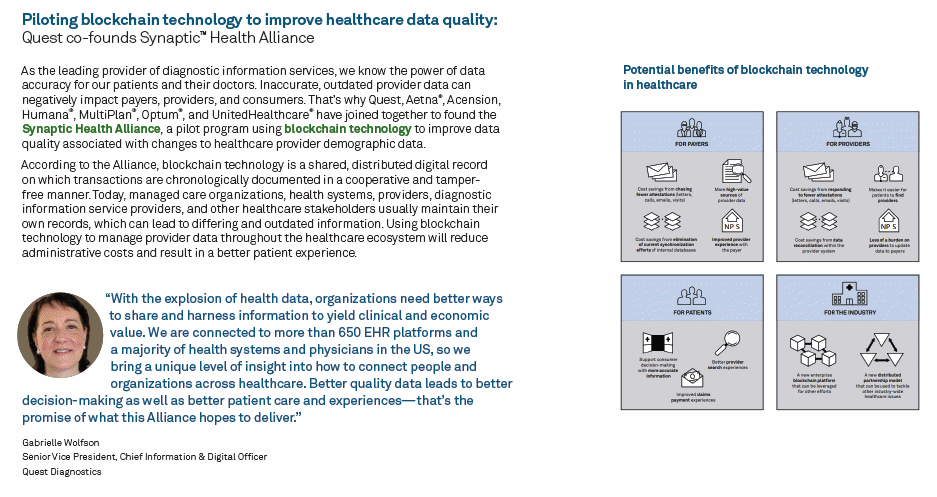
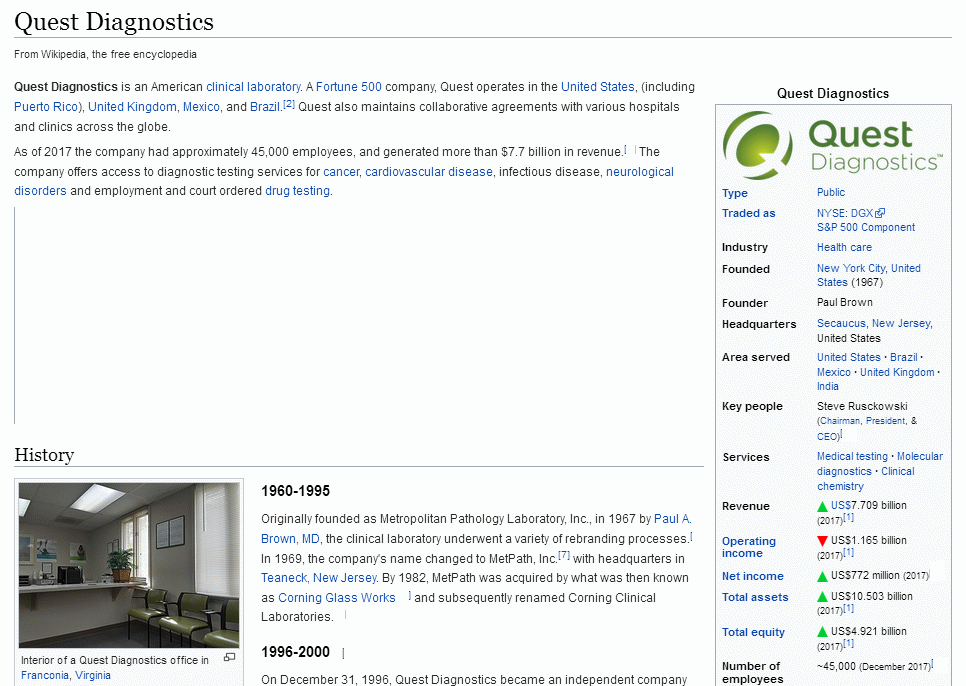
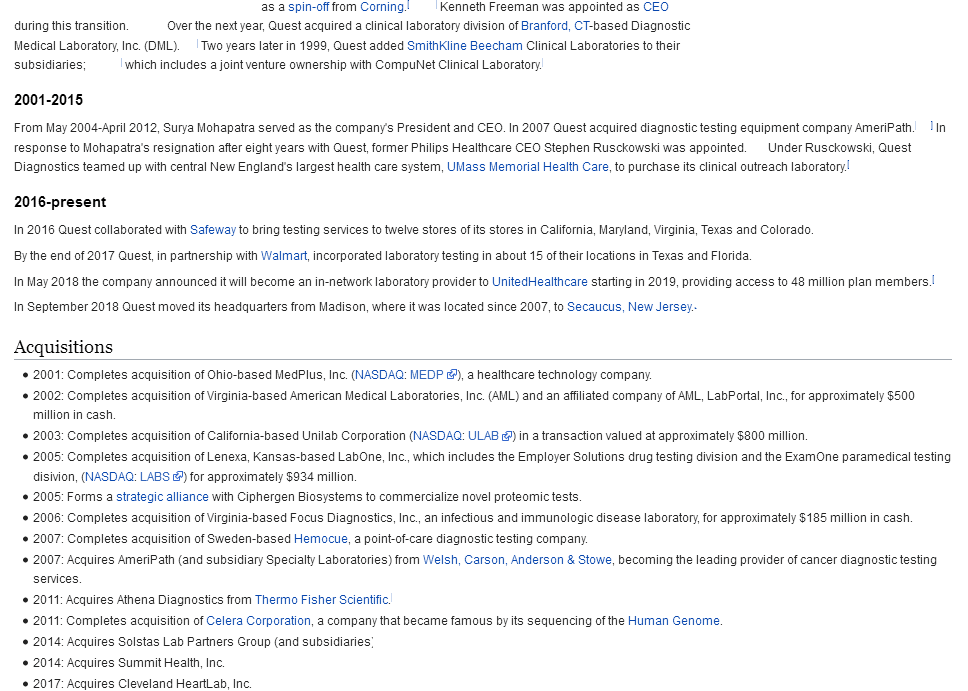
The company started as Metropolitan Pathology Laboratory Inc.
and was later acquired by Corning Glass Works, eventually being
spun off to what it is today after making three aggressive acquisitions.
Researchers are overwhelming not supportive of the stock but
analysts are more optimistic. The stock faces tough competition
from other testing labs which have received better stock reviews.
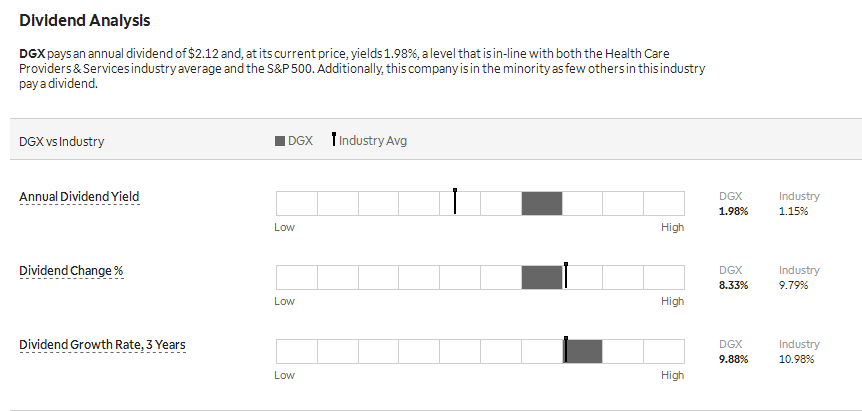
The stock pays an almost 2% dividend. It has a good website and
CEO letter and glitzy annual report indicating shareholder
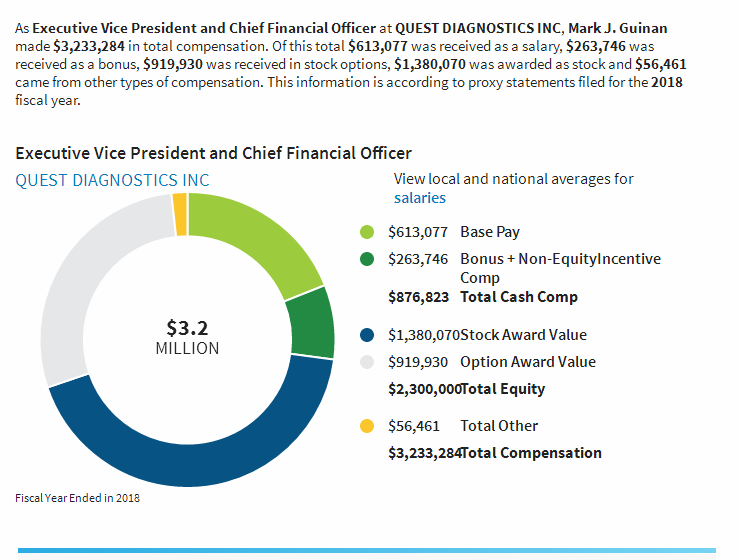
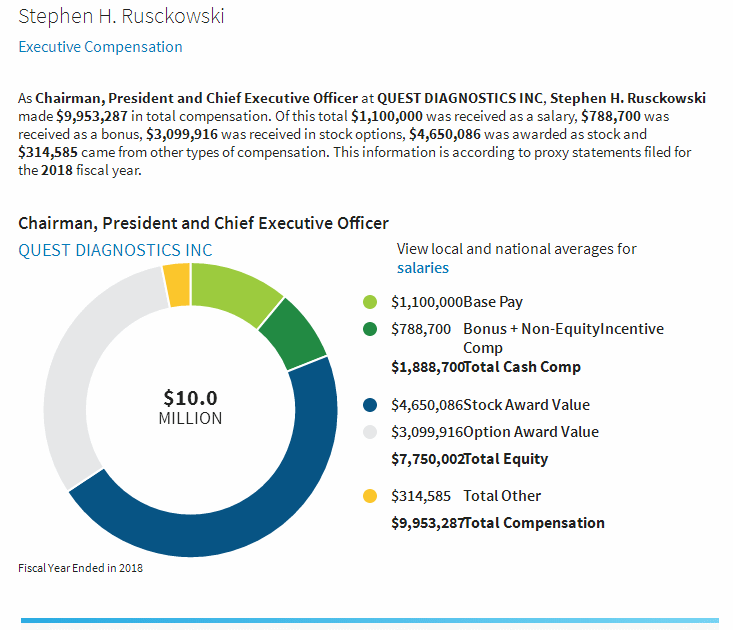
concern but management appears overpaid, particularly in view of
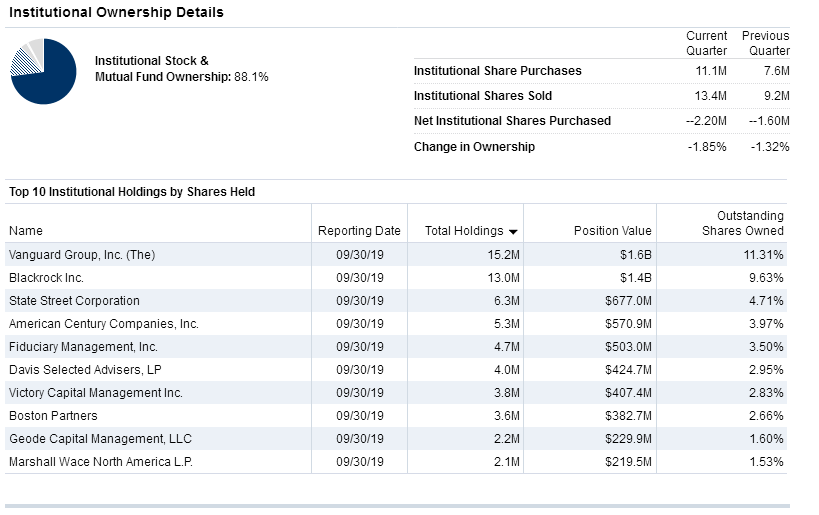
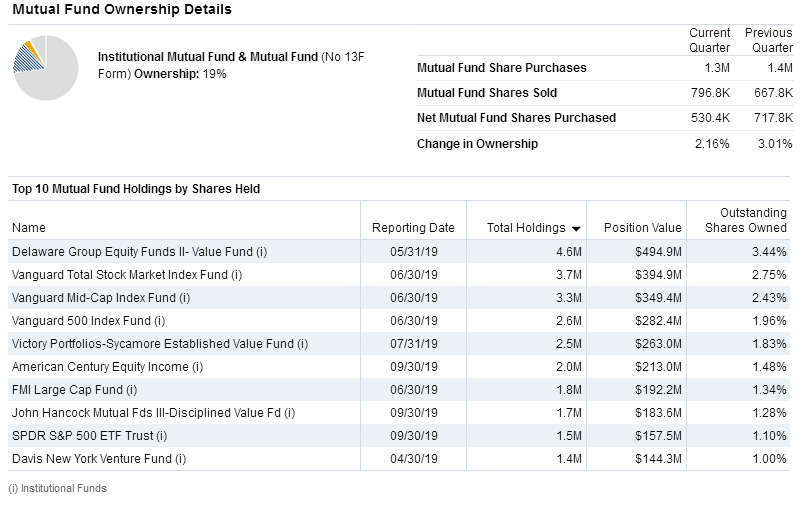
recent performance. Insiders and institutions are selling.
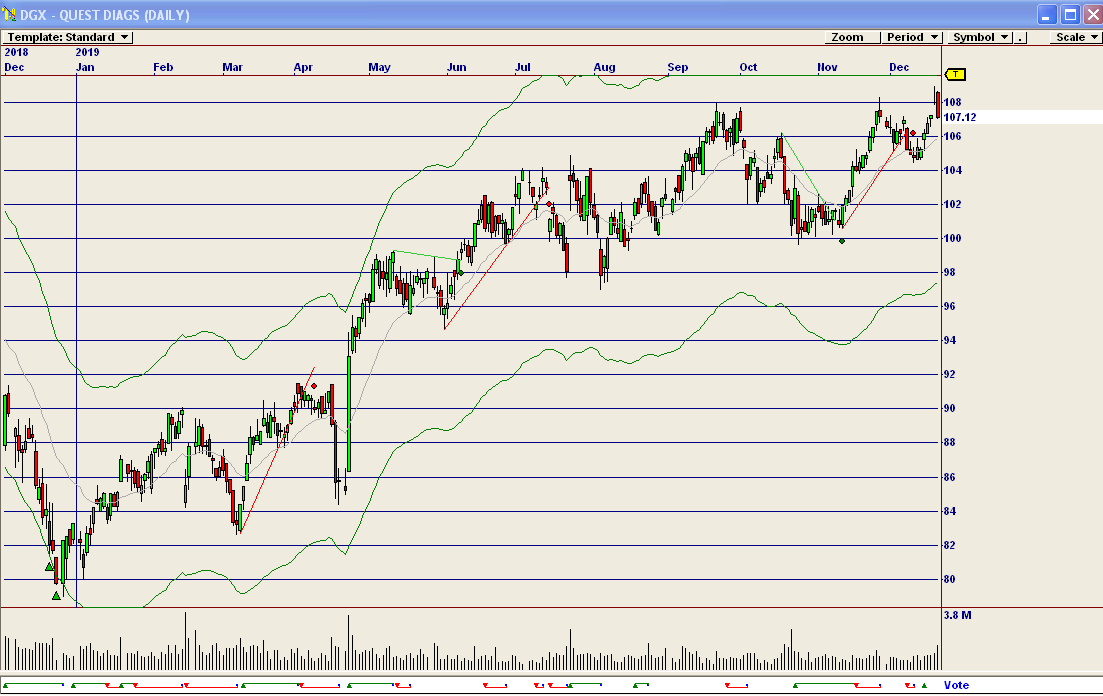
Some major stock swings with a cycle period of approximately
three months offers some trading opportunities. The stock is
considered "low risk" by several researchers. The main reason,
we think for a recent downswing was the data breach. This appears to
be the main reason why the stock lags some others in the same group, and
may be set to play "catch up."
(WAIT FOR PAGE TO LOAD COMPLETELY BEFORE LINKS WORK.)
Company Profile
Company History
News
Comparison with Peers
Bond Issue
Zenith Index
Financial Statements
Avg. P/E to Current P/E
Financial Ratios
Intrinsic Value (Disc. CashFlow)
Fair Value Estimator
Projected Earnings
Research Reports
Analysts' Opinions
Insider Activity
Institutional Activity
Sentiment
Short Interest
Standard & Poor's
Management's Discussion
Channel Potential
MACD Histogram
Intraday Chart
Val Idea
Stock Consultant
Point & Figure Chart
Wall Street Analyzer
Marketspace Chart
Time Series Forecast
Neural Network Prediction
Stock Options
Ultimate Trading Systems
Recommendation







Company Profile |

Company History |

News |
Comparison |
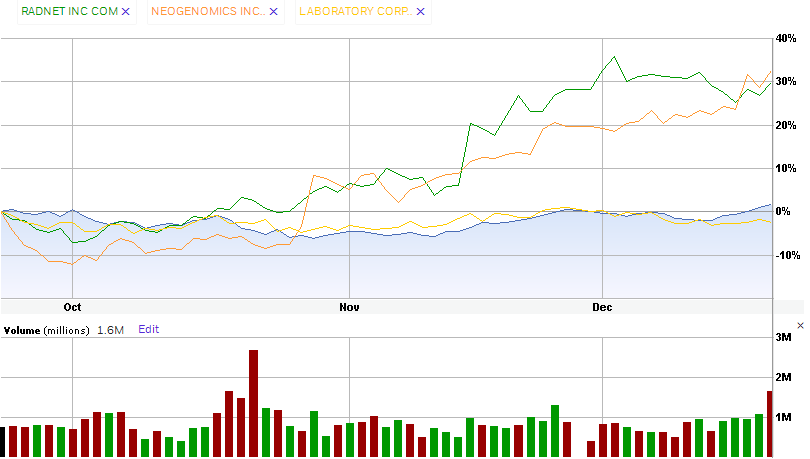
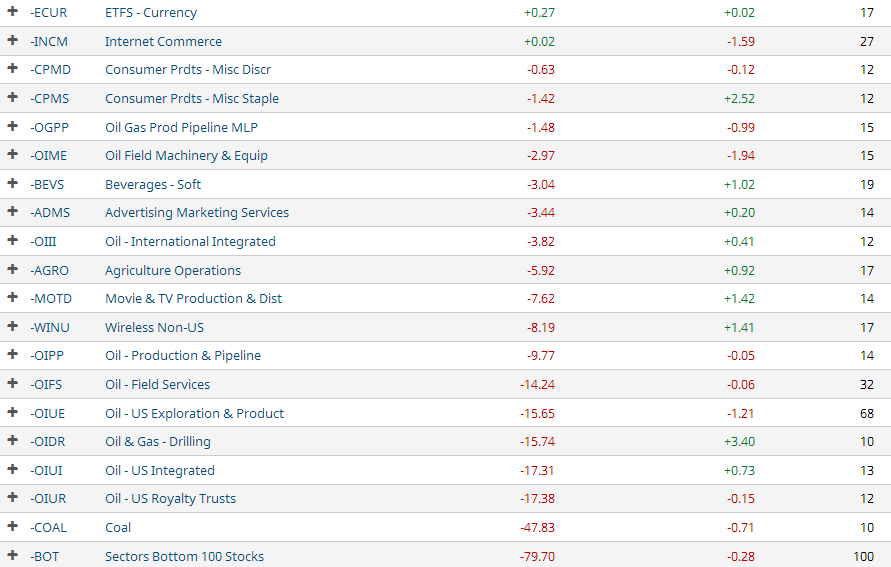
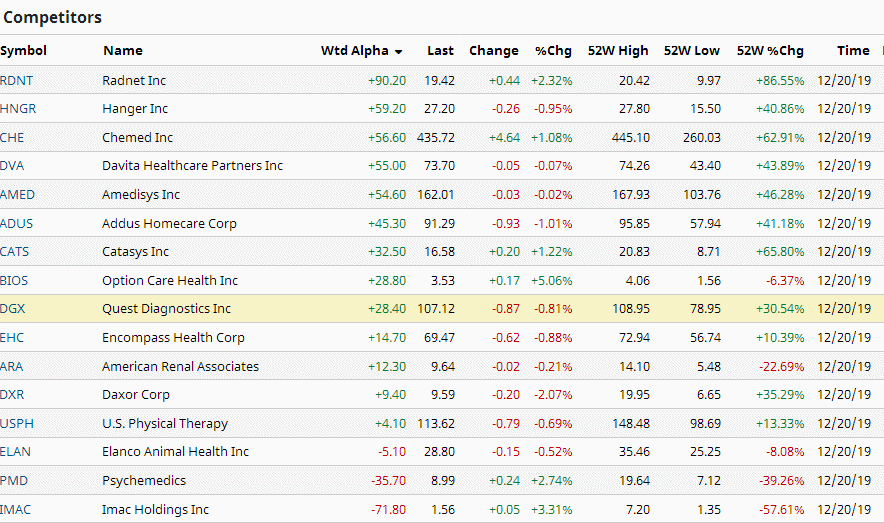
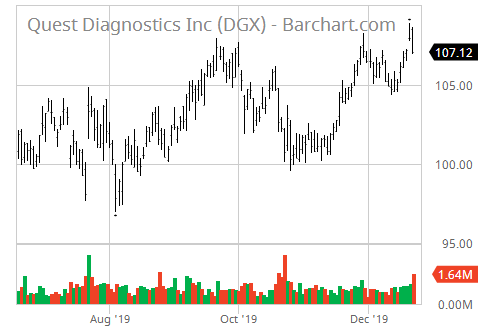
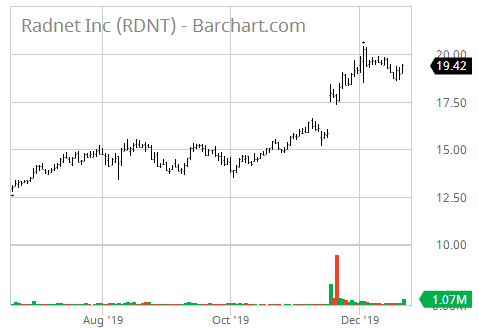
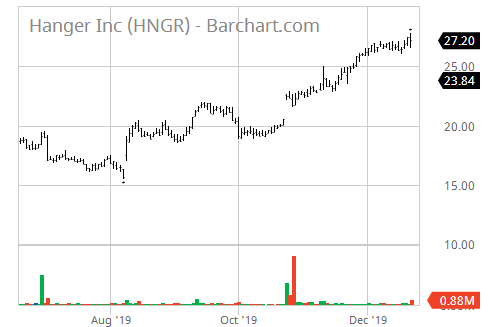
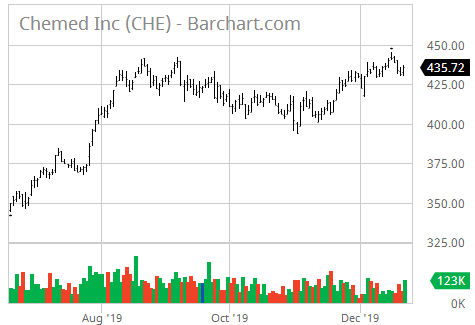
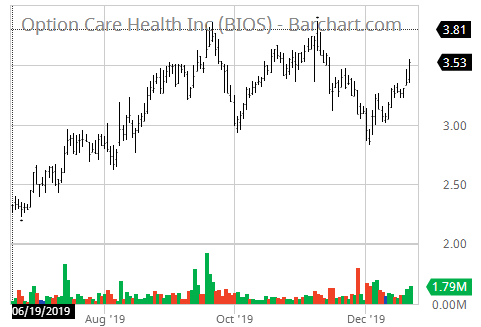
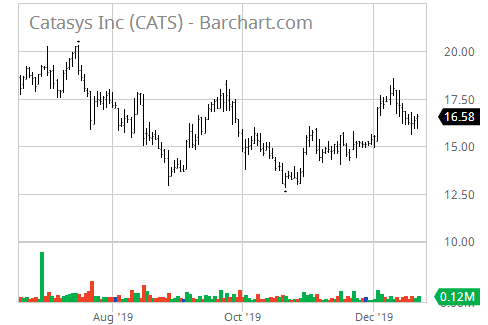
Similar Companies Performance:
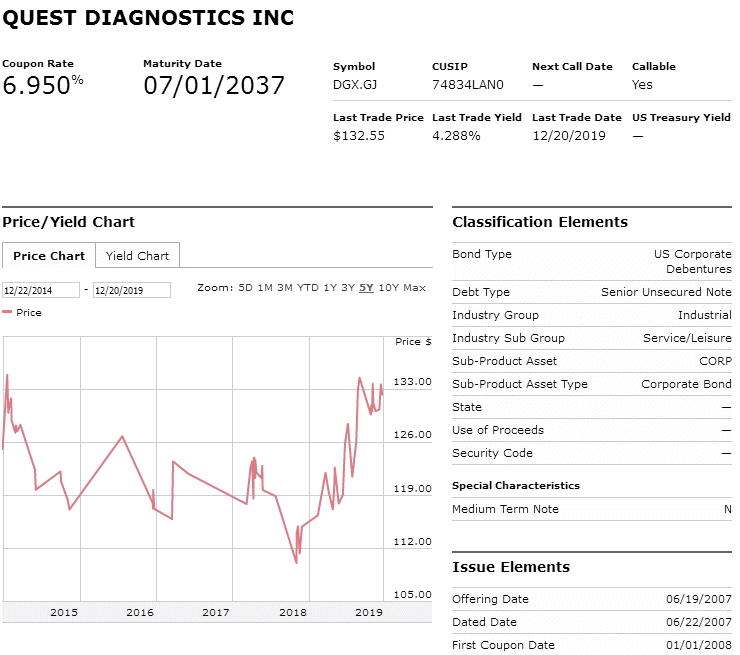
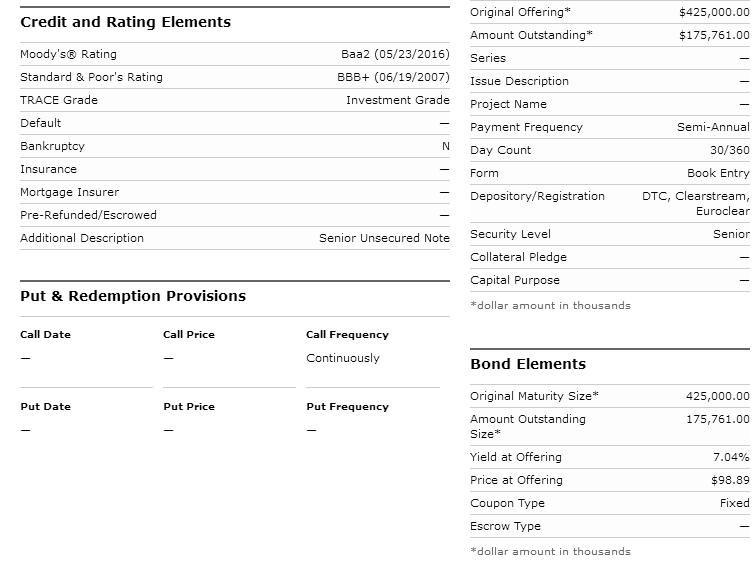
Bond Issue |
Zenith Index |
Under current market conditions, a Zenith Index Score of 1.20 or above is required for a positive rating on this factor. 1.21 -1.30 is considered acceptable, 1.30-1.40 is considered strong and
> 1.40 is considered exceptionally strong. Accounting statements in this section often contain mistakes, especially in earlier years' totals, but data is deemed sufficient for us to give a rating. More accurate financial statements follow in the next section.
Quest Diagnostics Incorporated (DGX)                      Exchange: NYSE
500 Plaza Drive
Secaucus, NJ 07094               Sector: Healthcare
United States                    Industry: Diagnostics & Research

Quest Diagnostics Incorporated provides diagnostic testing, information,
and services in the United States and internationally. The company
develops and delivers diagnostic testing information and services, such
as routine testing, non-routine and advanced clinical testing, anatomic
pathology testing, and other diagnostic information services. It offers
diagnostic information services primarily under the Quest Diagnostics
brand, as well as under the AmeriPath, Dermpath Diagnostics, Athena
Diagnostics, ExamOne, and Quanum brands to patients, clinicians,
hospitals, integrated delivery networks, health plans, employers, and
accountable care organizations through a network of laboratories,
patient service centers, phlebotomists in physician offices, call
centers and mobile paramedics, nurses, and other health and wellness
professionals. The company also offers risk assessment services for the
life insurance industry; and health information technology solutions for
healthcare organizations and clinicians. Quest Diagnostics Incorporated
has a strategic collaboration with hc1. The company was founded in 1967
and is headquartered in Secaucus, New Jersey.

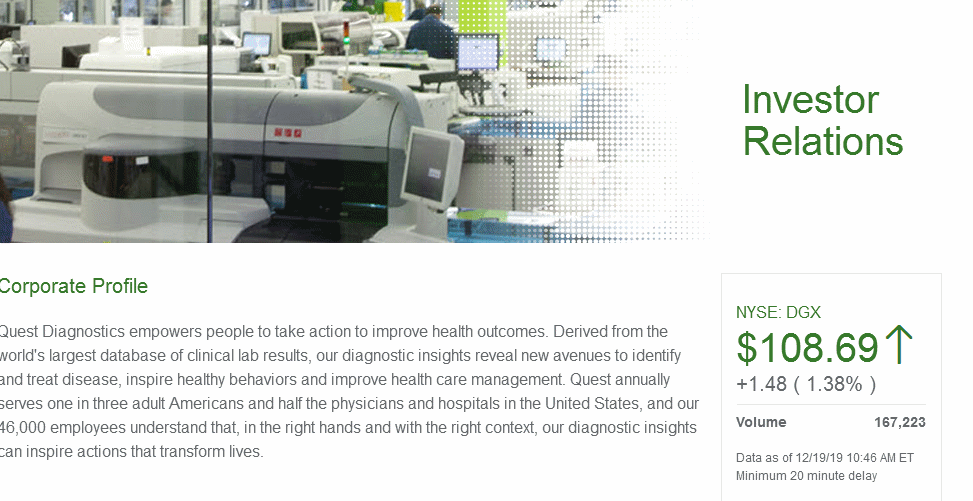
Last Trade: 107.99                           52-Week Range: 108.95 -  78.95
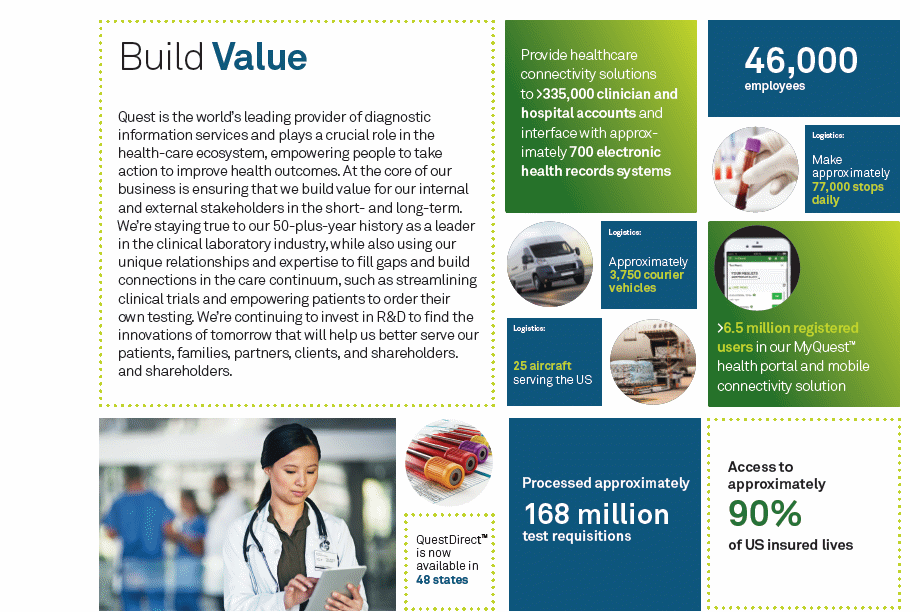
Employees: 46,000                            Avg.Volume:     868,475 Shares

Corporate Governance:
Pillar scores are Audit: 2; Board: 5; Shareholder Rights: 3; Compensation: 5.
         (A lower number means less governance risk.)

EPS:  5.33    Dividend Amount: $ 2.12          Yield:  1.96%
             Ex-Dividend Date: Jan 12, 2020    Payout Ratio:  40.85

Key Statistics:

    Trailing P/E:  20.11              Forward P/E (est.):  15.87
                                           Target Price: 109.81

Qrtly Stock Price Growth (yoy):  35.41%               Beta:   0.84
Qrtly S&P Index   Growth (yoy):   3.50%        Short Ratio:   4.43%
    Qrtly Revenue Growth (yoy):  52.00%         Shares Out:  134700000
   Qrtly Earnings Growth (yoy):   0.90%

          Book Value:  41.52                    Debt/Equity:  79.62%
    Price/Book Value:   2.58        Operating Profit Margin:  15.67%
         Price/Sales:   1.89                  Profit Margin:   9.58%
         Market Cap:  14,000,000,000       Return on Equity:  13.61%
    Enterprise Value:  18,800,000,000      Return on Assets:   6.50%

    Operating Cash Flow:      1,200,000
         Free Cash Flow:         -2,000


Annual Income Statement:                          (All numbers in thousands)
  Period Ending                             12/31/2018  12/31/2017  12/31/2016

  Total Revenue                              7,531,000   7,709,000   7,515,000
  Cost of Revenue                            4,926,000   4,719,000   4,616,000
  Gross Profit                               2,605,000   2,990,000   2,899,000

Operating Expenses:
  Research & Development                             0           0           0
  Selling, General & Administrative          1,424,000   1,750,000   1,681,000
  Total Operating Expenses                   1,500,000   1,825,000   1,740,000

Operating Income or Loss                     1,105,000   1,165,000   1,159,000

Income from Continuing Operations:
  Total Other Income/Expenses Net              -12,000      16,000      70,000
  Interest Expense                             169,000     153,000     144,000
  Income Before Taxes                          926,000   1,030,000   1,086,000
  Income Tax Expense                           182,000     241,000     429,000

Net Income from Continuing Op.s                788,000     824,000     696,000

Non-recurring Events:
  Extraordinary Items                           52,000      52,000      51,000
  Net Income                                   736,000     772,000     645,000

Net Income Avail to Common Shares              733,000     769,000     642,000


Annual Cash Flow Statement:                   (All numbers in thousands)
  Period Ending                         12/31/2018    12/31/2017    12/31/2016

  Net Income                               788,000       824,000       696,000

Operating Activities:
  Depreciation                             309,000       270,000       249,000
  Changes in Accounts Recv'bls             -65,000      -298,000      -343,000
  Changes in Liabilities                   817,000       923,000       776,000
  Changes in Inventories                         0             0             0
  Changes in other Oper'g Acts             -49,000      -316,000      -166,000

Total Cash Flow f Operations             1,200,000     1,175,000     1,069,000

Investing Activities:
  Capital Exenditures                     -383,000      -252,000      -293,000
  Investments                             -421,000      -581,000      -139,000
  Other Cash Flows fr Investing                  0             0             0

Total Cash Flows from Investing           -801,000      -805,000      -152,000

Financing Activities:
  Dividends Paid                          -266,000      -247,000      -223,000
  Sale of Purchase of Stock               -322,000      -322,000      -322,000
  Other Cash Flows fr Financing            -36,000       -33,000             0

Total Cash Flows from Financing           -401,000      -592,000      -691,000

Change in Cash & Cash Equiv.                -2,000      -222,000       226,000


Annual Balance Sheets:                              (All Numbers in Thousands)
  Period Ending                          12/31/2018    12/31/2017    12/31/2016
Current Assets:
  Cash & Cash Equivalents                   137,000       359,000       133,000
  Short Term Investments                          0             0             0
  Net Receivables                           924,000       926,000       901,000
  Inventory                                  95,000        82,000        84,000
  Other Current Assets                            0         9,000       176,000
  Total Current Assets                    1,306,000     1,531,000     1,501,000

  Long-Term Investments                   3,671,000     3,429,000     3,232,000
  Property, Plant & Equipt                1,145,000     1,029,000       925,000
  Goodwill                                6,335,000     6,000,000     5,905,000
  Intangible Assets                       1,119,000       949,000       984,000
  Other Assets                              136,000       148,000       174,000

Total Assets                             10,503,000    10,100,000     9,962,000

Current Liabilities:
  Accounts Payable                          224,000       261,000       279,000
  Current Portion LT Debt                   649,000       647,000       674,000
  Other Current Liabilities                       0             0             0
  Total Current Liabilities               1,057,000       981,000      1,173,000

  Long Term Debt                          3,748,000     3,728,000     3,492,000
  Other Liabilities                         663,000       654,000       514,000

Total Liabilities                         5,548,000     5,440,000     5,249,000

Stockholder Equity:
  Common Stock                                2,000         2,000         2,000
  Retained Earnings                       7,138,000     6,613,000     6,199,000
  Capital Surplus                           -48,000       -72,000       -38,000
  Total Stockholder Equity                4,921,000     4,628,000     4,684,000


Quest Diagnostics Incorporated (DGX)        [Indices near +3.0, near zero,
                                            or < zero bear special attention.]
P/E Ratio Tests:
P/E Ratio < 28?            1.3923          P/E Ratio > 5?             1.0000
P/E Ratio Vs Growth Rate:  1.2066          Forward P/E Ratio < 28?    1.7643
Price/Sales Ratio < 2.3?   1.2169          Inventory/Sales < 5%?      3.0000
Sales < $1 Billion?        0.1328          Operating Margin < 7.5%?   0.4786

Balance Sheet Tests:
Debt/Equity < 0.40?        0.5024          Long-Term Debt Service:    1.3220
LTD Being Reduced?        -3.0000          Short-Term Debt Service:   0.0000
Current Ratio > 2?         0.6178          Working Capital >= 1.5?    1.2302
Leverage Ratio < 20%?      0.0697          Debt/Assets < 1?           2.8023
Quick Ratio > 1?           3.0000          Inventory Turnover > 1?    0.0633
Share Equity Increase:     2.0514          Market Cap.< 1.5 Billion?  0.1071
                                           Intangibles < 3% Assets?   0.0423
Income Tests:
Profit Margin < 7.5%?      1.2773          EPS Annual Growth > 10%?   0.1049
Dividend Yield > 2.0%?     1.0204          EPS 3-yr Growth > 15?      0.1314
Enterprise Value/Revenue   1.8595          EPS Growth Consistent?     0.0000
Enterprise Value/EBITDA:   3.0000          Collection < 45 days?      1.0048
EPS Qrtly Growth > 10%?    0.1111          Gross Pft/Cur. LTD > 1?    3.0000
                                           Borrowing Int. Rate < 6%?  1.3307
Stock Performance Tests:
Volatility > 25%?          1.1014          % Held by Insiders < 5%?   3.0000
Beta > 1.25?               0.6720          % Held by Institut. < 50?  0.5376
50 Da MA > 200 Da MA?      0.0500          % Held by Institut. > 30?  3.0000
52-Wk Change vs. S&P 500:  0.6810          Short Ratio > 5?           0.8860
Price/Book Value < 3?      3.0000          Short % of Float > 20?     0.1510
Return on Assets > 17%?    0.3824          Average Volume > 100,000?  3.0000

Cash Flow Tests:
Oper. C.F. > Lever'd C.F: -3.0000          Positive Free Cash Flow?  -1.0000
Positive Oper. Cash Flow?  3.0000          Price to C.F.Ratio < 14?:  2.4020
                                           Cash Flow / Assets > 10%?  2.2870

DGX    Quest Diagnostics Incorporated      Overall Zenith Index:      1.0619
Financial Statements |
QUEST DIAGNOSTICS INC (DGX) INCOME STATEMENT Fiscal year ends in December. USD in thousand 2014-12 2015-12 2016-12 2017-12 2018-12 TTM Revenue 7,435,000 7,493,000 7,515,000 7,709,000 7,531,000 7,639,000 Cost of revenue 4,637,000 4,657,000 4,616,000 4,719,000 4,926,000 5,008,000 Gross profit 2,798,000 2,836,000 2,899,000 2,990,000 2,605,000 2,631,000 Operating expenses Sales, General and administrative 1,728,000 1,679,000 1,681,000 1,750,000 1,424,000 1,464,000 Other operating expenses 87,000 92,000 59,000 75,000 76,000 75,000 Total operating expenses 1,815,000 1,771,000 1,740,000 1,825,000 1,500,000 1,539,000 Operating income 983,000 1,065,000 1,159,000 1,165,000 1,105,000 1,092,000 Interest Expense 167,000 154,000 144,000 153,000 169,000 179,000 Other income (expense) 33,000 192,000 71,000 18,000 -10,000 2,000 Income before taxes 849,000 1,103,000 1,086,000 1,030,000 926,000 915,000 Provision for income taxes 262,000 373,000 429,000 241,000 182,000 215,000 Other income 0 23,000 39,000 35,000 44,000 60,000 Net income from continuing operations 587,000 753,000 696,000 824,000 788,000 760,000 Net income from discontinuing ops 5,000 0 0 0 0 0 Other -36,000 -44,000 -51,000 -52,000 -52,000 -28,000 Net income 556,000 709,000 645,000 772,000 736,000 732,000 Preferred dividend 2,000 3,000 3,000 3,000 3,000 3,000 Net income available to common shareholders 554,000 706,000 642,000 769,000 733,000 729,000 Earnings per share Basic 3.83 4.92 4.58 5.63 5.39 5.41 Diluted 3.81 4.87 4.51 5.50 5.29 5.34 Weighted average shares outstanding Basic 145,000 144,000 140,000 137,000 136,000 135,250 Diluted 145,000 145,000 142,000 140,000 139,000 136,750 ____________________________________________________________________________________________________________________________________________ QUEST DIAGNOSTICS INC (DGX) BALANCE SHEET Fiscal year ends in December. USD in thousand 2014-12 2015-12 2016-12 2017-12 2018-12 Assets Current assets Cash Total cash 192,000 133,000 359,000 137,000 135,000 Receivables 932,000 901,000 926,000 924,000 1,012,000 Inventories 110,000 84,000 82,000 95,000 99,000 Deferred income taxes 169,000 0 0 0 0 Prepaid expenses 200,000 207,000 155,000 150,000 144,000 Other current assets 0 176,000 9,000 0 0 Total current assets 1,603,000 1,501,000 1,531,000 1,306,000 1,390,000 Non-current assets Property, plant and equipment Gross property, plant and equipment 3,126,000 3,232,000 3,429,000 3,671,000 3,970,000 Accumulated Depreciation -2,193,000 -2,307,000 -2,400,000 -2,526,000 -2,682,000 Net property, plant and equipment 933,000 925,000 1,029,000 1,145,000 1,288,000 Equity and other investments 0 473,000 443,000 462,000 436,000 Goodwill 6,032,000 5,905,000 6,000,000 6,335,000 6,563,000 Intangible assets 1,071,000 984,000 949,000 1,119,000 1,207,000 Other long-term assets 238,000 174,000 148,000 136,000 119,000 Total non-current assets 8,274,000 8,461,000 8,569,000 9,197,000 9,613,000 Total assets 9,877,000 9,962,000 10,100,000 10,503,000 11,003,000 Liabilities and stockholders' equity Liabilities Current liabilities Short-term debt 518,000 159,000 6,000 107,000 562,000 Accounts payable 257,000 279,000 261,000 224,000 222,000 Taxes payable 63,000 4,000 3,000 9,000 17,000 Accrued liabilities 767,000 674,000 647,000 649,000 599,000 Other current liabilities 104,000 57,000 64,000 68,000 85,000 Total current liabilities 1,709,000 1,173,000 981,000 1,057,000 1,485,000 Non-current liabilities Long-term debt 3,244,000 3,492,000 3,728,000 3,748,000 3,429,000 Minority interest 29,000 29,000 32,000 34,000 51,000 Other long-term liabilities 594,000 584,000 731,000 743,000 822,000 Total non-current liabilities 3,867,000 4,105,000 4,491,000 4,525,000 4,302,000 Total liabilities 5,576,000 5,278,000 5,472,000 5,582,000 5,787,000 Stockholders' equity Common stock 2,000 2,000 2,000 2,000 2,000 Additional paid-in capital 2,418,000 2,481,000 2,545,000 2,612,000 2,667,000 Retained earnings 5,723,000 6,199,000 6,613,000 7,138,000 7,602,000 Treasury stock -3,815,000 -3,960,000 -4,460,000 -4,783,000 -4,996,000 Accumulated other comprehensive income -27,000 -38,000 -72,000 -48,000 -59,000 Total stockholders' equity 4,301,000 4,684,000 4,628,000 4,921,000 5,216,000 Total liabilities and stockholders' equity 9,877,000 9,962,000 10,100,000 10,503,000 11,003,000 ____________________________________________________________________________________________________________________________________________ QUEST DIAGNOSTICS INC (DGX) Statement of CASH FLOW Fiscal year ends in December. USD in thousand 2014-12 2015-12 2016-12 2017-12 2018-12 TTM Cash Flows From Operating Activities Net income 592,000 753,000 696,000 824,000 788,000 780,000 Depreciation & amortization 314,000 304,000 249,000 270,000 309,000 328,000 Deferred income taxes 23,000 112,000 37,000 9,000 73,000 36,000 Stock based compensation 51,000 52,000 69,000 79,000 61,000 52,000 Change in working capital -326,000 -375,000 -166,000 -316,000 -49,000 20,000 Accounts receivable -312,000 -262,000 -343,000 -298,000 -65,000 -12,000 Accounts payable 68,000 -31,000 56,000 -8,000 -19,000 10,000 Income taxes payable -84,000 -41,000 42,000 16,000 4,000 14,000 Other working capital 2,000 -41,000 79,000 -26,000 31,000 8,000 Other non-cash items 284,000 -36,000 184,000 309,000 18,000 -26,000 Net cash provided by operating activities 938,000 810,000 1,069,000 1,175,000 1,200,000 1,190,000 Cash Flows From Investing Activities Investments in property, plant, and equipmen -308,000 -263,000 -293,000 -252,000 -383,000 -379,000 Acquisitions, net -728,000 -100,000 131,000 -555,000 -419,000 -256,000 Sales/Maturities of investments 11,000 1,000 10,000 2,000 1,000 0 Other investing activities 0 0 0 0 0 -22,000 Net cash used for investing activities -1,025,000 -362,000 -152,000 -805,000 -801,000 -657,000 Cash Flows From Financing Activities Debt issued 2,018,000 2,453,000 1,869,000 205,000 2,090,000 1,944,000 Debt repayment -1,647,000 -2,537,000 -1,724,000 -182,000 -1,966,000 -1,749,000 Common stock repurchased -132,000 -224,000 -590,000 -465,000 -322,000 -325,000 Excess tax benefit from stock based compe 0 5,000 0 0 0 0 Dividend paid -187,000 -212,000 -223,000 -247,000 -266,000 -283,000 Other financing activities 40,000 8,000 -23,000 97,000 63,000 51,000 Net cash provided by (used for) financing 92,000 -507,000 -691,000 -592,000 -401,000 -362,000 Net change in cash 5,000 -59,000 226,000 -222,000 -2,000 171,000 Cash at beginning of period 187,000 192,000 133,000 359,000 137,000 263,000 Cash at end of period 192,000 133,000 359,000 137,000 135,000 434,000 Free Cash Flow Operating cash flow 938,000 810,000 1,069,000 1,175,000 1,200,000 1,190,000 Capital expenditure -308,000 -263,000 -293,000 -252,000 -383,000 -379,000 Free cash flow 630,000 547,000 776,000 923,000 817,000 811,000 ____________________________________________________________________________________________________________________________________________
Average to Current P/E Ratios |
              (DGX)     Quest Diagnostics Inc.

                               2014    2015    2016    2017    2018

          Annual Earnings:     3.82    4.87    4.52    5.49    5.27
Average Price During Year:    58.26   71.30   77.34  100.35  104.24

                P/E Ratio:    15.25   14.64   17.11   18.28   19.78

 Average 5-Year P/E Ratio  =  17.01
             Current Price =  107.12

Previous 5 Quarter Earnings:   1.53    0.92    1.20    1.66    1.56

          Current Annualized (Last Four Quarters) Earnings =   4.42
                                                           ________
                                 Average PE / Current PE =     0.70
                                                           --------

                                      ...a number above 1.00 is good
                                                1.00 or below is bad
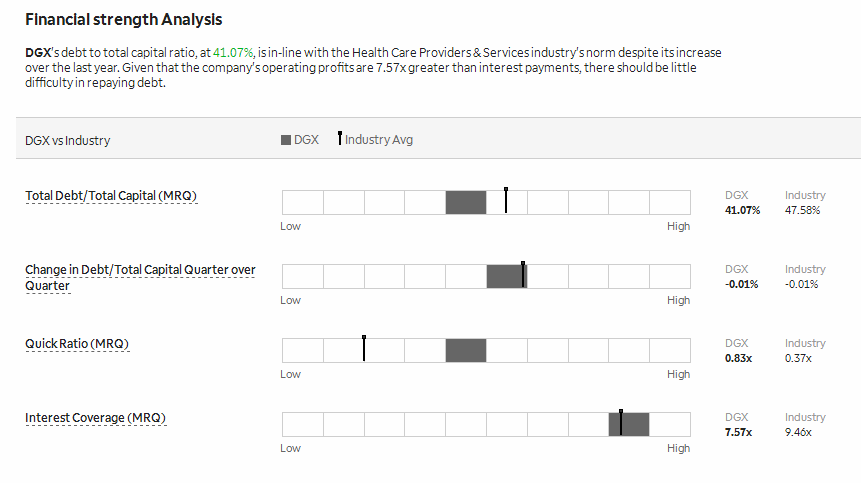
Financial Ratios |
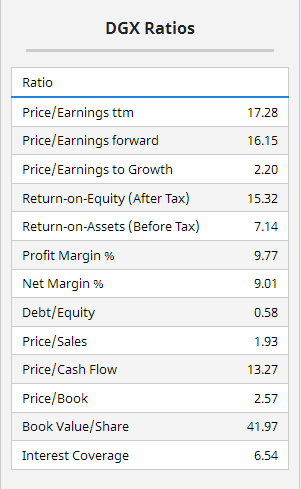
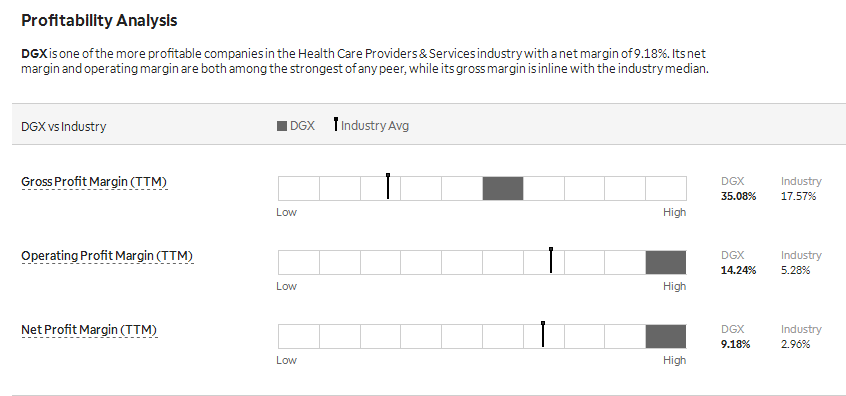
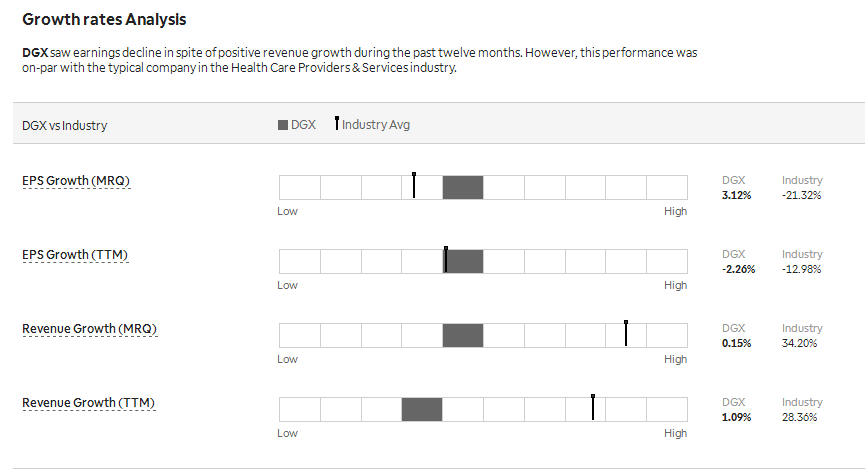
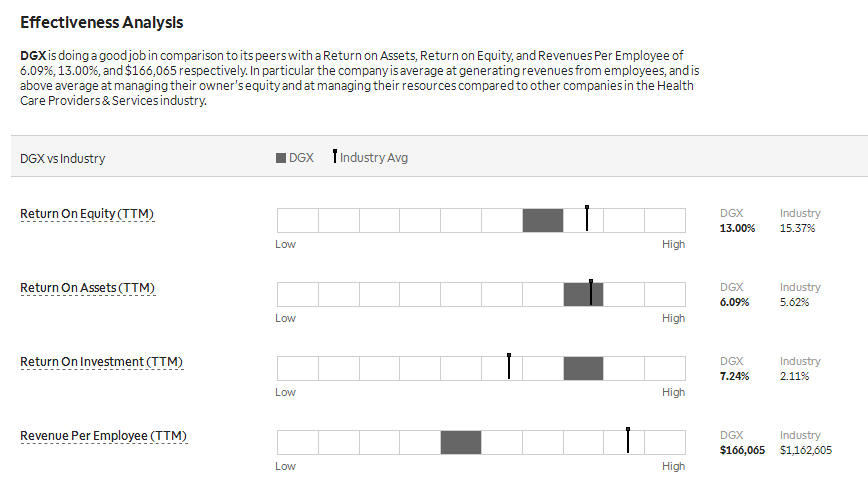
. . . . . . . . . . . . Lowest to Highest, Compared to Industry
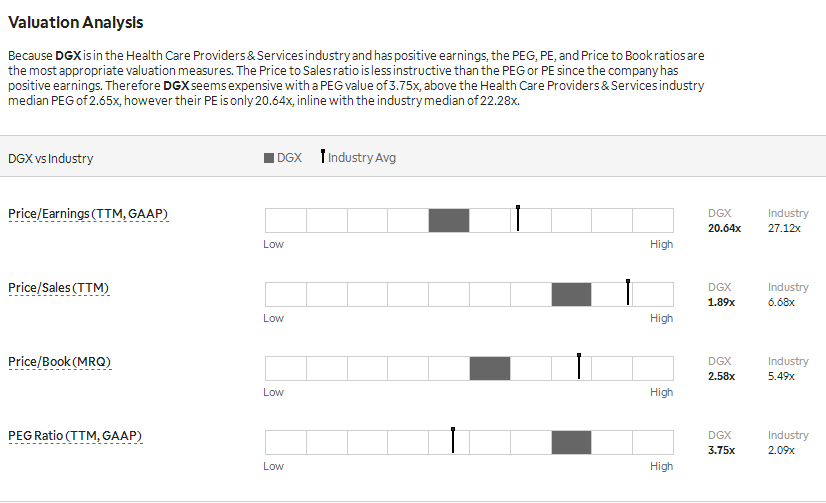
Intrinsic Value (DCF) |
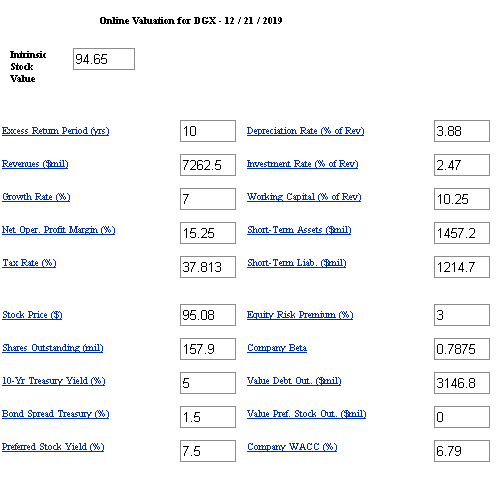
Intrinsic Value by Discounted Cash Flow Method:
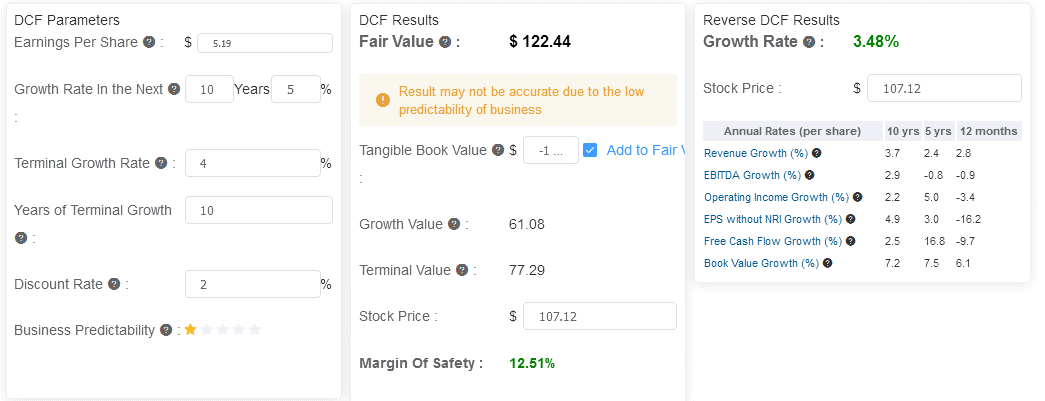
Fair Value Estimator |
Fair Value Estimate:
Projected Earnings |

Research Reports |
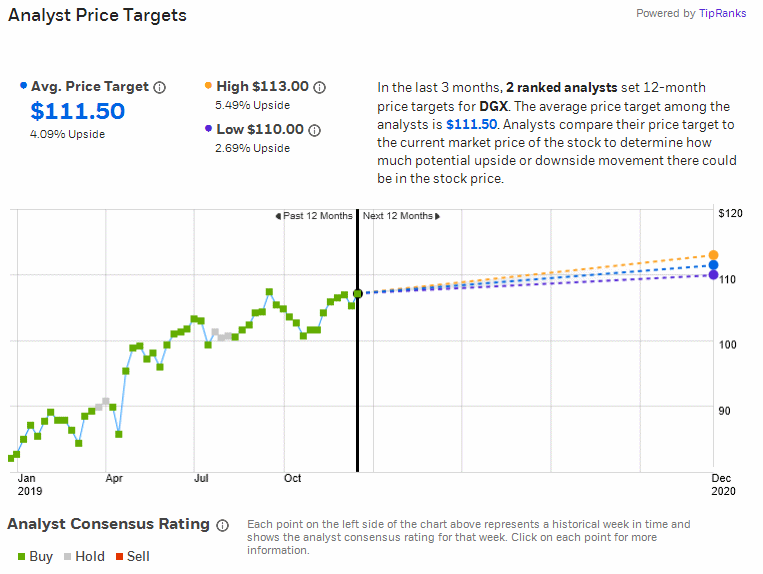
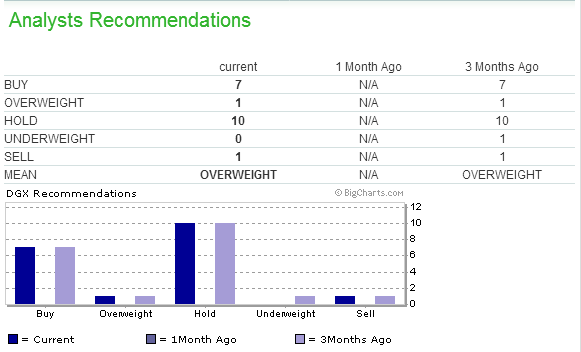
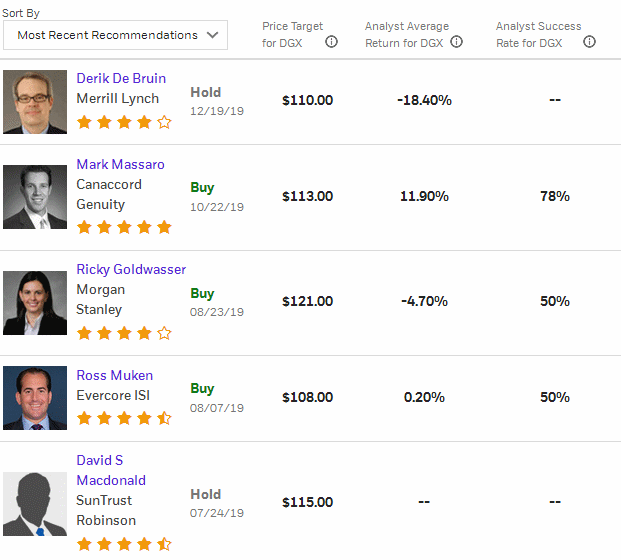
Analysts' Opinions |

Insider Activity |
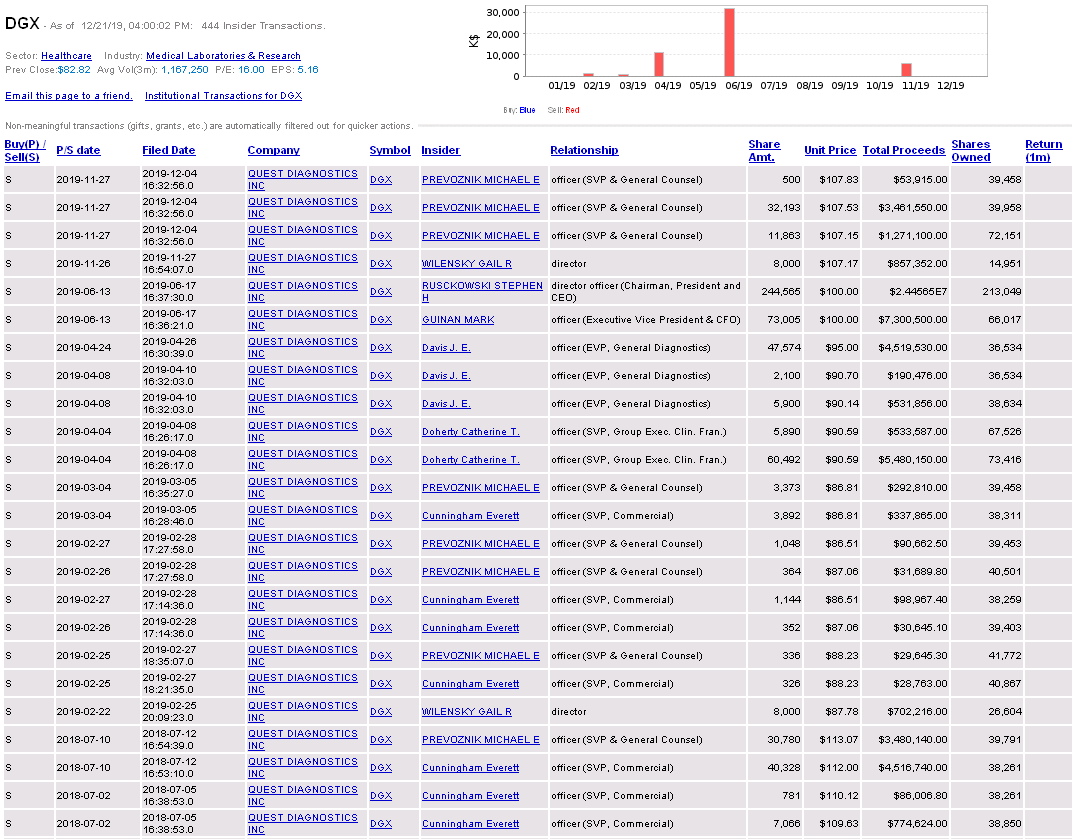
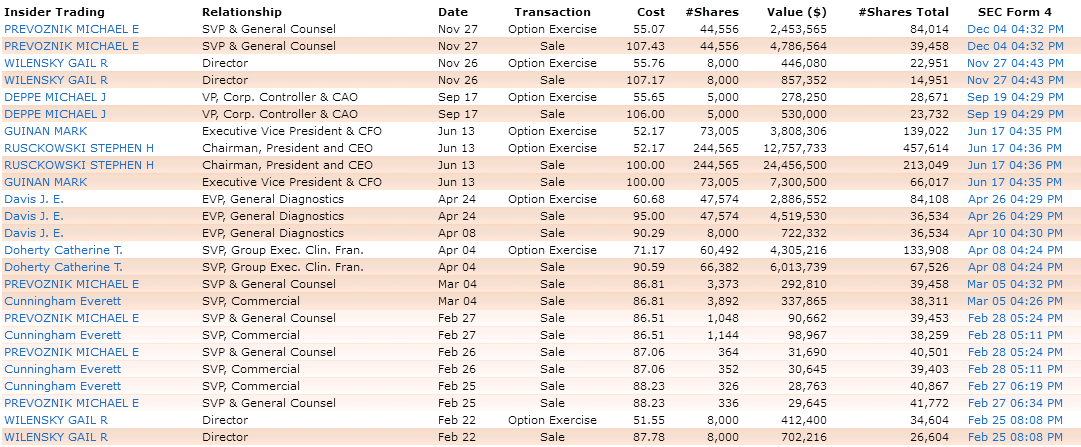
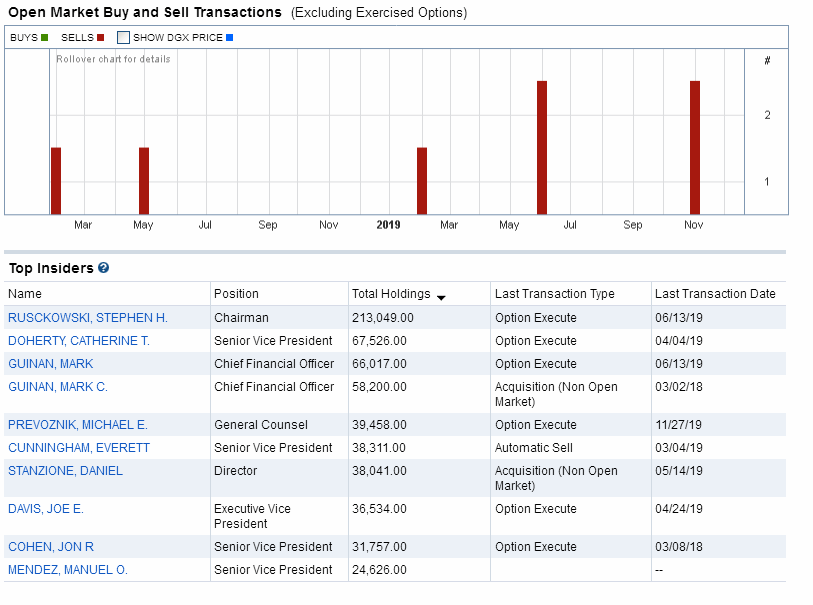
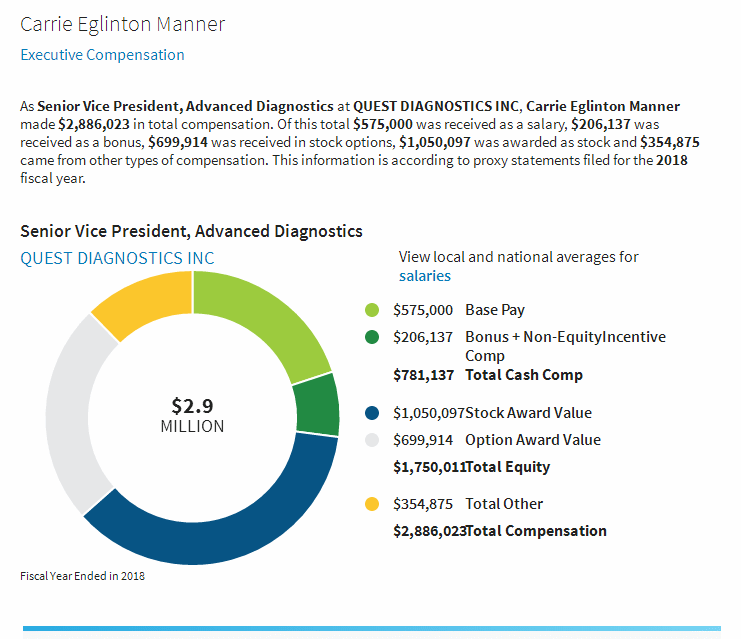
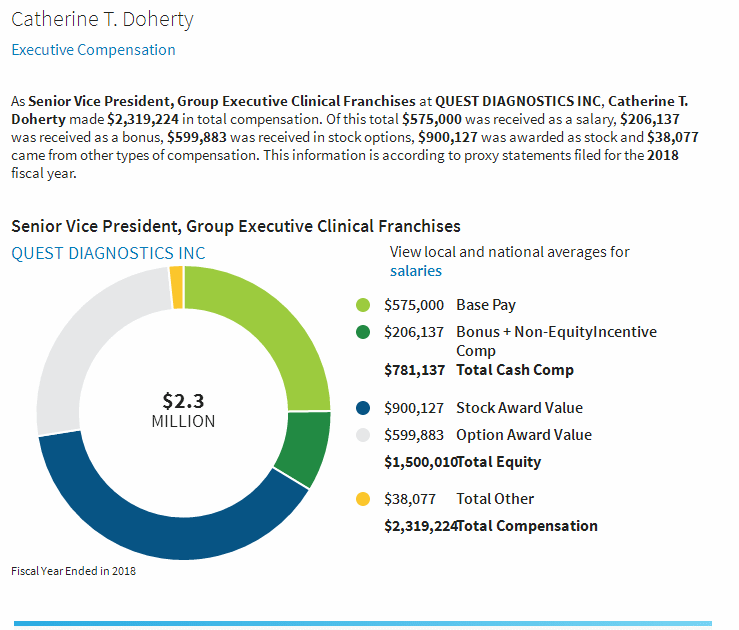
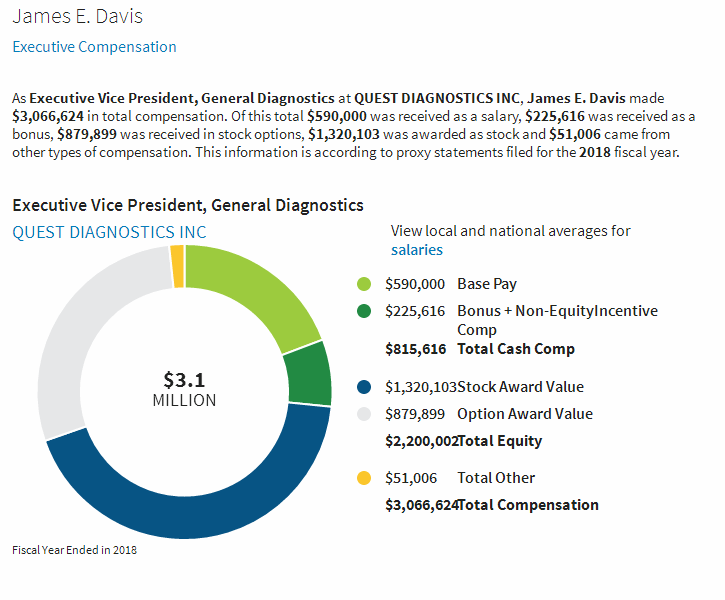
Institutional Activity |
Institutional Ownership:
Sentiment |
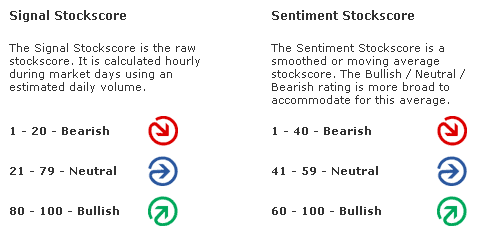
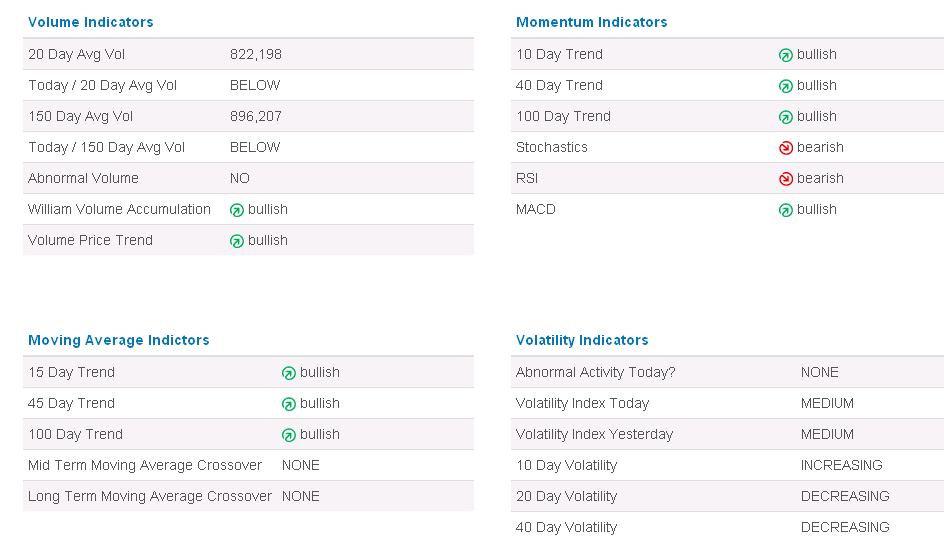
Zenith uses the "sentiment" score above or below 50 to award a positive or negative point in the Decision Matrix.


Short Interest Ratio |
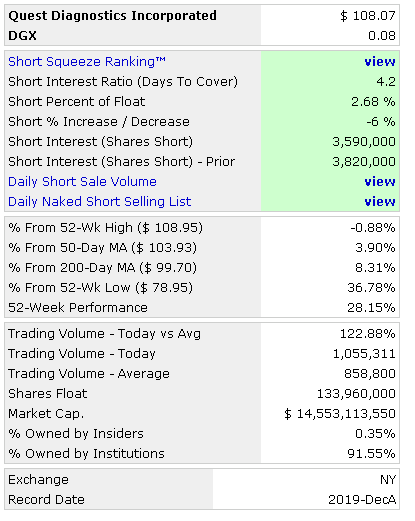
As the short interest rises as a percentage of average daily share volume (Days to Cover), this is considered a measure of negative sentiment. Similarly, a decrease in that percentage is considered positive sentiment.

Standard & Poor's |
Management's Discussion of Results of Operations Excerpts |
Channeling Potential |
The summary below includes a value for `Degree,' which refers on a
scale of 1 to 10 the range of a channel in the period under consi-
deration compared to the total range of price movement. It also looks
for the last closing price to be within the channel, otherwise zeroed.
The `Index' is the `Degree' weighted for volatility.  Generally, the
the higher the index, the more suitable is the stock for trading as
a `rolling stock' between channel high and low points.

Results for QUEST DIAGNOSTICS INC.:
Symbol? DGX
Total Months Available:  25
       Months in Cycle?   4

Months Covered by Periods:  12

Period 1           Period 2          Period 3
   H1      L1        H2      L2        H3      L3
  91.53   78.95    104.90   86.32    108.30   99.57

RANGE   = 108.30  TO   78.95            Close = 107.99
CHANNEL =  99.57  TO   91.53           Degree =   3
Volatility =   7.45%                    Index =   2
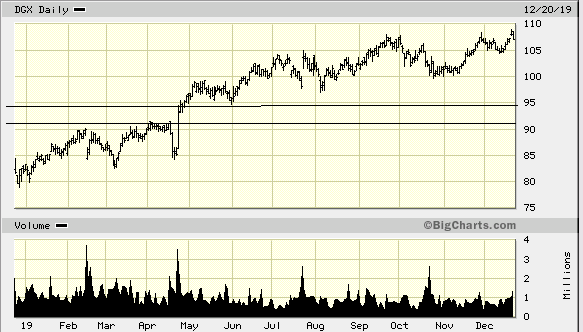
MACD Histogram Divergence |
The theory is that connecting the two most recent peaks or valleys of the MACD histogram will signal the direction of the next major move.
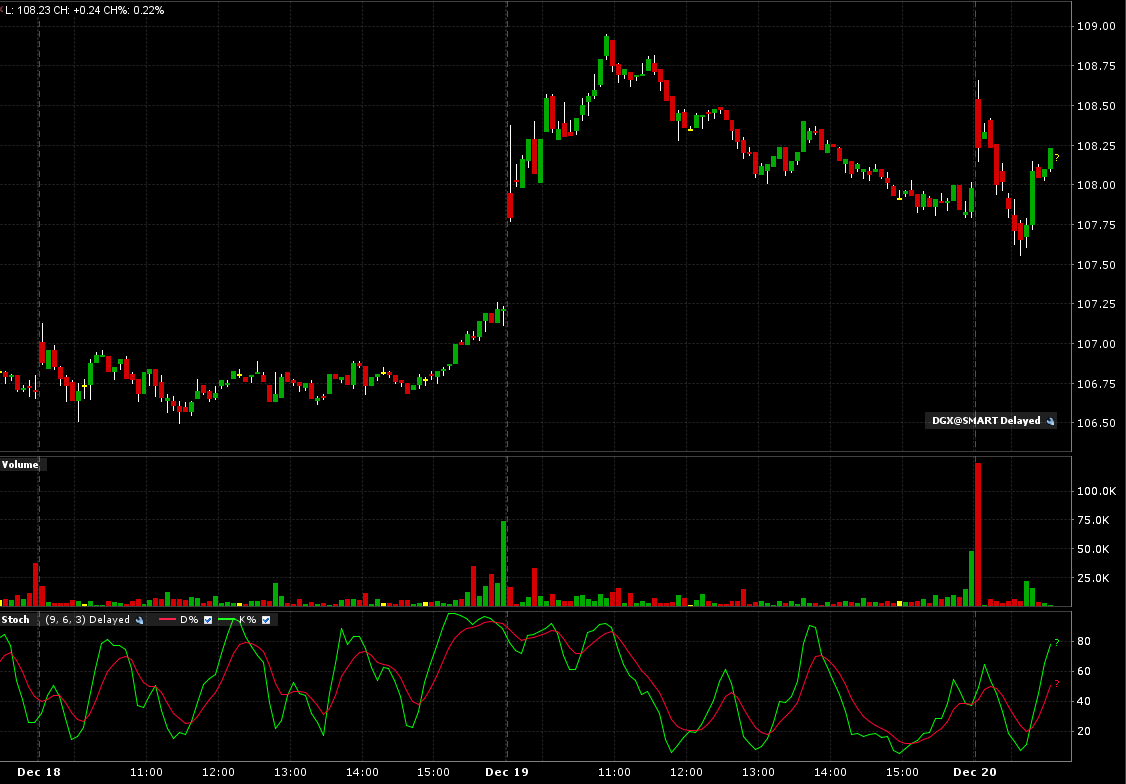
Intraday Chart |
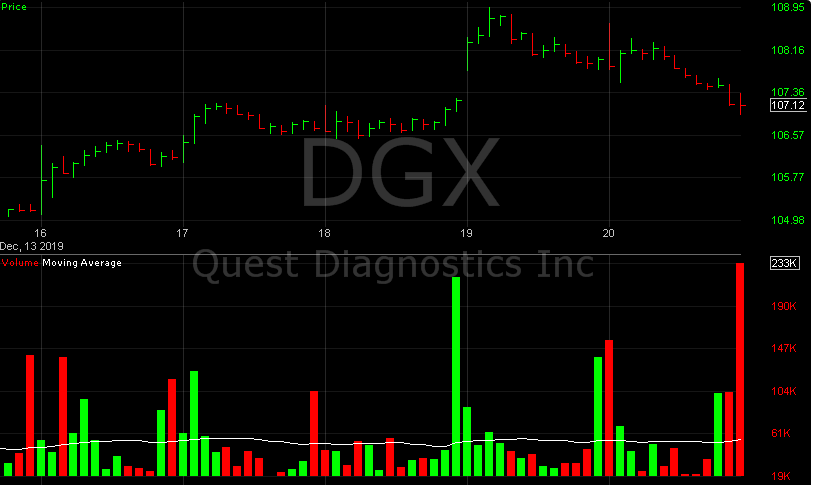
2 Days:
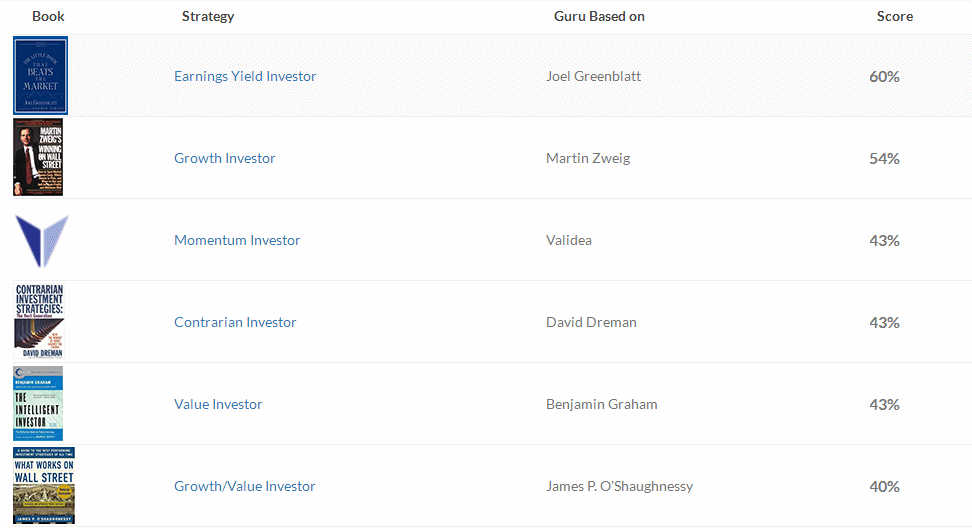
Val Idea |
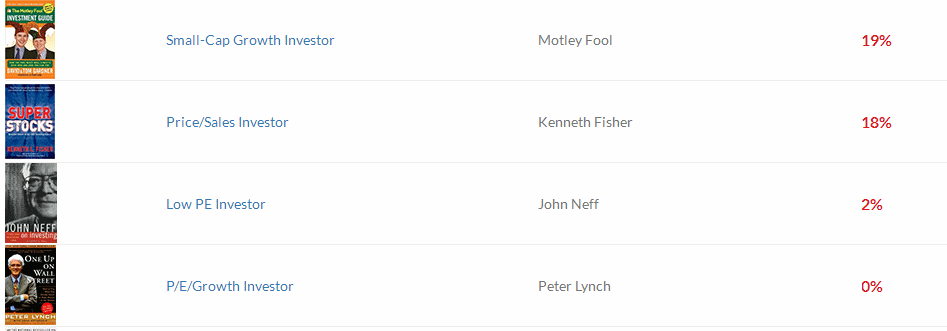
2 out of 10 favorable, (negative opinion.)
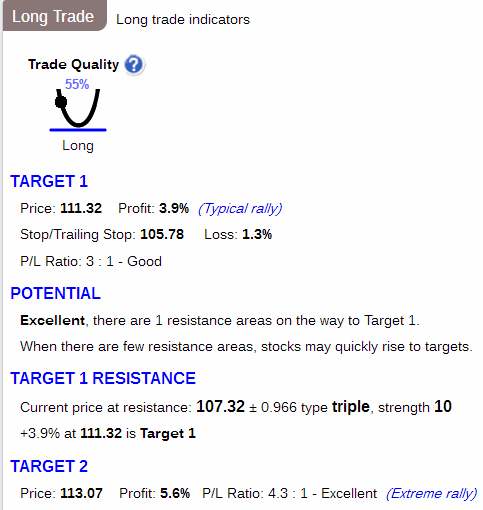
Stock Consultant |
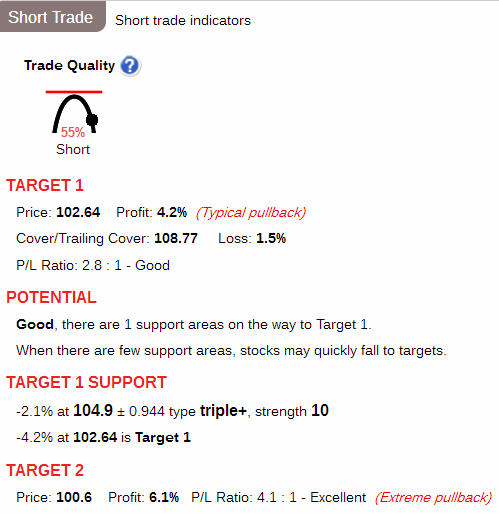
Point & Figure Chart |
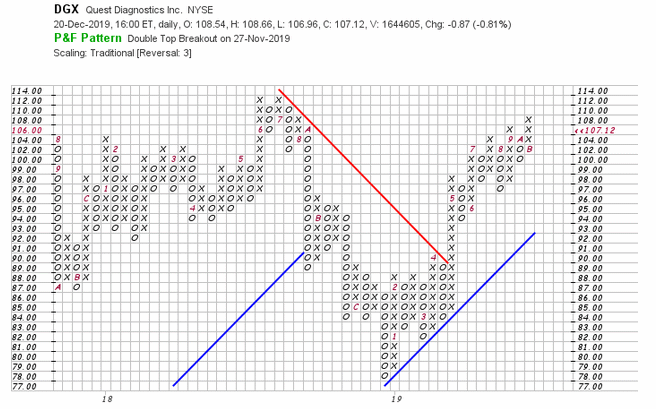
Wall Street Analyzer |
Marketspace Chart |
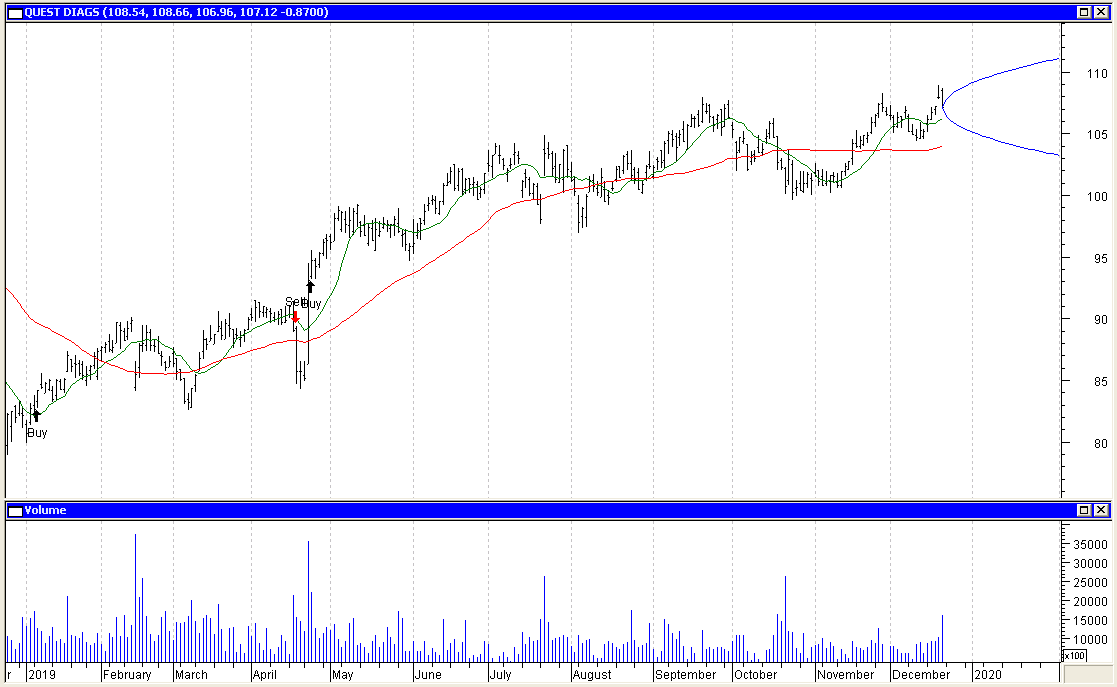
Time Series Forecast |
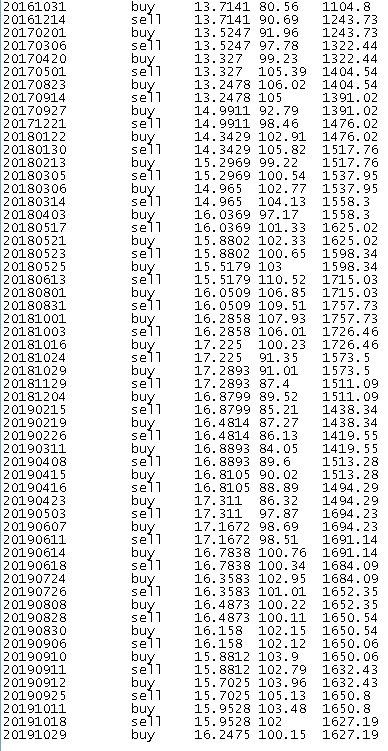
Neural Network Prediction |
"Neurostock" can only track long trades. Therefore its performance, as tracked by itself on stocks which are consistently falling, may not appear as good as it could if each "sell" signal were a "short sale."

![]()

Ultimate Trading Systems |
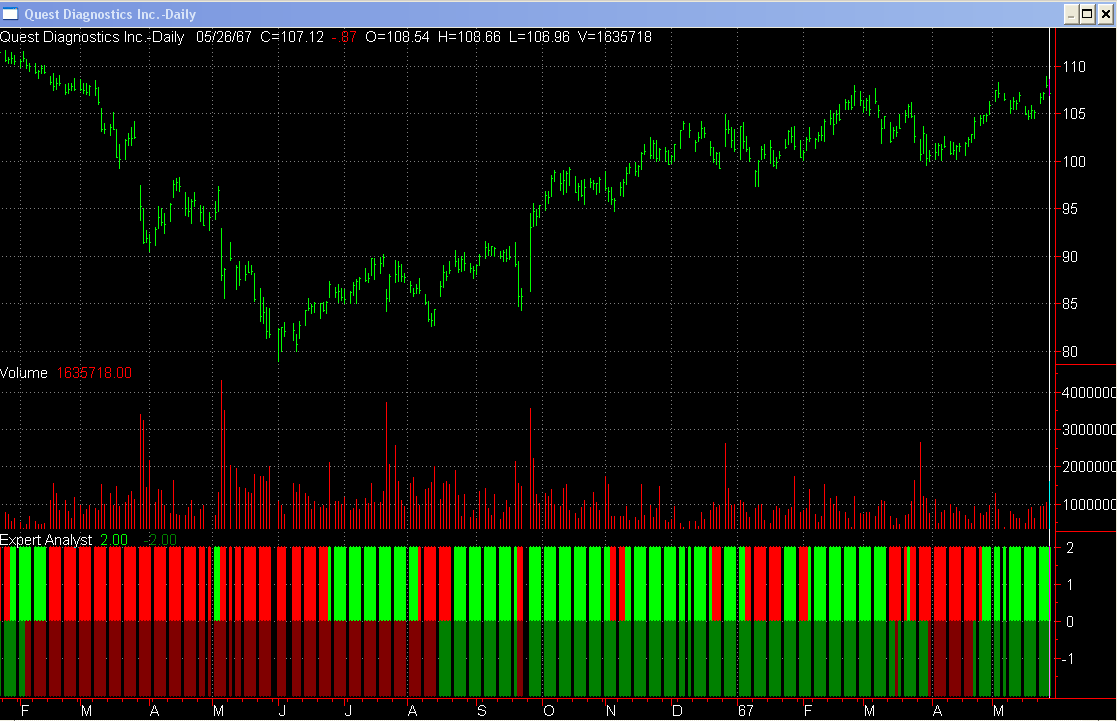
3 out of 3 of the ultimate systems favor an upmove.
System Below:
Short term outlook: Positive: Bright Green, Negative: Bright Red
Long term outlook: Postive: Dark Green, Negative: Dark Red.

Recommendation |
| Factors | Weighted Points |
|---|---|
| News | - 1 |
| Comparison | + 1 |
| Industry | - 1 |
| Bond Issue | + 1 |
| Zenith Index | - 1 |
| Non-GAAP vs. GAAP Earnings | - 1 |
| Cash Flow | + 1 |
| Average to Current P/E | - 1 |
| Ratios | + 1 |
| Intrinsic Value DCF | - 1 |
| Fair Value Estimator | + 1 |
| Projected Earnings | + 1 |
| Research Reports | - 1 |
| Analysts | + 1 |
| Executive Perquisites | - 1 |
| Insider Activity | - 1 |
| Institutional Activity | - 1 |
| Management Reporting | + 1 |
| Short Interest | + 1 |
| Sentiment | + 1 |
| Standard & Poor's | - 1 |
| MACD Histogram Divergence | + 1 |
| Val Idea | - 1 |
| Stock Consultant | 0 |
| Point & Figure | + 1 |
| Wall Street Analyzer | + 1 |
| Marketspace Chart | + 1 |
| Time Series Chart | + 1 |
| Neural Network | - 1 |
| Stock Options | + 1 |
| Ultimate Trading Systems | + 1 |
| Total | + 4 |
Place 280 shares of Quest Diagnostics Inc. (DGX) on the Active List.