![]()
Introduction Nirvana Internal Progrm Historic Range04-07-2020: July Soybean Meal: Temporary Logistics Problems
(Click on links below. Whole page needs to load before links work.)
Intermarket
Parabolic
News
Point & Figure
Cyclic/Seasonal
Third System
Margin
Commitment
Volatility
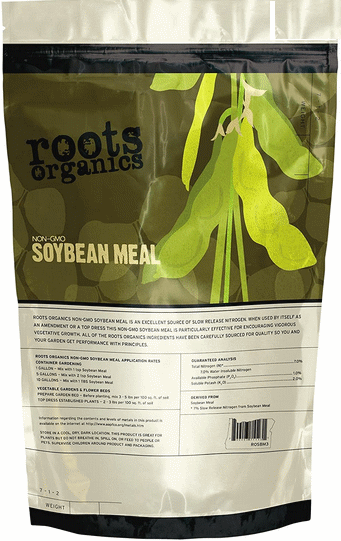
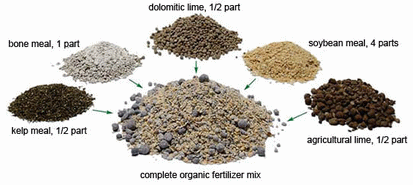
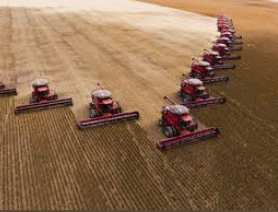

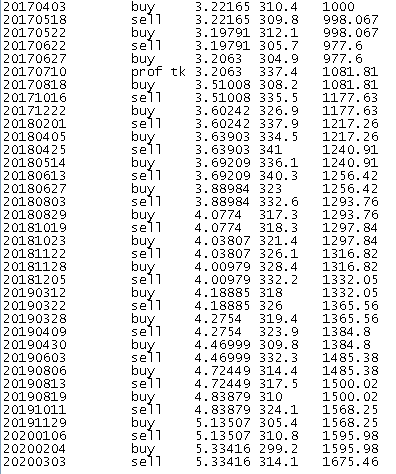
We fed Soybean Meal, Soybeans, and Corn into a neural network to get the following result:
July Soybean Meal:
July Soybean Meal:
Profitability of crushing soybeans in China has supported the soy complex. Chinese soybean stocks at all their ports are tight. The U.S. soybean crush for Februaryi hit an all-tome high which is considered to be providing support. Soybean production in Argentina estimates have been reduced, down 52 million to 49.5 million tonnes. Brazilian currency hit a new record low weighing on the soy complex as it made Brazil's exports more attractive. However, FCStone lowered its Brazilian production estimate by 4 million tonnes to 120.1 million due to drought.
It is generallyi believed for the soy complex that a pick-up in demand in China and a record crush pace in the U.S. will leave not much in the way of positive outside market forces to turn the trend for the whole complex up.
Soybean meal sales are at 67,000 tonnes for the current marketing year and 2,300 for the next for a total of 69.300 tonnes. Traders were expecting below 40,000 tonnes.
Soybean meal has been the beneficiary of supply chain disruption. Brazil's loading of soybean vessels was slowed by heavyi rains in January and February. China's port stocks of soyi meal hit a 10-year low. Argentina's crushing plants and export elevators were slowed by coronavirus concerns. Chinese and European meal users scrambled for coverage. That buying frenzy rallied meal prices and crush margins everywhere.
Planting intentions worldwide for corn and soybean acres were at a record high in the U.S. The market is limited in its ability to porice acres out of production byi the support programs that are in place. Favorable crop insurance prices were locked in during February, and the Farm Bill provides a second safety net via Price Loss Coverage. The $2.2 trillion Coronavirus Aid, Relief and Economic Security Act (CARES) was signed last Friday including a $15 billion amount for the Commoditiy Credit Corporation which was the conduit for the last Market Facilitation Payment.
To benefit from various government coverages, you have to plant to play making most U.S. acres very price inelastic. The market will have more success in switching acres than in will havein idling acres. But demand is expected to suffer from high macroeconomic winds. A deep recession is almost now a reality. Disruptions in supply chains appear inevitable and price spikes up and down will ensue as suppliers and users scramble to recover. U.S. and world balance sheets are generally comfortable, but the northern hemisphere planting and growing season is just starting. It is a market that should be approached more opportunistically than strategically.
China may still have African Swine Fever leavings reducing demand for soy meal for hogs. China also placed demand-killing tariffs on U.S. soybean meal. However, curbs on exports of Argentinian soybeans will benefit U.S. soyberan meal.
In early March, soybean meal sales were 316,660 metric tonnes, double the preceding week, and 37.4% high year over year. Meal exports for the week ending 2.27 were 96.1% higher year over year with 316,660 MT shipped. Mean exports for the year totaled 4.38 MMT, 7.2% below the preceding year's pace.
Soybean meal is the dominant protein supplement used in U.S. livestock and poultry feeds. Technical uses include adhesives, cleansing materials, polyiesters, and other textiles. Argentina is
normally the biggest exporter of soybean meal, followed by Brazil, then the U.S. and then India. The U.S. is the largest overall producer of soybean meal.
Our assessment of the news of soy meal suggests that supply chain disruption is the dominant factor propelling short-term prices, caused biy both weather and virus concerns. This has been supportive for soybean meal, even though it appeared to make a short-term breakout relative to the rest of the soy complex and then returned to a more in--line state. We think the potential for further breakouts exists.
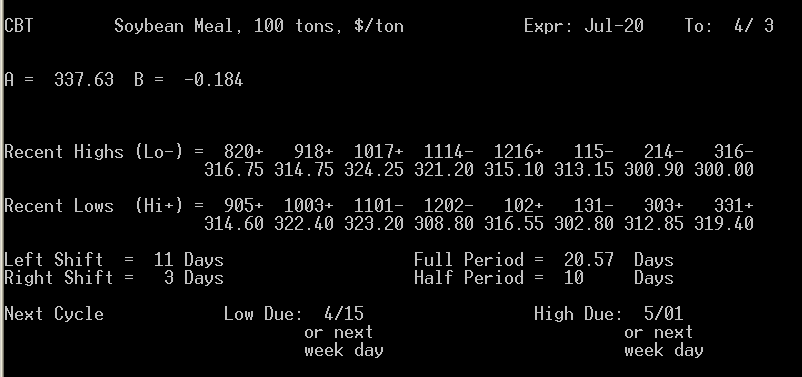
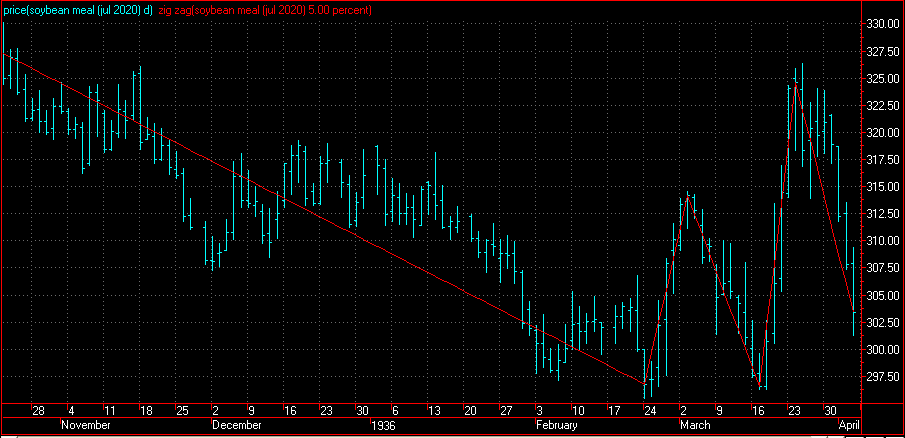
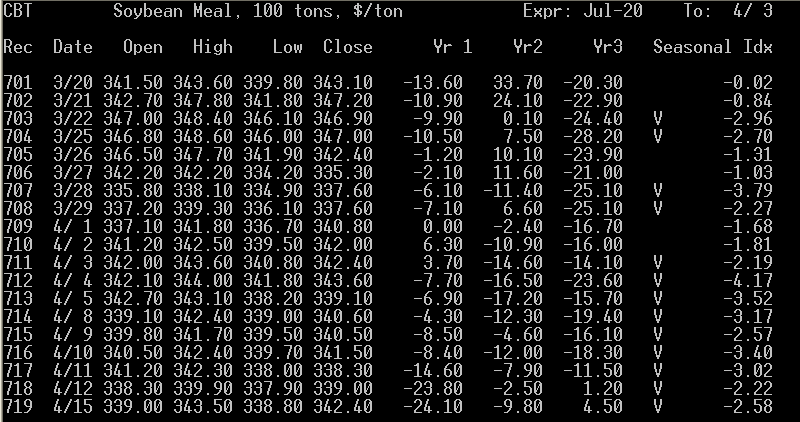
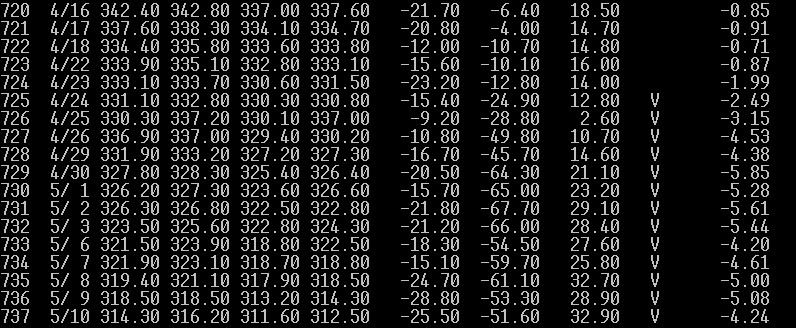
We are headed toward a cyclical low and a strong seasonal down period.
Our best-performing internal program is "Trader". It is giving a sell signal.
Results of "Trader" for Soybeans (blue lines = successful trades, red, unsuccessful):
(Always in the market.)
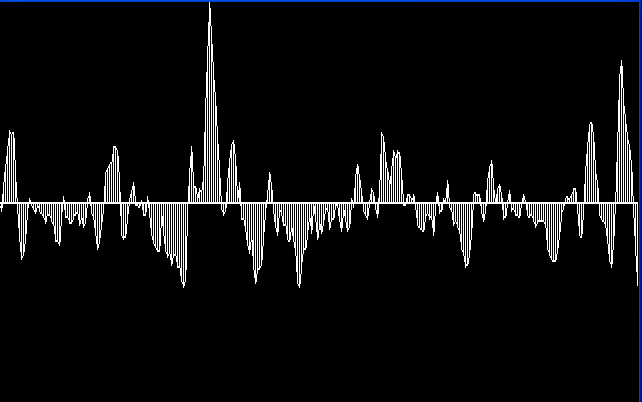
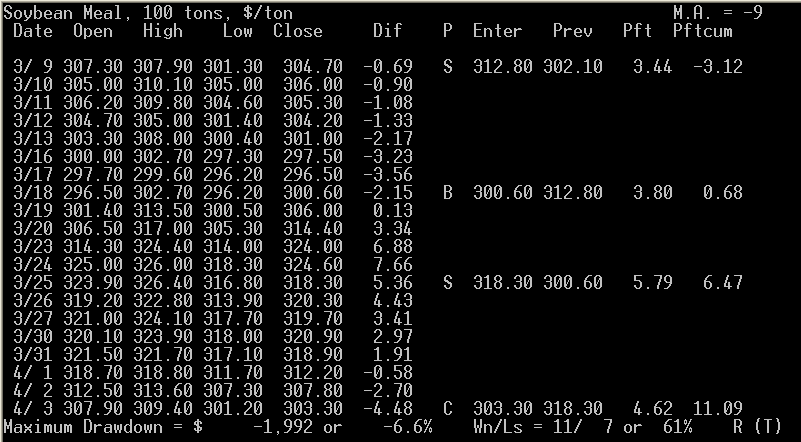
Our third system has triggered a sell signal. (Note, disregard the year on the chart. Our regular readers know this is not a Y2K-compliant system, but it still works.)
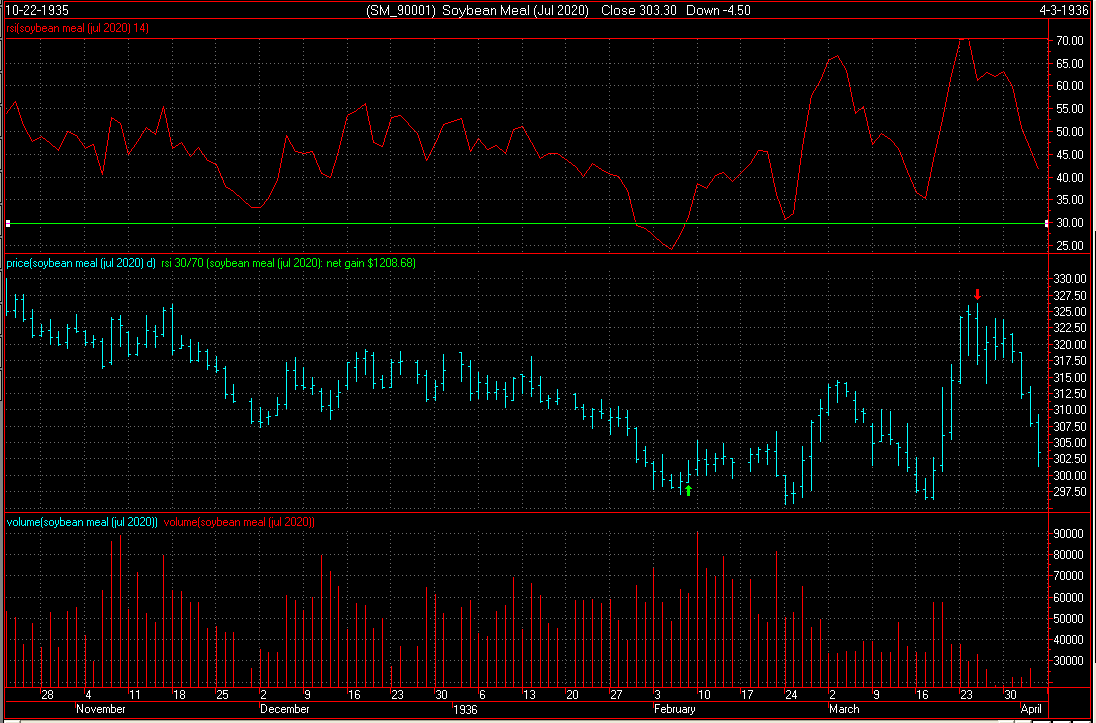
The point value is $100. Initial margin on a single contract is $1,375. Use of options is not advised.
Scale traders are not a factor in this price range.
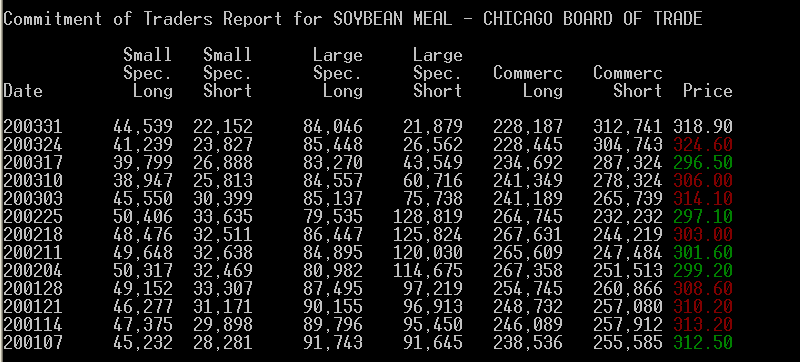
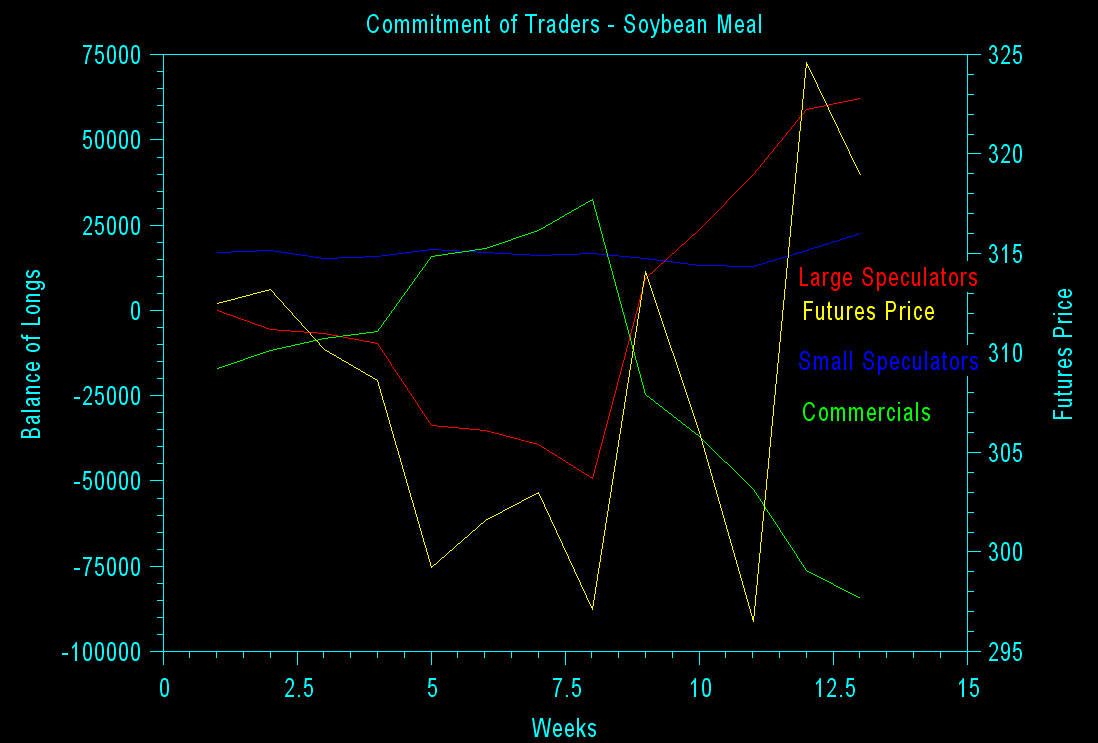
In the chart below, the yellow line is the futures price, read on the right axis. All other colors are read on the left axis. Blue is small speculators. Red is large speculators. Green is commercials. Large speculators with the best track record are getting increasingly-long.
Interpretation of a Different Site Below (Their trader categories may vary from ours):
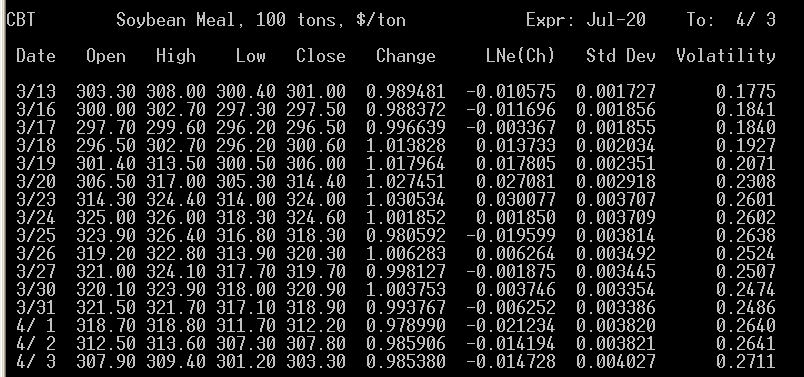
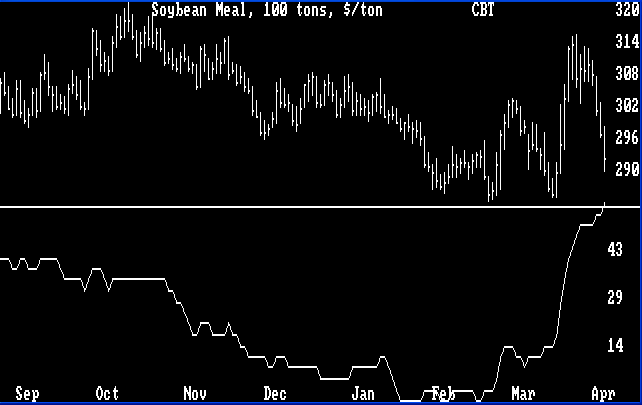
The average volatility shown below suggests that an uptrend (barely) remains intact from the last volatility low point.
An options trade may be suggested later in this spot.
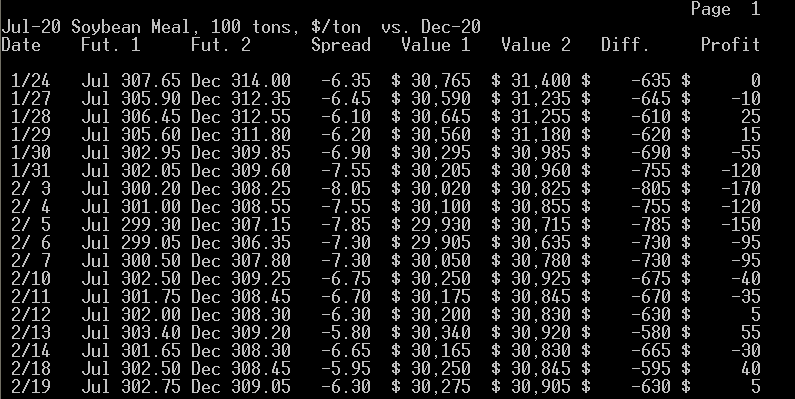
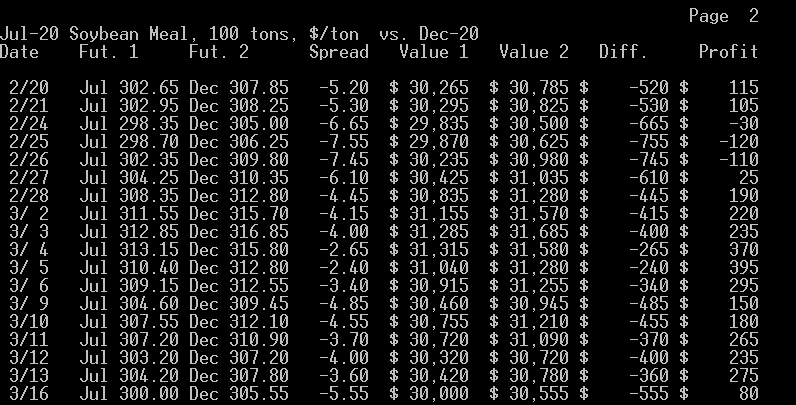
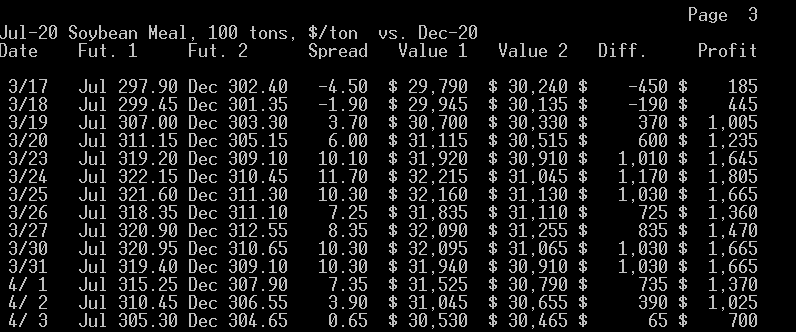
What the Jul. - Dec. calendar spread suggests to us is that buying the near contract and selling the far one is at most times profitable, which we think is a sign that these futures may go up in the long run. The best time to enter or leave the above spread is when it is at -7.50 or narrower selling the far as prices are falling and then buying the near, and exiting or entering when it is at +10.30 or wider buying the far as prices are rising and then selling the near. At this time, we appear to be approaching the buy the far, sell the near point.
To view the chart below correctly use Microsoft Internet Explorer.
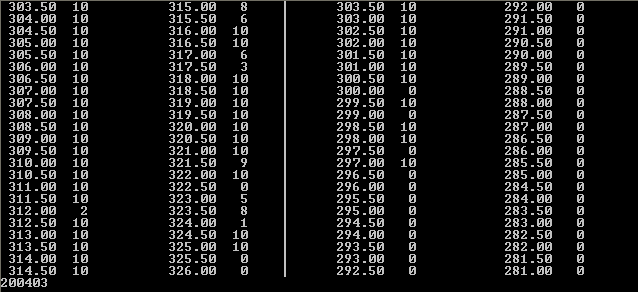
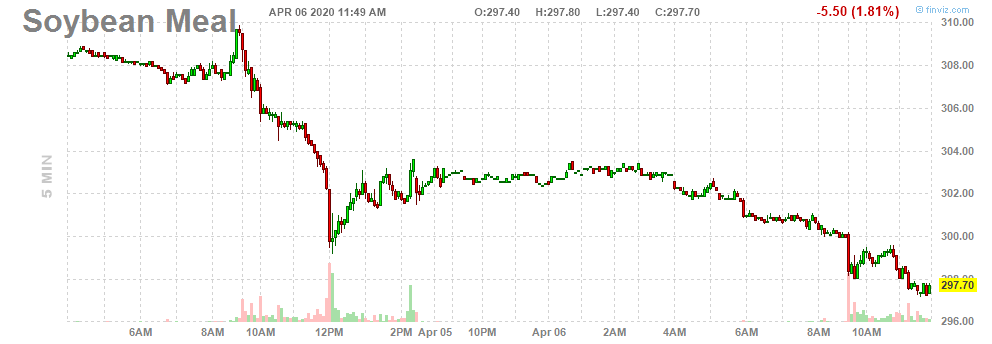
Here's an intraday chart for a previous day (4/04).
Introduction
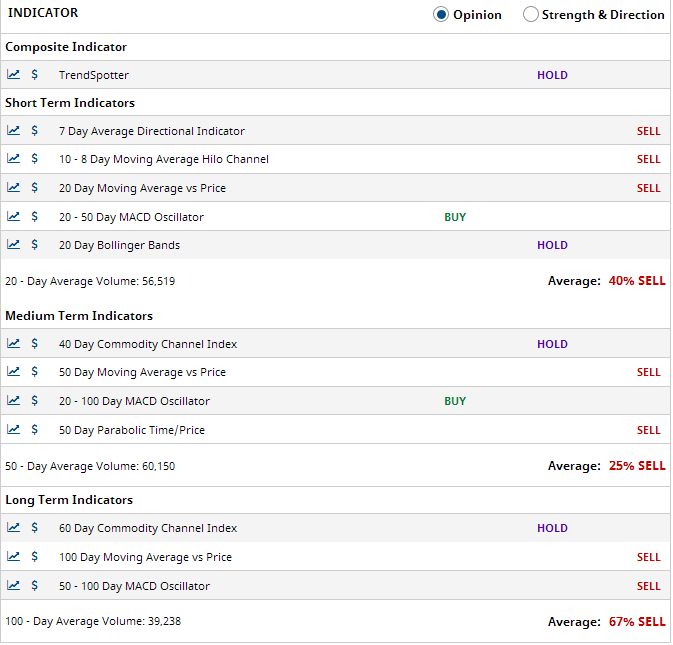
 In the first two weeks of March, soybean meal futures shot up while the rest of the soy comlex and other grains remained relatively stagnant. The reason was explained as a holdup at various shipping ports due to the virus complications coupled with weather problems. This logistics problem caused a shortfall in inventories as distributors and processors scrambled to fill needs. Apparently, the situation took care of itself, and futures fell back to more normal ranges, and the technical chart factors are pretty much all telling us the decline in soy futures prices will continue. While we have to "go with our system" and make the latest developing trend our "friend", we did not see convincing reasons why the same logistics situation could not cccur again at any time. A big factor remains China's needs and Argentina's and Brazil's apparent inability to fulfill them if they get larger.
Intermarket Analysis


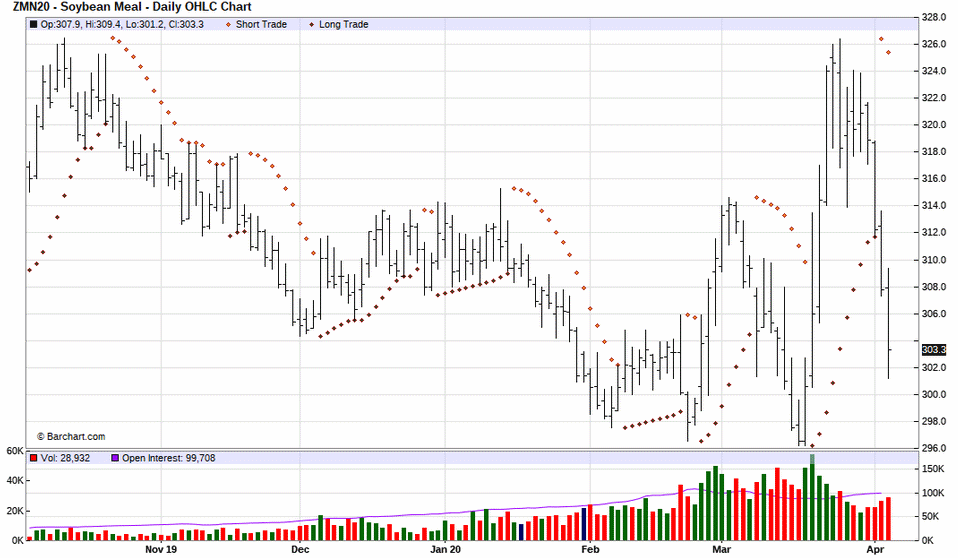
Parabolic Chart
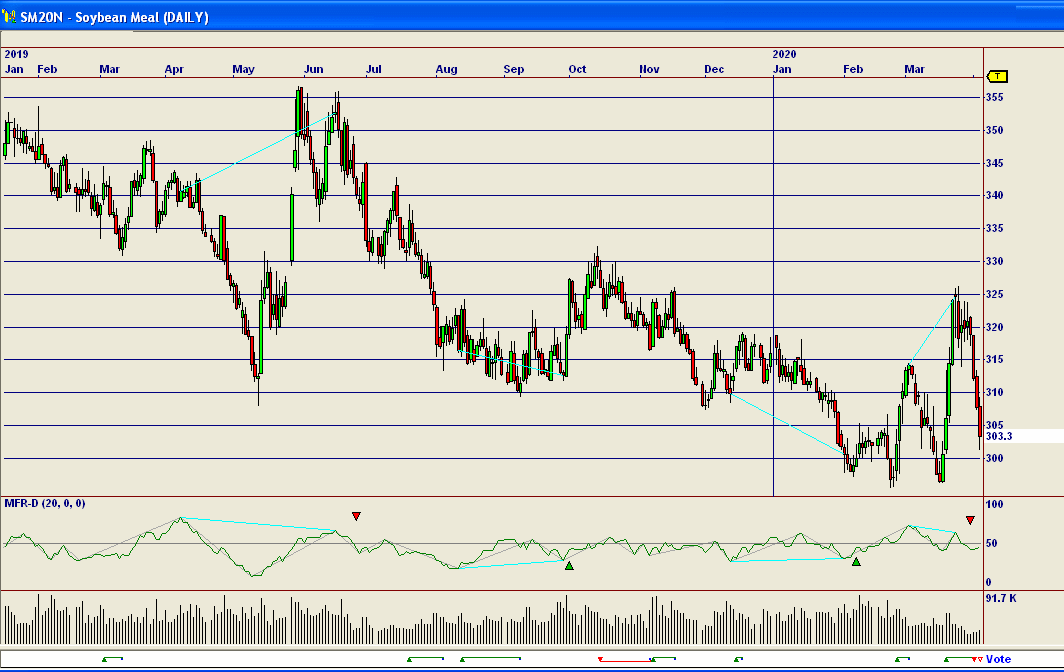
Nirvana Chart
News Analysis
Point & Figure Chart
475.0|                                                                  T  4/ 3
     | CBT - Jul-20 Soybean Meal, 100 tons, $/ton  Cm.=0.30  Lim.=18.0
     |
     |
     |
455.0|_____________X_________________X_________________________________________
     |             XOX               XO  X
     |             XOXO              XO  XO
     |             XOXO              XO  XO
     |             XOXO            X XOX XO
435.0|_____________XOXO____________XOXOXOXO____________________________________
     |       X     XO O            XOXOXOXO
     |       XOX X X  O            XO OXO O
     |       XOXOXOX  O            X  OX  O
     | X     XOXOXOX  O            X  OX  O
415.0|_XOX___XOXOXOX__O____________X__OX__O____________________________________
     | XOXO  XOXO OX  O            X  O   O
     |OXOXOX XO   O   O            X      O
     |O O OXOX        O            X      O
     |    OXOX        O  X         X      O
395.0|____OXO_________O__XO____X_X_X______O____________________________________
     |    O           O  XOX   XOXOX      O
     |                O  XOXO  XOXOX      O
     |                OX XOXO  XOXOX      O  X
     |                OXOXO OX XOXOX      OX XOX
375.0|________________OXOX__OXOXOXO_______OXOXOXO______________________________
     |                O OX  OXOXOX        OXOXOXO
     |                  OX  OXOXOX        OXO O O
     |                  OX  OXO OX        O     O  X
     |                  OX  OX  O               OX XO
355.0|__________________OX__OX__________________OXOXOX_________________________
     |                  O   OX                  OXOXOXO  X X
     |                      O                   OXOXOXO  XOXO
     |                                          O O O OX XOXO
     |                                                OXOXO O
335.0|________________________________________________OXOX__O__________________
     |                                                O OX  O
     |                                                  OX  OX
     |                                                  OX  OXO
     |                                                  OX  OXOX
315.0|__________________________________________________OX__OXOXO______________
     |                                                  O   O OXO
     |                                                        OXO
     |                                                        OXO
     |                                                        O
295.0|----|----|----|----|----|----|----|----|----|----|----|----|----|----|---
           11111111           111                  11        11
      89999000012221122456777901211222334456778889900123456660134
      30112002220001212113122122012022022202030120102002210120220
      17393360811682402780305442886817533770516427753771347771603
The above chart is giving a conventional sell signal.
Cyclical and Seasonal Factors
Internal Program

Third System Confirmation
Margin
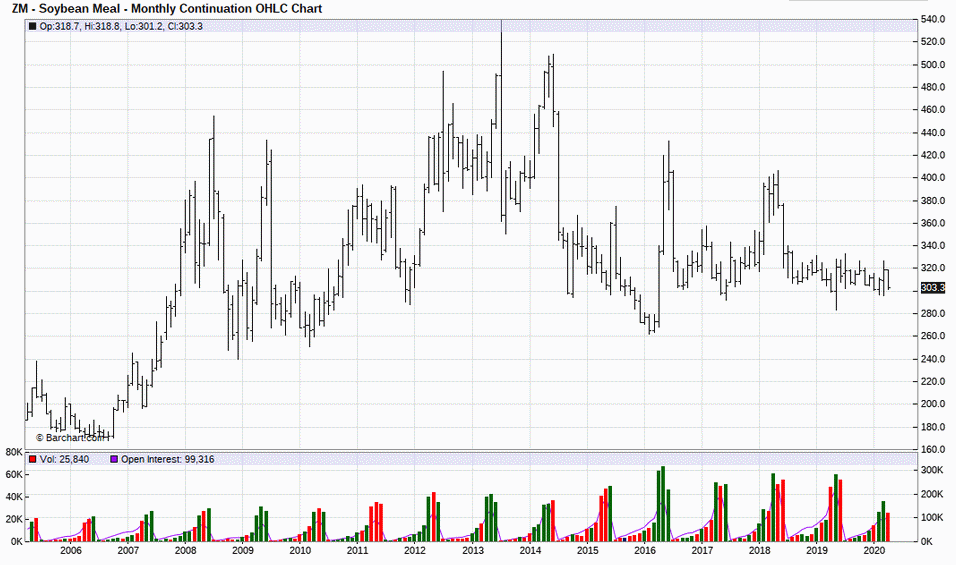
Historic Range
Commitment of Traders

Volatility / Probable Range

Possible Future Prices
Option Recommendation
Calendar Spread
Level Table:
365.0|                                                                  R  4/ 3
 CBT - Jul-20 Soybean Meal, 100 tons, $/ton  Cm.=0.30  Lim.=18.0
     |
     |
     |
355.0|_________________________________________________________________________
     |DDEEF
     |DDDDEEEF
     |DDDDEEEEFFF
     |DDDDEEEEFFFFF
345.0|DDEEFFFFF________________________________________________________________
     |DDEEEFFFFFF
     |AEEEEFFFFFFG
     |AAAAAADEEEEEFFFFG
     |AAAAADEEEFFFGG
335.0|AABBDEFFGGGHH____________________________________________________________
     |AABBBDFGGGGHHH
     |BBBBBDFGGGGGGGHHHHHH
     |BBBBBCDGGGGGHHHHHHOO
     |BCCCGHHHHNOOOOOO
325.0|BBCCCCDDDHJNNNOOOOOOOOOP_________________________________________________
     |BBBCCCDDDDDHJNNNNNOOOOOOPPQQZZ
     |BBCCCCDDDDDJJJJKNNNNNOOPPPPPQQQQQQZZZZZ
     |CCCCCDDDJJJJJJJKKMMNNNNNPPPPPPPQQQQQQQQZZZZZZZ
     |CCCCDJJJJJJJJJKKKKLMMMMNNNPQQQQQRRSTZZZZZZZ
315.0|CCJJJJJKKKKKKKKKLLLLMMMMMNNPQRRRSSSSSTTTTTTUZZZZZ________________________
     |CCCJKKKKKKLLLLLLMMMMMMMNNRRSSSSSSTTTTTTTTUUUUUZZZZ
     |CCCKKKLLLLLLLLMMMMMMNNNRRRSSSSSSSTTTTTUUUUUUUUXXXZZZ[
     |CLLRRRRSSSUUUUVXXYZZ[
     |CRRRSVVVVVVXYYYYZZ[[
305.0|VVVVXXYYYYZZ[____________________________________________________________
     |VWXXYYYYYZ[
     |VVVWWWWWWXXXXYYYZ[   <<<
     |VVWWWWWWXXXYYYZ
     |VVWWWXXXYYY
295.0|WXXXYY___________________________________________________________________
     |
     |
     |
     |
285.0|-A-B-C-D-E-F-G-H-J-K-L-M-N-O-P-Q-R-S-T-U-V-W-X-Y-Z----|----|-- TPO=-0.340
                                 1 1 1 1 1 1
       4 4 5 5 6 6 7 7 7 8 8 9 9 0 0 1 1 2 2 1 1 2 2 3 3 4           4
       0 2 0 2 0 1 0 1 3 1 2 1 2 1 2 0 2 0 2 0 2 0 2 0 1 0           0
       8 2 6 0 4 8 2 7 1 4 8 2 6 0 4 7 1 6 0 7 2 5 0 5 9 2           3
Other Factors
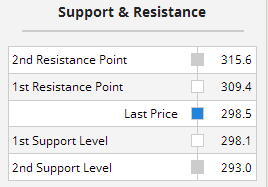
                 Risk Versus Opportunity Report
                ________________________________

                   SMN0    July Soybean Meal

                      High Price:  315.9
                   Current Price:  303.3
                       Low Price:  277.6

                            Risk: -0.085
                     Opportunity: -0.173

                    (O/R) Ratio =  2.040