![]()
Introduction Nirvana Internal Progrm07-25-2020: September Silver: Begins a Move Signaling Major Economic Change
(Click on links below. Whole page needs to load before links work.)
Intermarket
Parabolic
News
Point & Figure
Cyclic/Seasonal
Third System
Margin



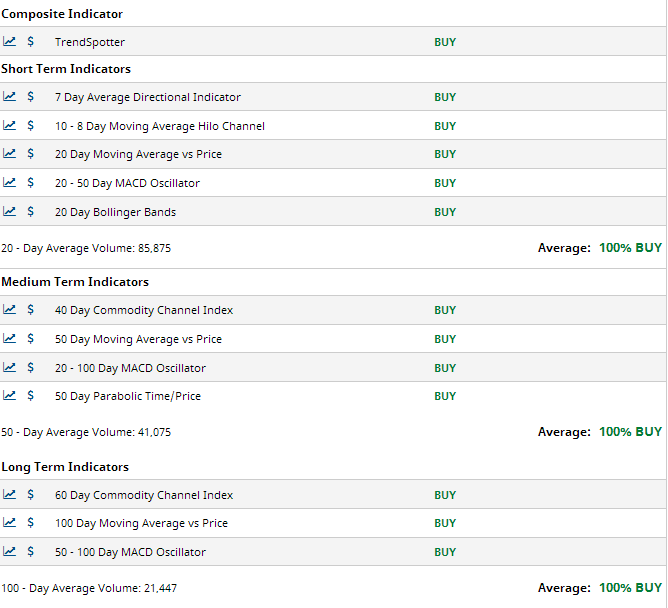
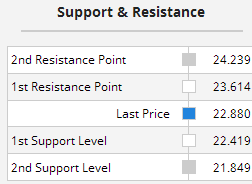
But silver has been the "great disappointer" for decades. We have seen this liftoff before, only to catch greedy hoarders unaware and left with declining silver prices after an initial rush into them. All we can say is that our technical indicators are about as strontg as they ever get in favor of this commodity going higher, and so we must go with the trend.
We fed Silver, Gold, and Platinum into a neural network to get the following result:
September Silver:
September Silver:
Mechanical market signals are giving credence to the probability that the Federal Reserve and other centrall banks will provide additional support for the global economy. The U.S. Dollar is going opposite to gold and silver because of fears of inflation that central bank and treasury actions printing more money will produce. ETF's are adding to their holdings of precious metals for the past 20 straight sessions. Yesterday alone added 228,559 ounces of gold bring total annual purchases to 23.6 million ounces. Bank of America said precious metals funds saw the 2nd largest ever weekly inflow of $3.8 billion for the week ending July 22nd. Silver ETF holdings jumped by nearly 10 million ounces in one day and the I-shares Silver Trust alone saw 9.5 million ounces flowing in. Many analysts are predicting a near-term "all time high" for gold. U.S. Treasury yields are back down to the lowest since the height of the virus anxiety in March. That gives credence to a "safe haven" environment entrenched. Mining shares and other futures commodities have pretty much all shown strength in the past week. Open interest has been rising in gold and silver on large volumes. The silver market seems more likely than gold to forge a corrective setback. But contradicting that is a narrow trading range in silver. So the main factor in all this seems to be strong ETF buying. ETF holdings in platinum are also increasing significantly.
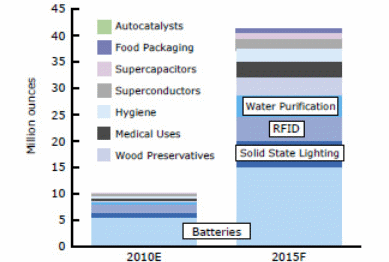
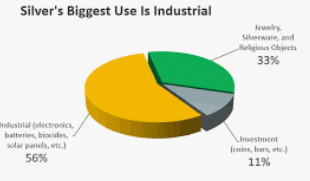
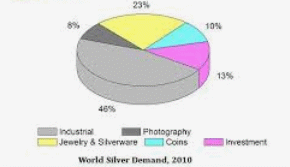
The founder and CEO of First Majestic Silver spoke with Kitco after realizing silver was finally making a move after appearing stalled for the last 18 years. Demand has increased from green technology manufacturers, precious metal investors, and Covid-19 is hampering mine production by causing suspensions, all aiding silver. Tightness in silver supply is only goinv to get worse as we go green the CEO said, as before we didnt have solar and panels and electric cars to as great a degree. Solar panel makers have become the largest consumers of silver. As the coronavirus spread, Mexican officials and other Latin-American nations implemented strict lockdown measures, and Mexican mines were not considered essential services even though they accounted for 28% of global silver production.
First Majestic's San Dimas mine produced 35% less than the previous quarter of silver, a total of 2.4 million ounces. Two other mines had production at 63% and 45% lower as a result of suspending operations in April. Despite this, the CEO projects 21.5 million ounces of silver to be produced in 2020 versus a similar might for 2019.
Pan American Silver (PAAS) said it was moving its Huaron and Morococha operations in Peru into care and maintenance in response to several workers testing positive there. In 2019, they each produced 3.8 million and 2.5 million ounces of silver respectively.
In the very latest data as of this writing, gold futures continued to rally but silver and platinum may have suffered key reversals and showed some weakness. However, recent moves have been much bigger percentagewise for silver than for gold. A wave of short covering has been produced for silver. The European Union's recovery fund allocated a huge chunk of tis spending to environmental initiatives and alternate energy development. That allowed solar energy and silver to be two of the best-performing niches in various sub-sectors so far this year. Solar panesls and batteries needed to store energy at night both require specialty metals like silver. And Tesla has become a "hot stock" in anticipation of increased production of Tesla's solar panels and batteries.
The gold/silver ratio has been narrowing as a result of silver's recent surge. One Kitco advisor said that the real reason for silver's surge is that investors in their '30's amd '40's have realized the need for safe haven diversity in case of a stock market bubble. The ratio is around 83, but was as high as 124 in March.
Some analysts think there is no alternative to gold and silver, especially silver, because China and the USA are saber rattling, shutdowns are stifling economies, and the Fed has hired a goldbug. One prominent trader, Bill Baruch of Blue Line Capital sees a further 30% rally in silver. Silver is sitting close to a seven-year high.
The Federal Reserve is printing money at the rate of 25% more year over year. But the 2nd Quarter U.S. GDP is forecast to be down 34.7%. To better understand this:
M2 is seeing the worst velocity in history at -34.7%.. And the Federal Reserve's corporate bond holdings, in which it recently engaged in merrily purchasing for the first time, include two of the top four purchases being in German auto makers Volkswagen and Mercedes, more than its purchases of Verizon or General Motors. Ford is near the bottom of the list of purchases and Chrysler hardly seen. A decline in money velocity is an indication of a weak real economy where money is not changing hands at a robust pace. M2 velocity suggests that economic activity is the weakest since 1959. This is not the case, but affecting by increased money reserves required to be held by banks. Some economists see this as a disaster, but others say that due to a change in policy of the Fed during the Greenspan years as its principal responsbility to control inflation resulted in money aggregates having no predictive power with respect to prices. No agreement is seen on the effects of the unusual changes in money supply relationships. They appear so far to be largely being ignored.
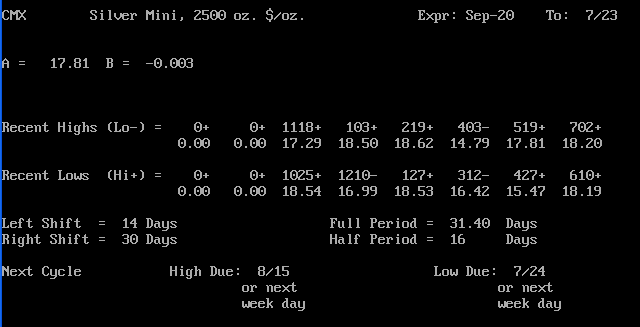
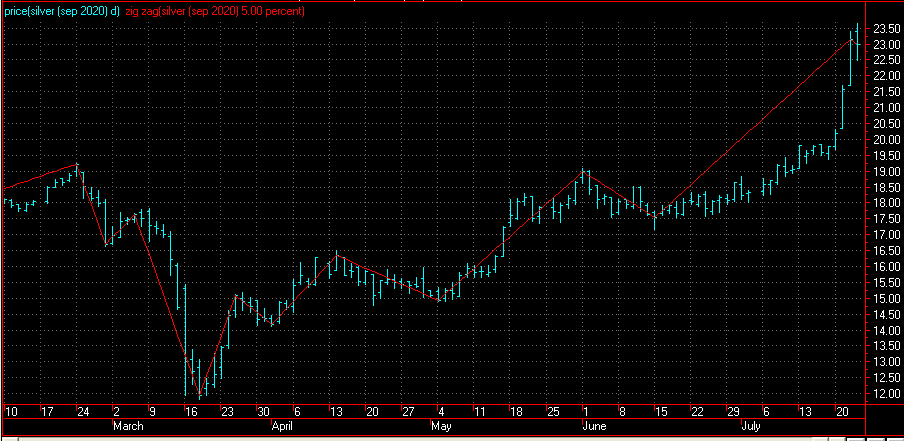
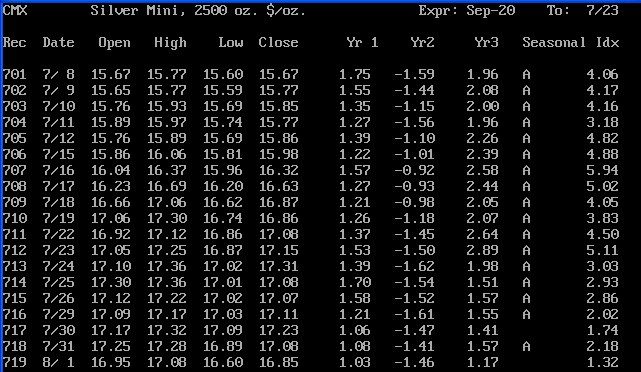
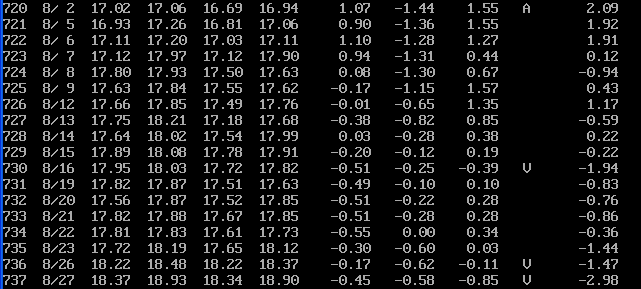
We are in a cyclical high and a seasonal up period.
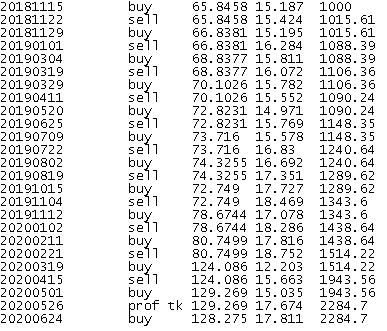
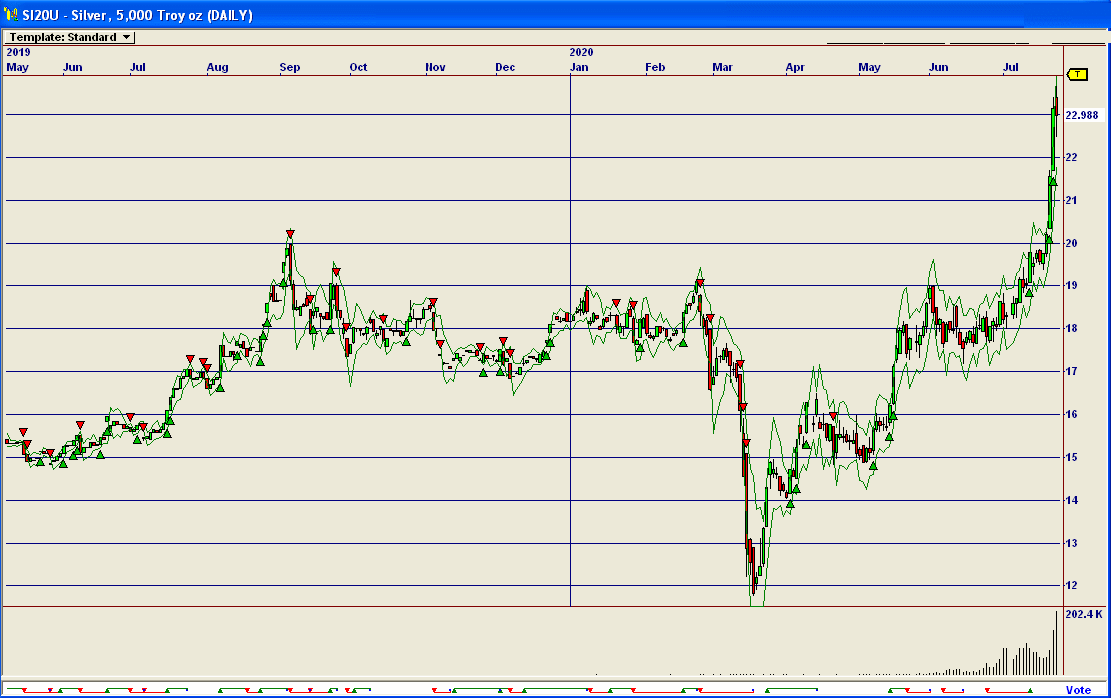
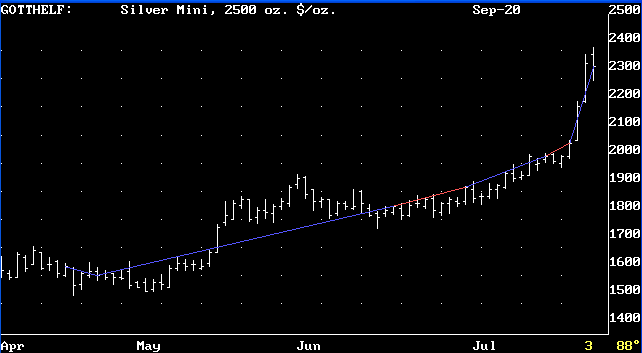
Our best-performing internal program is Gotthelf. It is giving a buy signal.
Results of "Gootthelf" for Silver (blue lines = successful trades, red, unsuccessful):
(Always in the market.)
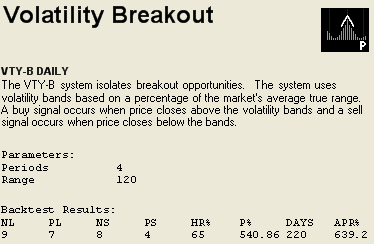
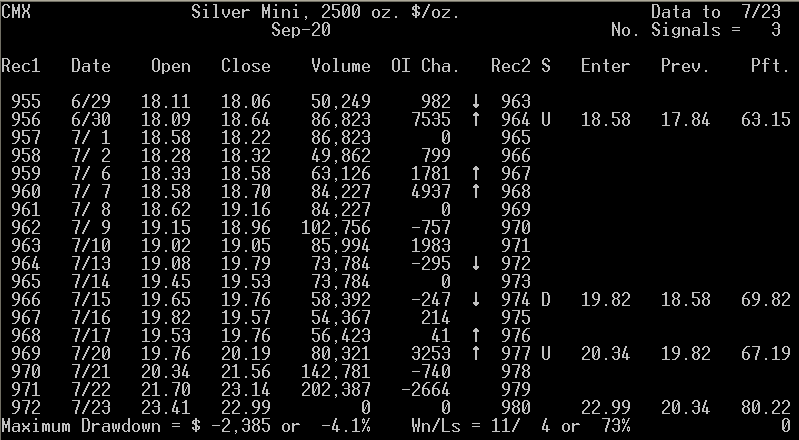
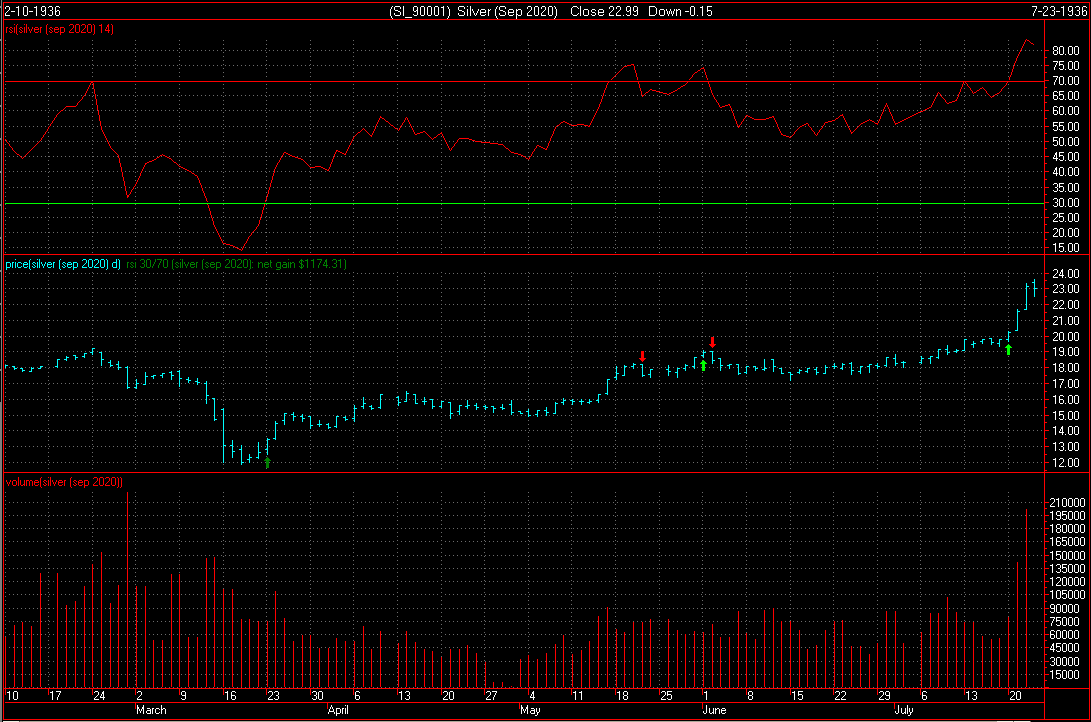
Our third system has triggered a buy signal. (Note, disregard the year on the chart. Our regular readers know this is not a Y2K-compliant system, but it still works.)
The point value is $2,500 for the mini contract. Initial margin on a single contract is $4,400. Use of options is advised.
Scale traders are not a factor in this price range.
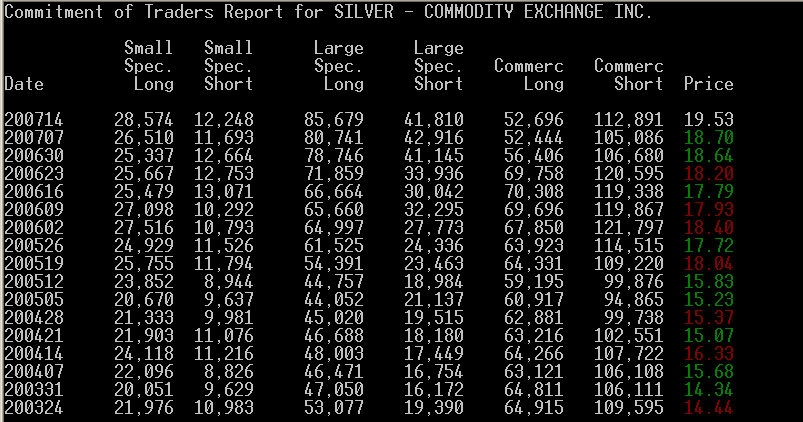
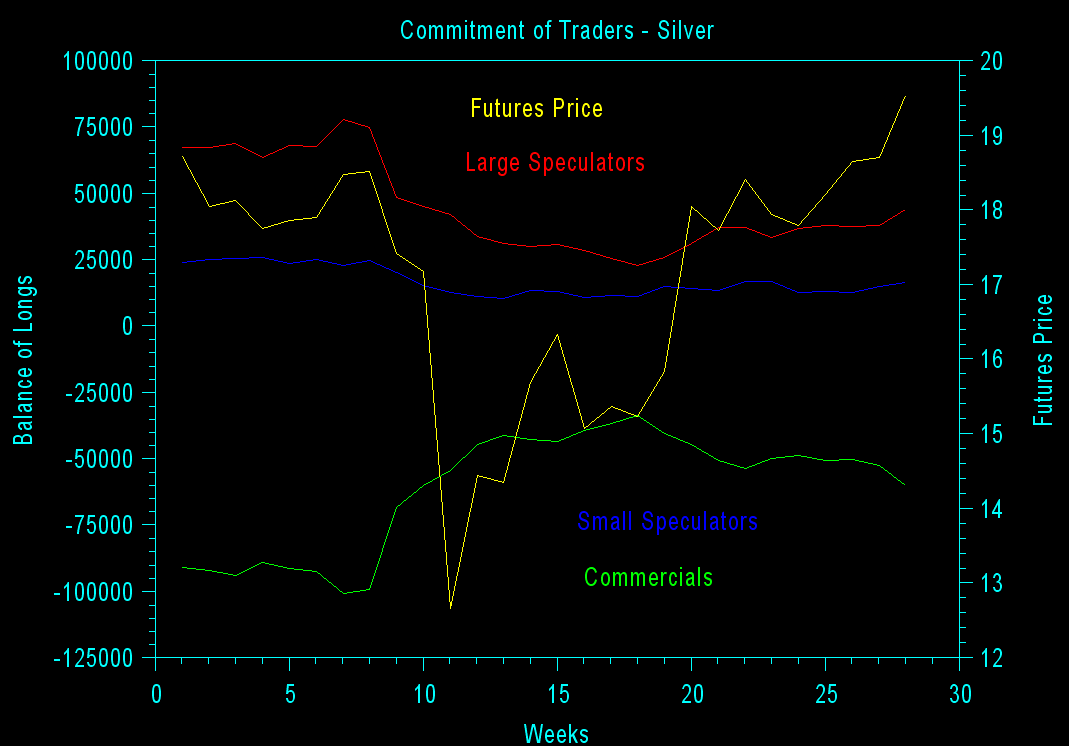
In the chart below, the yellow line is the futures price, read on the right axis. All other colors are read on the left axis. Blue is small speculators. Red is large speculators. Green is commercials. Large speculators with the best track record are getting increasingly-long.
Interpretation of a Different Site Below (Their trader categories may vary from ours):
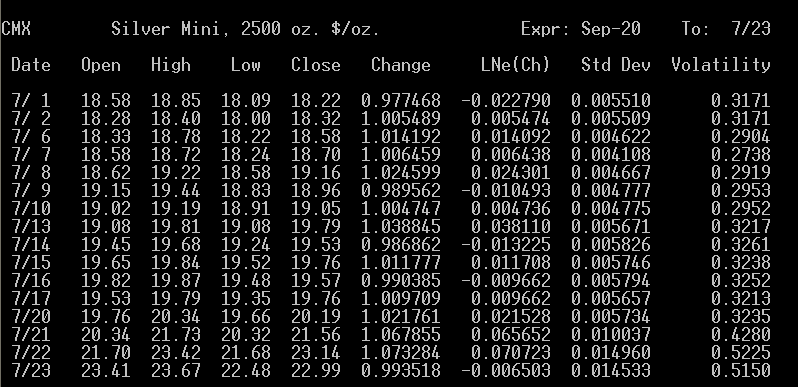
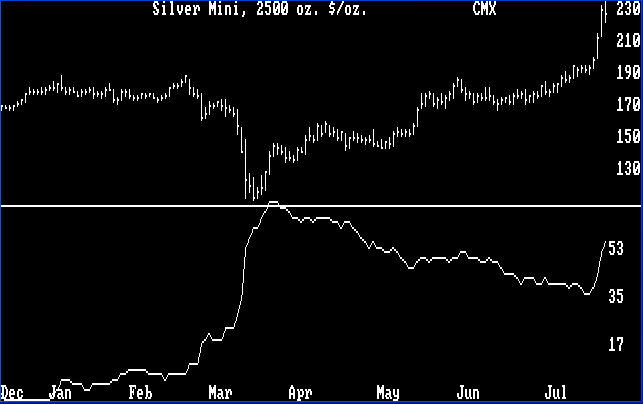
The average volatility shown below suggests that a downtrend remains intact from the last volatility low point.
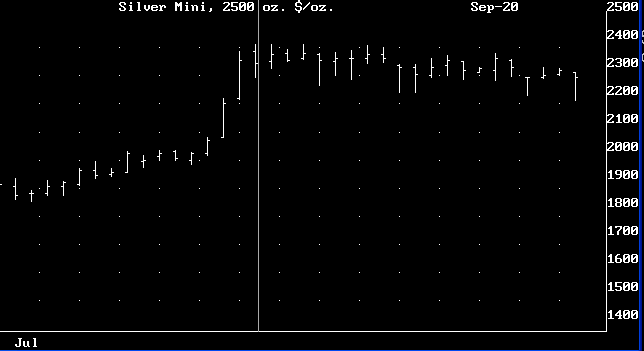
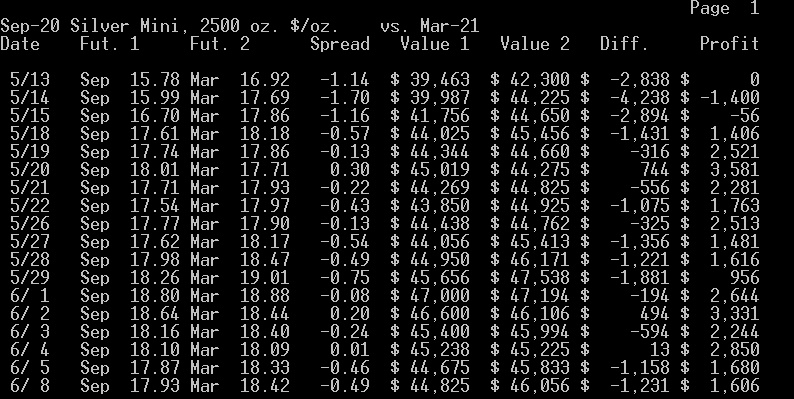
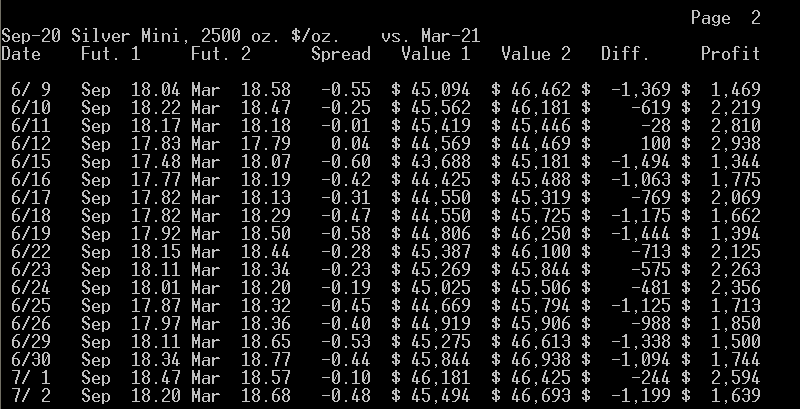
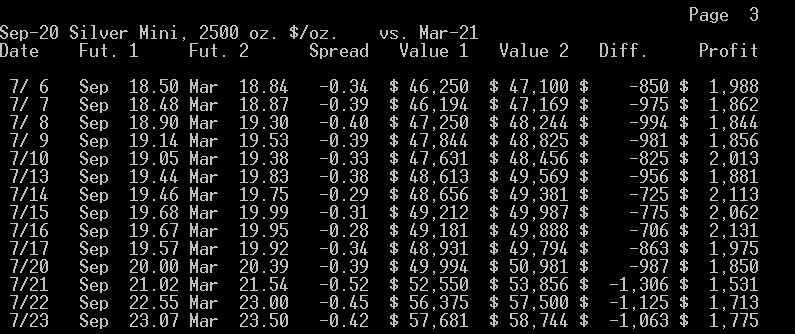
What the Sep. - Mar. calendar spread suggests to us is that buying the near contract and selling the far one is at most times profitable, which we think is a sign that these futures may go up in the long run. The best time to enter or leave the above spread is when it is at -0.10 or narrower buying the far as prices are rising and then selling the near, and exiting or entering when it is at -1.70 or wider selling the far as prices are falling and then buying the near. At this time, we appear to be headed toward the sell the near, buy the far point.
To view the chart below correctly use Microsoft Internet Explorer.
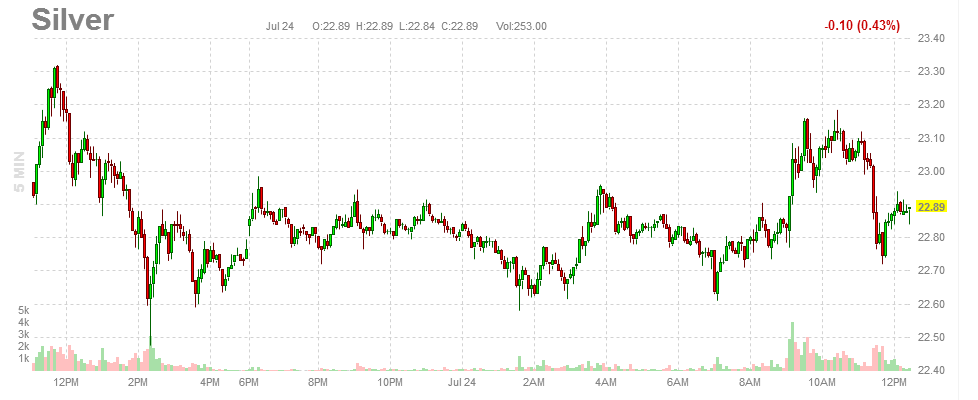
Here's an intraday chart for a previous day ( 7/11 ).
Introduction
Of course, economic numbers are going to go all over the map, the way irresponsible Republicans and Democrats in Congress and the White House have been over-spending and increasing the national debt by trillions. The only way to pay it back is to devalue the Dollar, and that is already happening. With weird economic numbers, especially withi regard to money supply which is being largely ignored up until now, a potential disaster is indicated. Investors are finally seeing this, and pushing their assets into safe havens like precious metals. Generally strong equity markets and precious metal record highs are not correlated, but the fact that they are recently suggests a new ballgame is about to emerge. Markets abhor uncertainty, and there's a lot of uncertainty about the ability of our current government to handle fiscal affairs in any sort of intelligent way. Conservatives are right for the long run, but they are being trampled upon and run over by extremists who are setting up this country for a real disaster, or so quite a few now believe. Silver and preciouis metal prices are the beneficiaries.
Intermarket Analysis


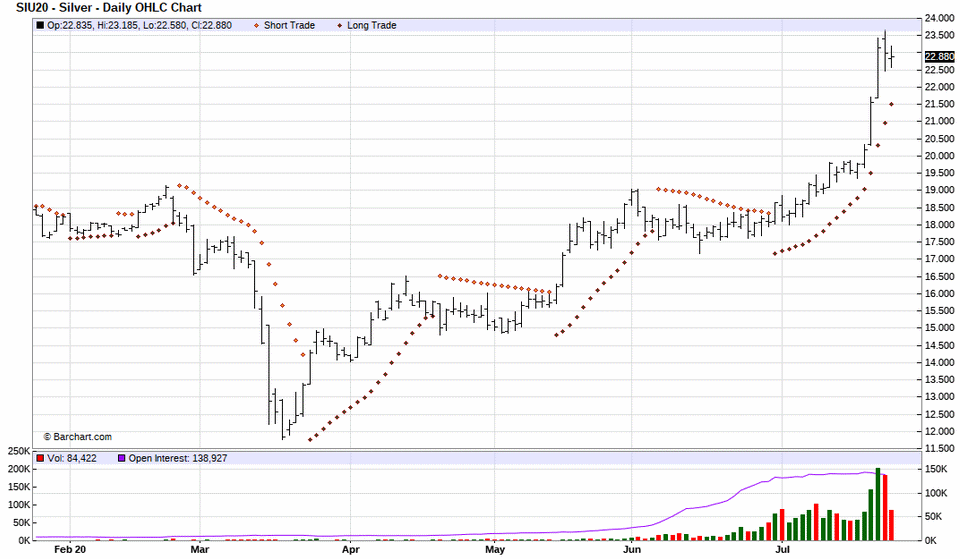
Parabolic Chart
Nirvana Chart
News Analysis
M1 includes money in circulation plus checkable deposits in banks.
M2 includes M1 plus savings deposits less than $100,000 and money market mutual funds.
M3 includes M2 plus large time deposits in banks.
M4 includes all despoits in PO savings, excluding national savings certificates.
Point & Figure Chart
 24.5|                                                                  T  7/23
     | CMX - Sep-20 Silver Mini, 2500 oz. $/oz.    Cm.=0.02  Lim.= 0.8
     |
     |
     |                                X
 23.0|________________________________X________________________________________
     |                                X
     |                                X
     |                                X
     |                                X
 21.5|________________________________X________________________________________
     |                                X
     |                                X
     |                                X
     |    X                           X
 20.0|__X_XO__________________________X________________________________________
     |  XOXO  X         X             X
     |  XOXO  XO        XO            X
     |  XOXOX XO        XO            X
     |X XO OXOXOX X     XO  X X     X X
     |X XO OXOXOX X     XO  X X     X X
 18.5|XOX__OXOXOXOXOX___XOX_XOXO____XOX________________________________________
     |XOX  OXOXOXOXOXO  XOXOXOXO    XOX
     | OX  O OXO OXOXO  XOXOXOXO    XOX
     | O     OX  OXO O  XO OXO O    XOX
     |       OX  OX  O  X  OX  O    XO
 17.0|_______OX__O___O__X__O___O____X__________________________________________
     |       O       OX X      O    X
     |               OXOX      O    X
     |               OXOX      O  X X
     |               OXOX      O  XOX
 15.5|_______________OXOX______O__XOX__________________________________________
     |               OXO       O  XOX
     |               O         O  XO
     |                         O  X
     |                         O  X
 14.0|_________________________O__X____________________________________________
     |                         O  X
     |                         O  X
     |                         OX X
     |                         OXOX
 12.5|_________________________OXOX____________________________________________
     |                         O OX
     |                           O
     |
     |
 11.0|----|----|----|----|----|----|----|----|----|----|----|----|----|----|---
      11        111   1   111
      121334567901224423790121223334566
      111022211113201320102022221122003
      850875698860879067765763177801830
The above chart is giving a conventional buy signal.
Cyclical and Seasonal Factors
Internal Program

Third System Confirmation
Margin
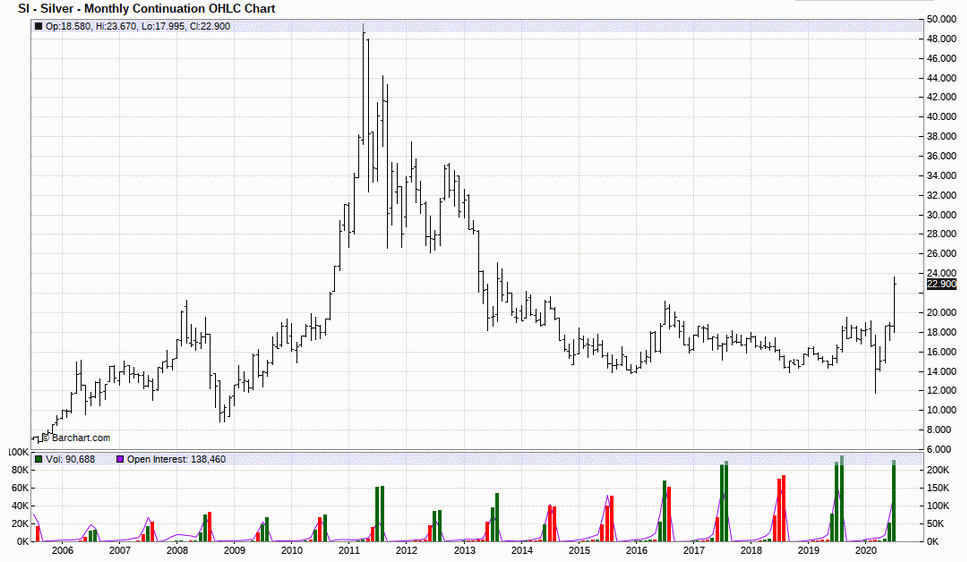
Historic Range
Commitment of Traders

Volatility / Probable Range

Possible Future Prices
Calendar Spread
Level Table:
 24.5|                                                                  R  7/23
 CMX - Sep-20 Silver Mini, 2500 oz. $/oz.    Cm.=0.02  Lim.= 0.8
     |
     |
     |[
 23.0|[[_______________________________________________________________________
     |[[
     |[[   <<<
     |[
     |[
 21.5|[________________________________________________________________________
     |Z
     |Z
     |Z
     |Z
 20.0|Z________________________________________________________________________
     |CDZ
     |CDZZZZZ
     |CDZZZZ
     |CCCCDDEEEMPWZZZZ
 18.5|CCCCDDDDEEEGMMPPPWWYZ____________________________________________________
     |CCDDDDDDDEEEEGGGHHHMMMMMMMNNPPPWWWXXYYYY
     |BDDDEEFFFFFFFGGGGGHLLLMMMMMNNNNNNNOOOOPPPPVVWWWWXXXYYYYYYY
     |BBBBBBCCCEEEFFFFFFFFGGHHLNNOOOOOOOOPPPQVVVVVWWWWWWXXXXXXXXYYYY
     |BBBBBBBBEEHJJJJJKLLNQQQQQVVVVWWWXXXXXY
 17.0|AAAAABBHHHHHJJJJJKKKKKKKKLLLLQQQQQQQVX___________________________________
     |AAAAKKKKQQQQQQV
     |AAQQQV
     |QTV
     |QSSTTTTUV
 15.5|QRSSTTTTTTUUUVVVV________________________________________________________
     |RSSSSTTTTTTUUUUUU
     |RRSTTUUUUUUU
     |RRRRSSSSSTUU
     |RRRRSSSSS
 14.0|RRSSSS___________________________________________________________________
     |RR
     |RR
     |RRRR
     |RRRR
 12.5|RRRRR____________________________________________________________________
     |RRRRR
     |RRRR
     |R
     |
 11.0|_________________________________________________________________________
     |
     |
     |
     |
  9.5|-A-B-C-D-E-F-G-H-J-K-L-M-N-O-P-Q-R-S-T-U-V-W-X-Y-Z----|----|-- TPO= 0.032
                 1 1 1 1 1 1 1
       7 8 8 9 9 0 0 1 1 2 2 2 1 1 2 2 3 3 4 4 5 5 6 6 7 7           7
       2 0 2 0 1 0 1 0 1 0 1 3 1 3 1 2 1 2 1 2 1 2 0 2 0 2           2
       5 7 1 5 9 3 8 1 5 2 6 1 5 0 3 8 3 7 3 7 1 6 9 3 8 2           3
Other Factors
