![]()
Introduction Nirvana Internal Progrm Historic Range10-10-2019: November Rough Rice: Muted Export Demand Due to Trade Policies
(Click on links below. Whole page needs to load before links work.)
Intermarket
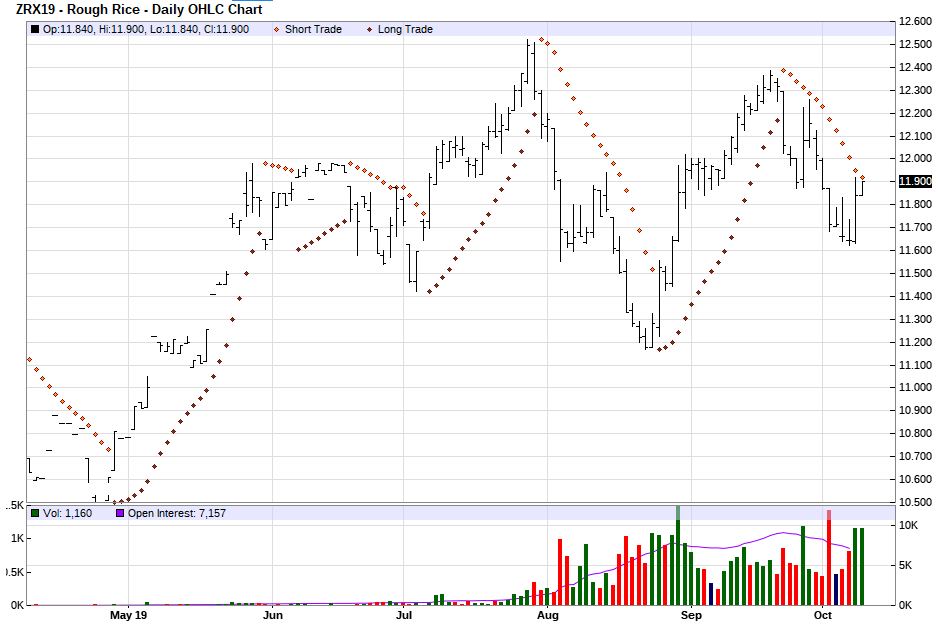
Parabolic
News
Point & Figure
Cyclic/Seasonal
Third System
Margin
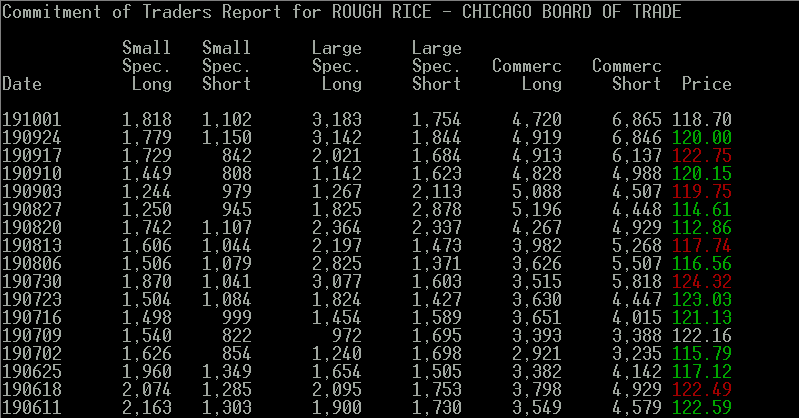
Commitment
Volatility
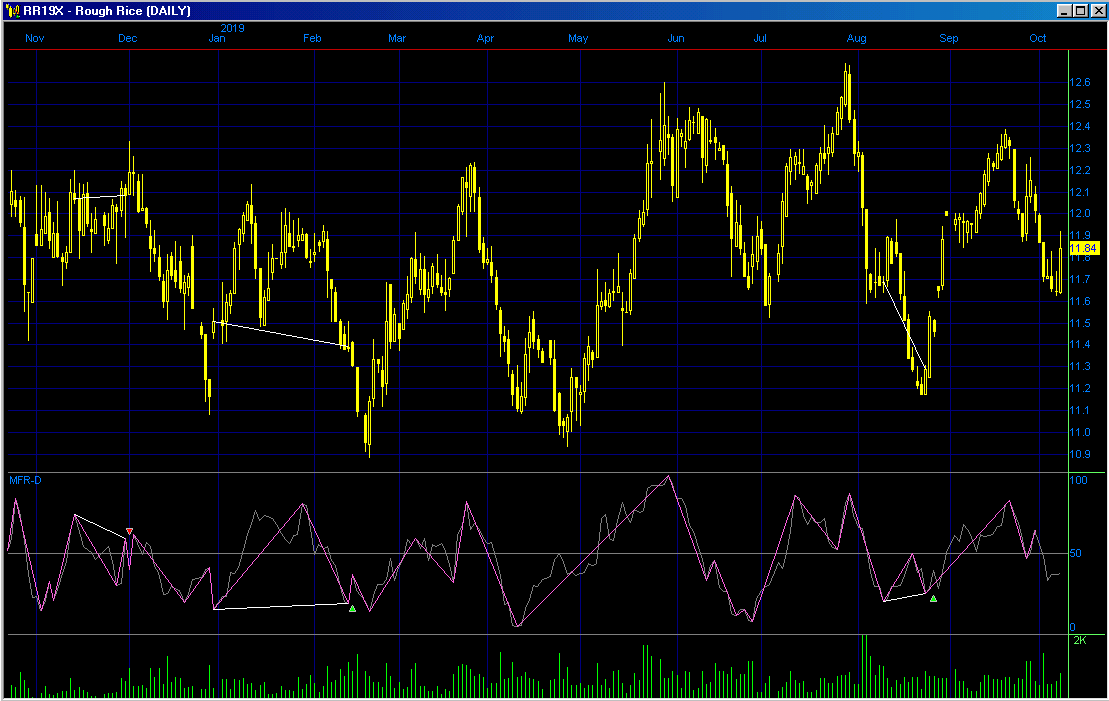
We fed Rough Rice, Soybeans, and Soybean Meal into a neural network to get the following result:
November Rough Rice:
November Rough Rice:
In Arkansas, many farmers are finishing their rice harvest and beginning soybean harvest. Others were preparing fields for next year's crop. Yields remain good. Rains received last week will slow things up in some counties while dry conditions caused concern for wild fires in other counties. Recently, modest sales increases were shown for the rice export market. A net total of 41,600 MT was on the low side of positive for the market in recent exports, but consistent sales in excess of 65,000 MT per week are needed to help keep the trade moving and year end carryout stocks under control. In Asian markets, benchmark pricing slipped slightly downward. Much of price fluctuations have to do with turmoil in international markets and politics. Some local supply and demand factors are playing into the Asian pricing as well. Projections for exports remain flat. Overall quality on the U.S. rice harvest seems good with minimal reports of damage.
There is muted demand for Indian rice despite price correction. Vietnamese rice rates edged up from a 12-year low benefitting from higher Thai rates. Concerns over supply persist due to floods in northeastern Thailand that have damaged rice growing areas. This does not seem to have had an immediate impact on rice prices, traders said. Buyers seem to be heading to Vietnam as prices in Thailand are a lot higher. Bangladesh is considering providing a subsidy to farmers who suffered a double blow of low rice prices and high harvesting costs, in an effort to reduce production costs and boost domestic output according to its agricultural minister. To make it profitable, they must use more machinery with the subsidy helpling farmers to buy machinery and minimize labor costs. Dhaka has been unable to clinch overaseas deals since a long-standing export ban was lifted in May, as its rice ismore expensive than India's or Thailand's, despite a recent fall in local prices.
Most rice shipments from Vietnam will be bound for West Africa and Malaysia.
Matthew Morell of the International Rice Research Institute said that traditional rice farming has to adapt as the world urbanizes. That includes using less water and increasing mechanization.
Climate change is expected to increase cost of farm programs. The Federal Crop Insurance Program, Agricultural Risk Coverage, Price Loss Coverage, and other programs of the USDA costs are expected to increase as weather averages and extremes change over the coming decades. Analyzed were direct impact of climate on yield risk, indirect effect of yield risk on price risk, and the impact of changed average yeild, production, and price on the total value insured. Total liabilities significance exceeded price volatility and yield volatility on the cost, although all factors were found to be significant. Insurance prices would be about 3.5% higher with a climate similar to the recent past, but under a higher emissions scenario, the cost increase could be 22%.
Mexico in September banned imports of Uruguayan rice after finding a khapra beetle in a container earlier this month. The National Health Service, Food Safety and Food Quality (SENASICA) in Mexico ha withdrawn Uruguay from the list of approved countries that can supply milled rice to Mexico. Uruguay had a 60% share for Mexico's milled rice imports so far this year. The U.S, as the second largest supplier, has an opportunity to showcase the quality and reliability of U.S. milled rice to the trade in Mexico while Uruguay is out of the market. Argentina, Brazil, Guyana, India, Italy, Paraguay, Thailand, and Vietnam can also supply milled rice to Mexico. Their combined exports to Mexico in the first eight months of 2019 amounted to less than 5,000 metric tonnes. Uruguay has supplied 72,000 MT and the U.S. 45,000 MT.
Lots of rain in MIssouri helped rice farmers reduce water bills, but hindered spraying and fertilizing in a timely manner. Lack of grass control increased populations of rice stinkbugs. Sopme fields were sprayed twice. The yields are a little below average. Acreage for rice in Missouri is down between 20% and 30% from the previous year.
The forecast for worldwide output of milled rice for the current crop year was lowered by 3.8 million MT to 513.5 MT, due to unfavorable weather in major rice-growing countries including the Phillippines, according to the United Nation's Food and Agricultural Organization. The all-time production high was last year at 517.3 million tons. Decreases are described as "small."
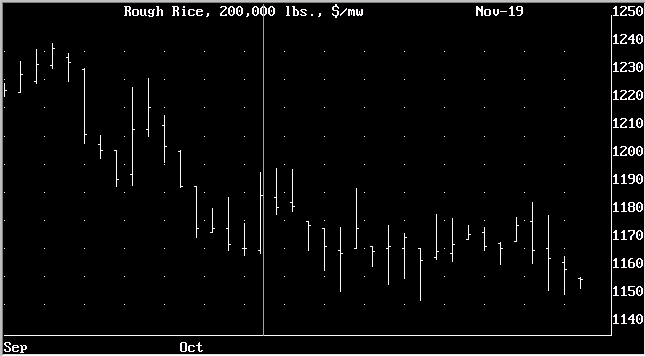
Our assessment of the current news is that rice prices are described by many sources as "stable" but are oscillating about current levels making for reactive trading opportunities. A trading range of roughly 11.40 to 12.40 per hundredweight. We appear to be in the middle of that range but headed downward. Muted demand from Asia appears to be the most significant news factor.
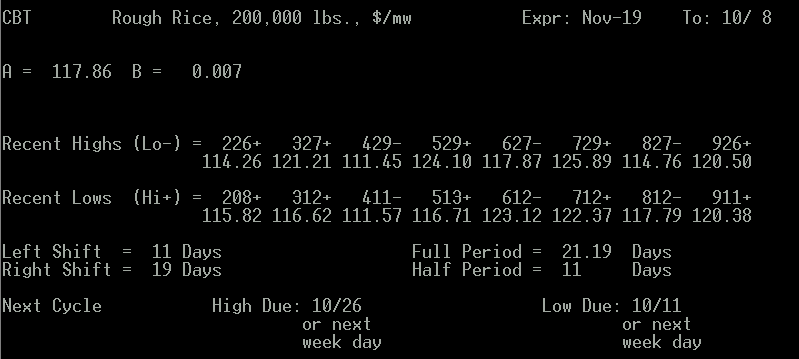
We are headed toward a cyclical high and a seasonal down period.
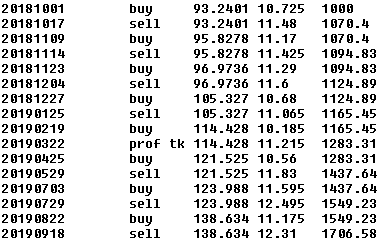
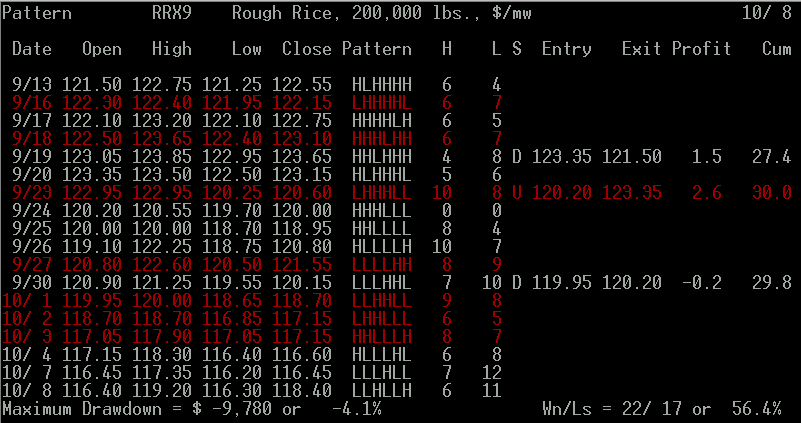
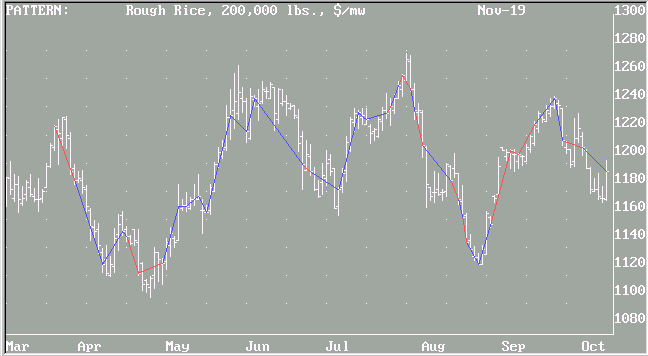
Our best-performing internal program is "Pattern". It is giving a sell signal.
Results of "Pattern" for Rough Rice (blue lines = successful trades, red, unsuccessful):
(Always in the market.)
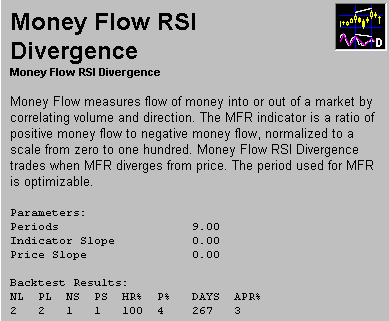
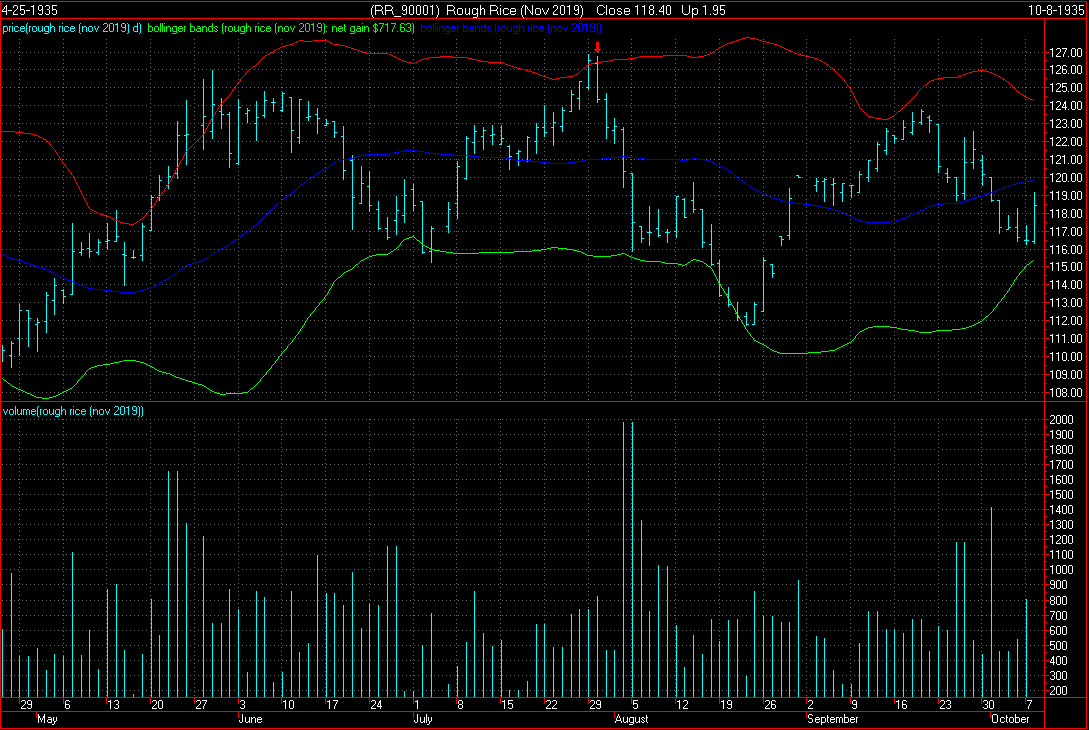
Our third system has triggered a sell signal. (Note, disregard the year on the chart. Our regular readers know this is not a Y2K-compliant system, but it still works.)
The point value is $200 when price quoted 10X exchange price. Initial margin on a single contract is $825. Use of options is not advised.
Scale trade buyers are entering the market for the long term in this price range.-->
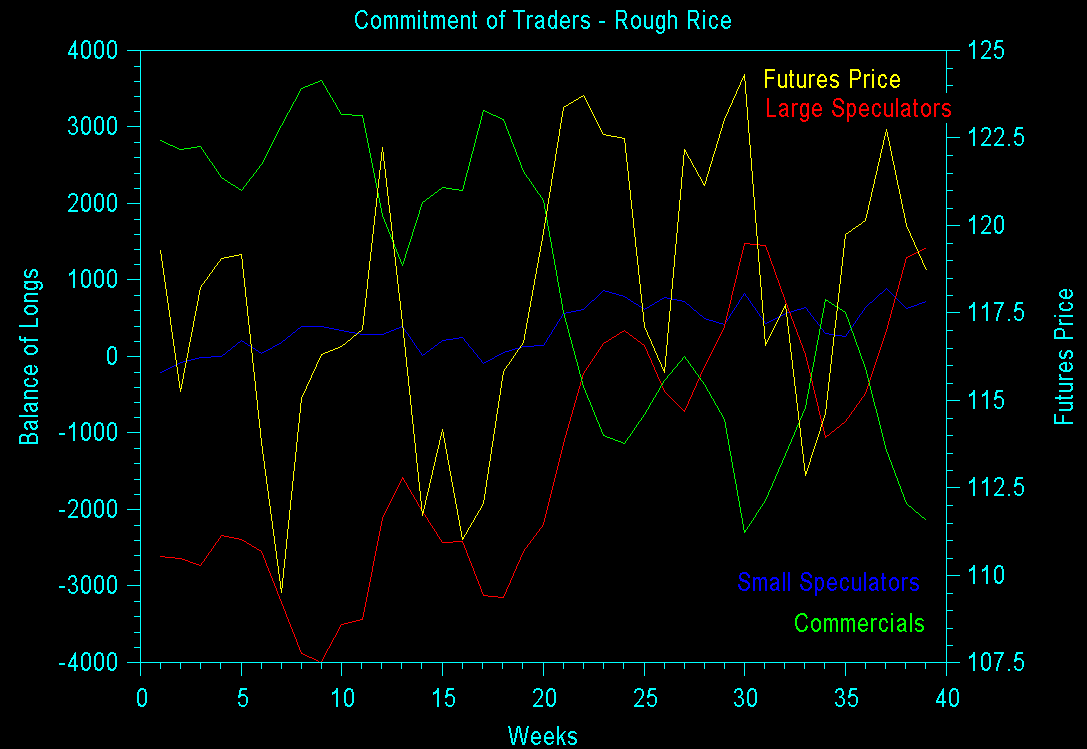
In the chart below, the yellow line is the futures price, read on the right axis. All other colors are read on the left axis. Blue is small speculators. Red is large speculators. Green is commercials. Large speculators with the best track record are getting increasingly-long.
Interpretation of a Different Site Below (Their trader categories may vary from ours):
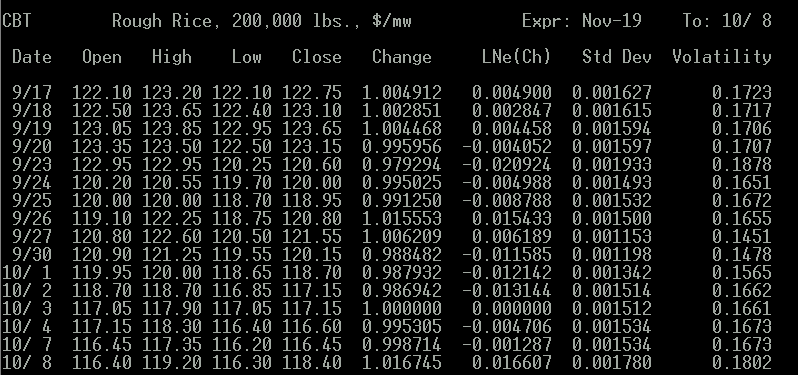
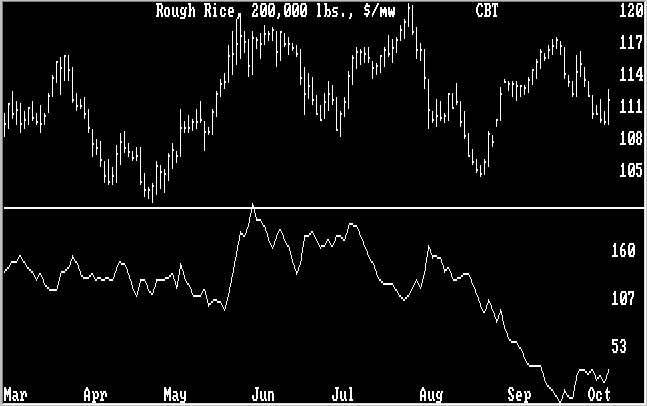
The average volatility shown below suggests that a change in major trend to up is imminent near a volatility low point.
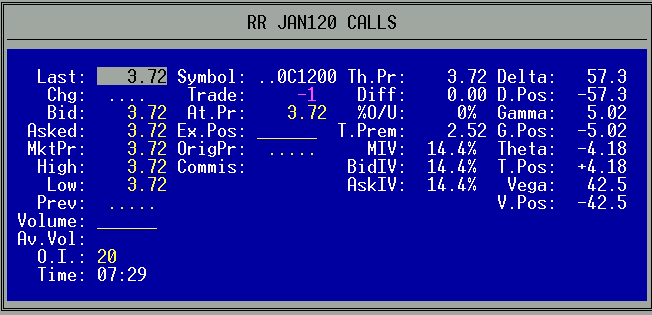
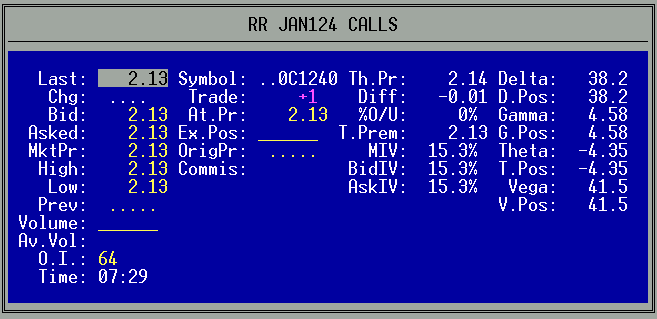
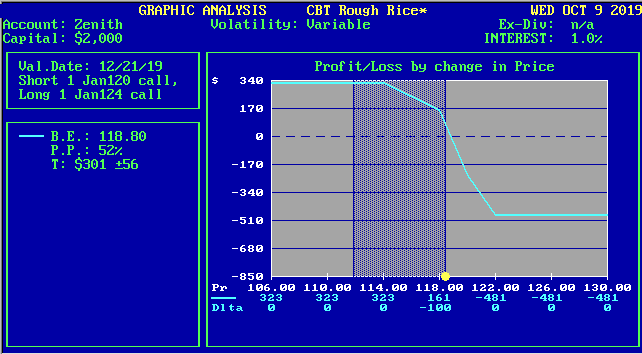
Our option trade recommendation is to Sell (1) Rough Rice January 120 Call and Buy (1) Rough Rice January 124 Call @ 1.59 to the Sell Side or Better.
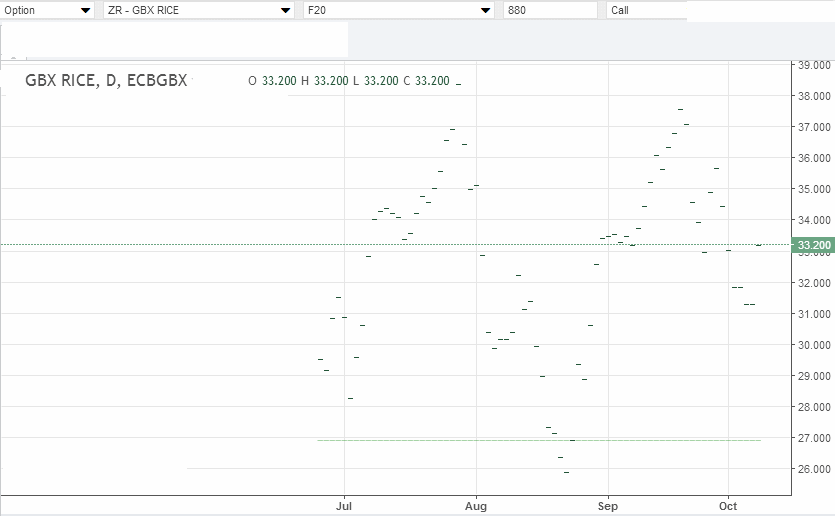
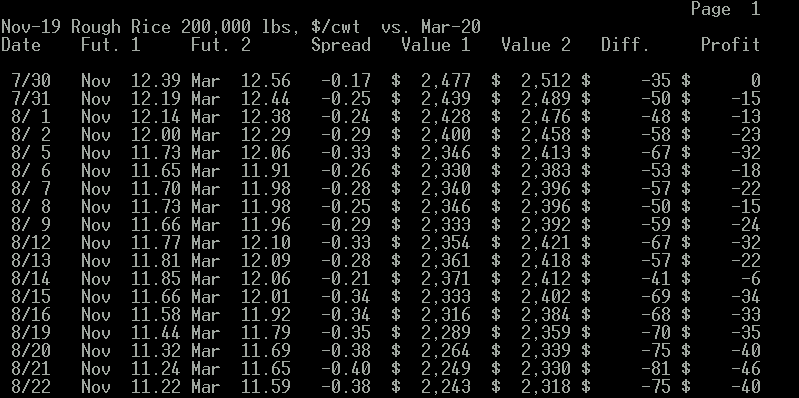
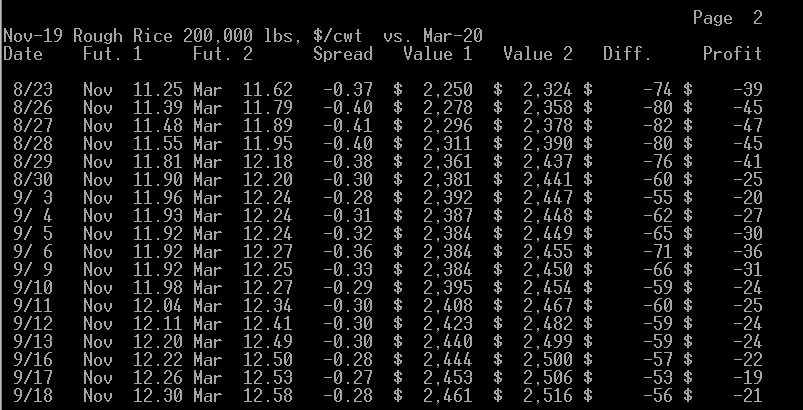
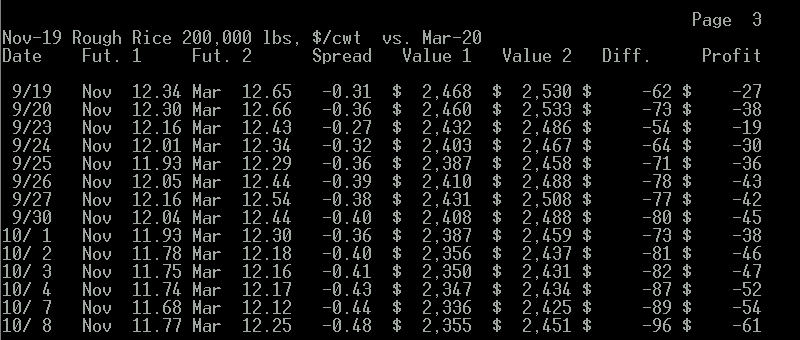
What the Nov. - Mar. calendar spread suggests to us is that buying the near contract and selling the far one is at most times not profitable, which we think is a sign that these futures may go down in the long run. The best time to enter or leave the above spread is when it is at -0.15 or narrower buying the far as prices are rising and then selling the near, and exiting or entering when it is at -0.48 or wider selling the far as prices are falling and then buying the near. At this time, we appear to be at the sell the far, buy the near point.
To view the chart below correctly use Microsoft Internet Explorer.
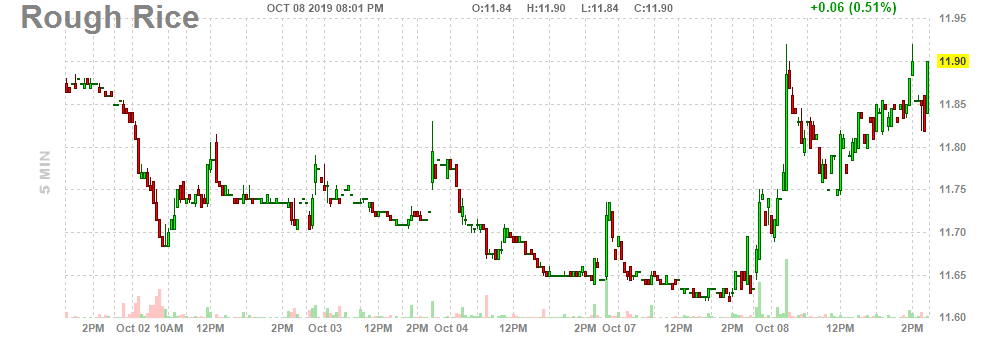
Here's an intraday chart for a previous day ( 10/09 ).
Introduction
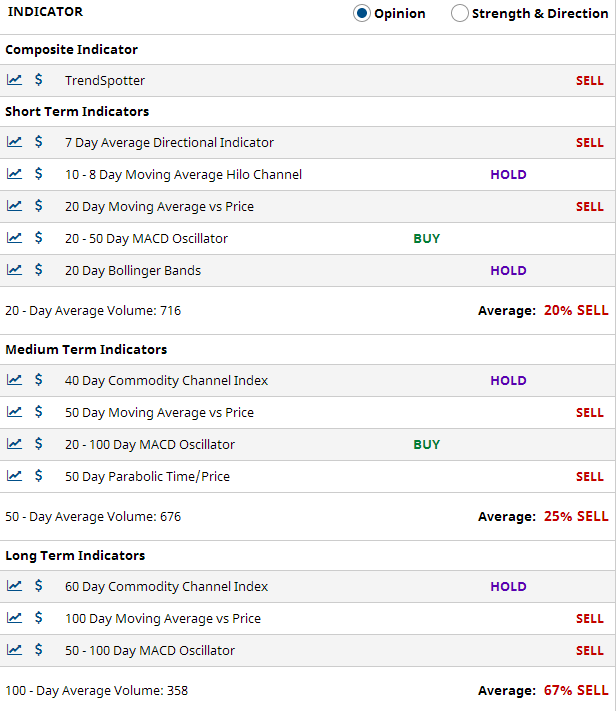
Rice is in a very stable pricing zone right now, makiing it harder to predict what it will do next. We had to double-weight our already weak interpretation of the news in order to break a tie in our Decision Matrix made up mainly of technical indicators. If it is in a trading zone, tghen we think it is currently about in the middle of that zone, possibly headed downward, but one might best wait until it reaches well-defined previous supporet and resistance levels before jumping into a trade. Crop conditions generally look normal to good in a world where trade barriers have distorted the picture somewhat and caused a backup in the rice inventory chain. We think the chances are it will go a little lower from here before going higher.
Intermarket Analysis


Parabolic Chart
Nirvana Chart
News Analysis
Point & Figure Chart
128.0I                                                                  T 10/ 8
     I CBT - Nov-19 Rough Rice, 200,000 lbs., $/mw Cm.=0.01  Lim.= 1.0
     I
     I
     I                                                                X
125.5I__________________________________________________X_____________XO_______
     I                                                X XO            XO
     I                                                XOXO            XO
     I                                                XOXOX           XO
     I                                                XOXOXOX       X XO
123.0I________________________________________________XOXOXOXO______XOXO__X____
     I                X                               XOXOXOXO      XOXO  XO
     I                XO                              XO OXOXO    X XO O  XOX
     I        X       XO                      X       X  OXO O    XOX  O  XOXO
     I        XO    X XO                    X XO      X  O   O    XOX  O  XOXO
120.5IX_X_X___XOX___XOXO______X_____________XOXO______X______O____XO___O__XOXO_
     IXOXOXOX XOXOX XOXO      XO            XOXO      X      OX   X    O  XOXO
     IXOXOXOXOXOXOXOXOXO      XOX X         XOXO      X      OXO  X    O  XOXO
     IXO O OXOXOXOXOXO O      XOXOXO        XO O      X      OXOX X    OX XO O
     I     O OXOXO OX  O  X   XOXOXO    X   X  O      X      OXOXOX    OXOX  O
118.0I_______OXO___O___OX__O__XOXOXO____XO__X__O______X______OXOXOX____OXOX__O_
     I       OX        OXO O  XOXO O    XOX X  O    X X      O OXOX    OXOX  O
     IX      O         OXO O  XOX  O    XOXOX  O    XOX        O OX    OXOX  O
     IX                OXOXO  XOX  O    XOXOX  O    XOX          OX    OXOX  O
     IX                O OXOX XOX  O  X XOXO   O    XOX          OX    O OX
115.5IX__________________OXOXOXOX__O__XOXO_____O____XOX__________O_______OX____
     IX                  O OXOXO   O  XOX      OX   XOX                  OX
     IX                    OXO     O  XOX      OXO  XOX                  OX
     IX                    OX      O  XO       OXO  XO                   OX
     I                     O       OX X        OXO  X                    OX
113.0I_____________________O_______OXOX________OXO__X____________________OX____
     I                     O       OXOX        OXO  X                    OX
     I                     O       OXOX        OXOX X                    O
     I                     O       OXO         OXOXOX
     I                     O       OX          O OXOX
110.5I_____________________________OX____________OXO___________________________
     I                             OX            OX
     I                             OX            O
     I                             O
     I
108.0I----I----I----I----I----I----I----I----I----I----I----I----I----I----I---
       1111111111111111111111
       11111111111111112222221111111222233333333444555555566666667777777888999
       00000001112222330112230011223222200112222112001122201112220011223012223
      012256883560788004791413447340056748380558279125789931291482569350756370
The above chart is giving a conventional sell signal.
Cyclical and Seasonal Factors
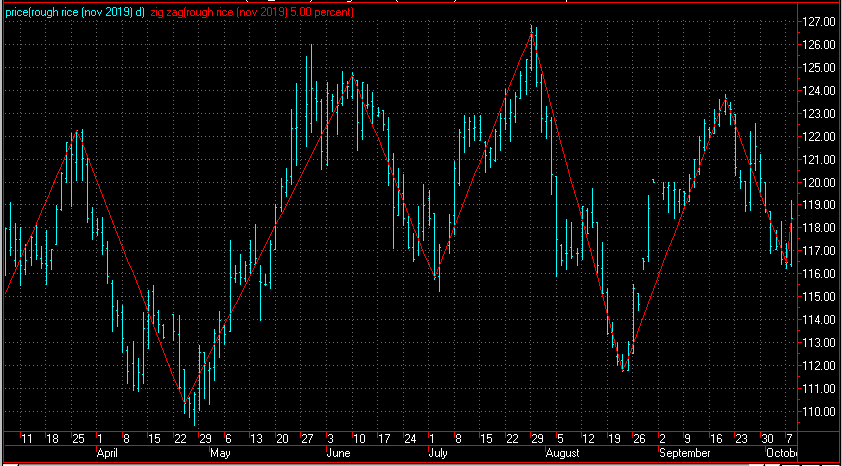
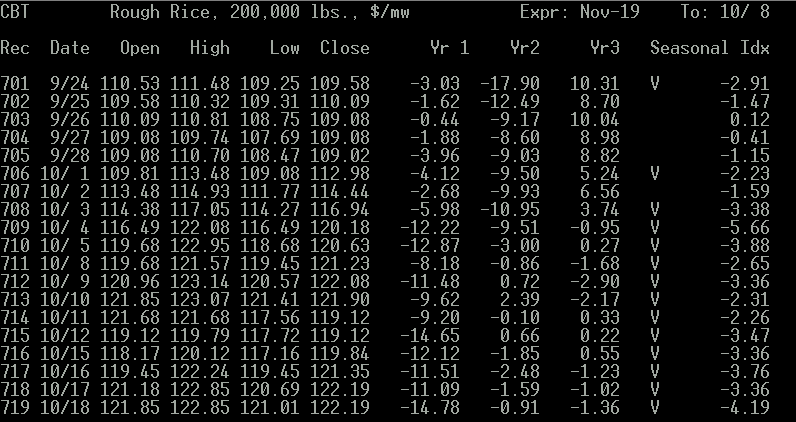
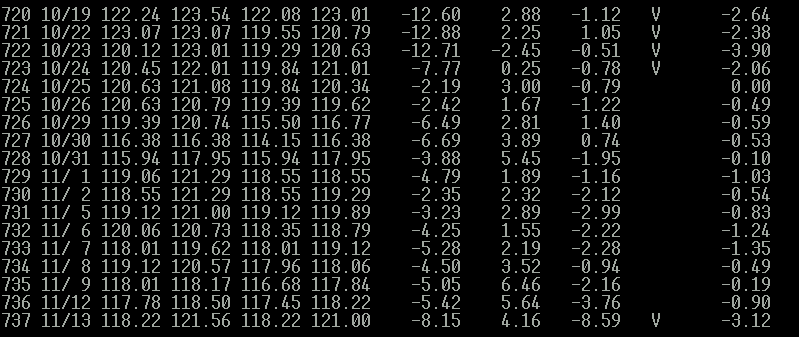
Internal Program
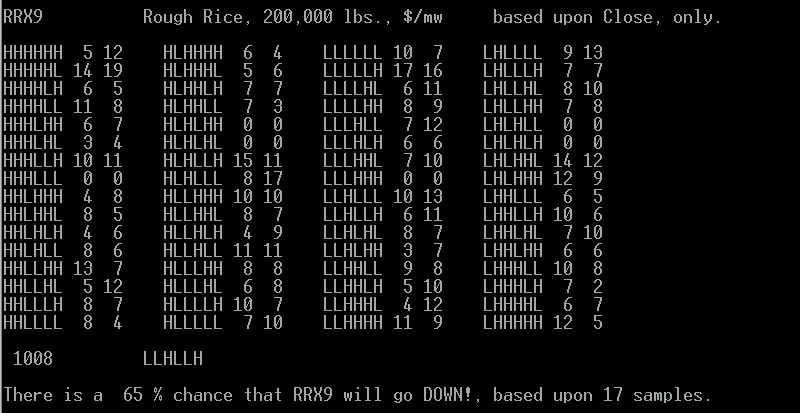
Third System Confirmation
Margin
Historic Range
Commitment of Traders

Volatility / Probable Range

Possible Future Prices
Option Recommendation
Calendar Spread
Level Table:

127.0|                                                                  T 10/ 8
 CBT - Nov-19 Rough Rice, 200,000 lbs., $/mw Cm.=0.01  Lim.= 1.0
     |VV
     |QVV
     |QQVV
124.5|QQVVV____________________________________________________________________
     |QQRRUVVV
     |QQQRRRRRRRRSUUVV
     |AQQQRRRRRRRRSSUUUVYYY
     |AAADQQQQRRRRRRSSSUUUUVVYYYY
122.0|AAAAADDQQQQRRRRRSSSTTUUUUUVVVYYYYZZ______________________________________
     |AAAAABCDDMMMQQQRRRRSTTTUUUUUVVYYYZZZ
     |AAAAAABCCDDDDEMMMMQQRRRSTTUUUUVYYZZZ
     |AAAAABBBBBCCCCCDDDDDEGMMMMMQQRRSSTUUUVYYZZZZ
     |AAAABBBBBBBBCCCCCCDDDDEGGMMMMMQQSSSTTUVYYZZZZZ
119.5|AAAAABBBBBBBBCCCCCCDDDDDDDDEGGGHHHMMMMQQQSSSSTTVVXXXXYYZZZZZ_____________
     |AAAAABBBBBBCCCCCCCDDDDDDEEGGGHHHHHMMMQQSSSTTTVVWXXXXYYZZZ
     |AAABBBBCCCCCCDDDDEEFGGGGHHHHHHHHJJLMMMQQSSSTTTVWXXXXYZZZ[
     |AAABBCCCCCCDDEEEEEFGGGGHHHHHHHJJJLMMMQSSSTTTTTTVWWWXXZ[
     |AAABCCCCDEEEEEEEFGGGGGHHHHHHJLLLLLMMMNPQSSTTTTTVVVWWWWXZZ[   <<<
117.0|ABBCCEEEEEEFGGGGGGHHHJLLLLLLLMMNPQSSSTTTTVVVWWXZZZ[______________________
     |BBCEEEEEEFFFGGGGJJLLLLLLLLLLMNNPPPQSTTTTVVVVWWWWXZZ[[
     |BBEEEFFFFFGGGGJJJKKLLLLLLLLMNPPPPPQTTVVVWWWXZ[[
     |BBBEEFFFFFGGJJKKKLLLLLNPPPPPQQTTVW
     |BBEFFFFFGGJJKKKKLLNOPPQQQTWX
114.5|BFFFFFGGJJKKKKNNOPQWXX___________________________________________________
     |BFFFFJJJKKKKNNNNOPQWXX
     |FJJJJKKKKNNNNNOOOOPPQWX
     |FJKKNNNNOOOOPPPPWWX
     |FJKKKKNNNNOPPPWWXX
112.0|FJKKKNNNOOOPPWWXX________________________________________________________
     |FFJKKKNNNNOOOPPWWX
     |FFJKKKNNNNOOOOPP
     |FJKNNOOOOP
     |KKOOOOP
109.5|KKOOOO___________________________________________________________________
     |KKO
     |K
     |
     |
107.0|-A-B-C-D-E-F-G-H-J-K-L-M-N-O-P-Q-R-S-T-U-V-W-X-Y-Z----|----|-- TPO=-0.967
       1 1 1 1 1 1                                       1           1
       0 0 1 1 2 2 1 1 2 2 3 3 4 4 5 5 5 6 6 7 7 8 8 9 9 0           0
       1 2 0 2 0 2 0 2 0 1 0 1 0 1 0 1 3 1 2 1 2 0 2 0 2 0           0
       1 4 7 1 6 0 7 1 4 9 5 9 2 6 1 5 0 3 7 2 6 9 3 9 3 7           8
Other Factors
                 Risk Versus Opportunity Report
                ________________________________

                 RRX9    November Rough Rice

                      High Price:  12.16
                   Current Price:  11.84
                       Low Price:  11.18

                            Risk: -0.055
                     Opportunity: -0.113

                    (O/R) Ratio =  2.063