![]()
Introduction Nirvana Internal Progrm Historic Range05-25-2020: August Gasolline: Pessimism Surrounds Any Near-Term Gasoline Price Recovery
(Click on links below. Whole page needs to load before links work.)
Intermarket
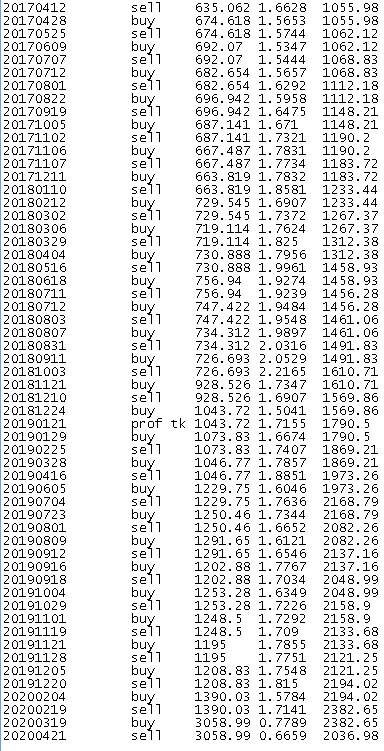
Parabolic
News
Point & Figure
Cyclic/Seasonal
Third System
Margin
Commitment
Volatility
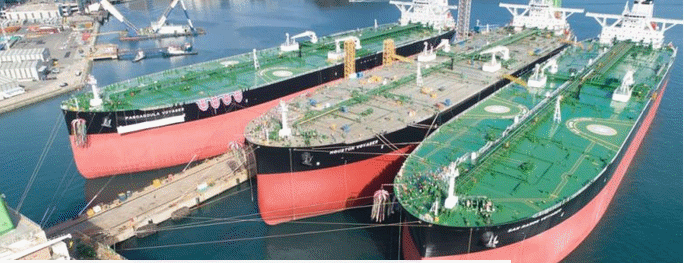

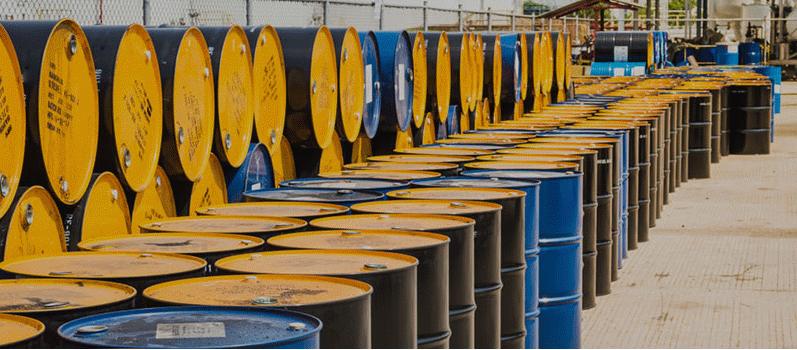


The products markets, gasoline and heating oil, have as a result become extremely volatile. Huge moves follow what's going on with crude oil Some refiners are encouraged to keep pouring out gasoline inventory into the system in order to make way for crude oil storage. Smaller producers are being driven out of business by lower prices caused by the Saudi-Russian attempt to drive everyone else out of business. Large American oil esploration and refining companies are able to withstand a lot of price pressure due to their balance sheets and ability to borrow money, but Shell Oil has been contemplating selling all its retail stations, or so we are told, although it just bought a Valero retail outlet near us.
We have the Saudis to thank for much of this. They are using tactics by monopolies at the turn of the last century when big corporations set up outlets across from smaller ones and undercut their prices until they were driven out of business. In the meantime, Pompeo, Trump's lackey Sec'y of State is wining and dining big bucks supporters and shipping off weapons to the Saudis to thank them for driving smaller American concerns out of business.
How long can all this pandemic stuff laced with Saudi undercutting go on? We think until the next national election, and possibly beyond if Trump and his henchmen win. That's long enough to drive gasoline prices down, but ultimately we all know they will have to go higher.
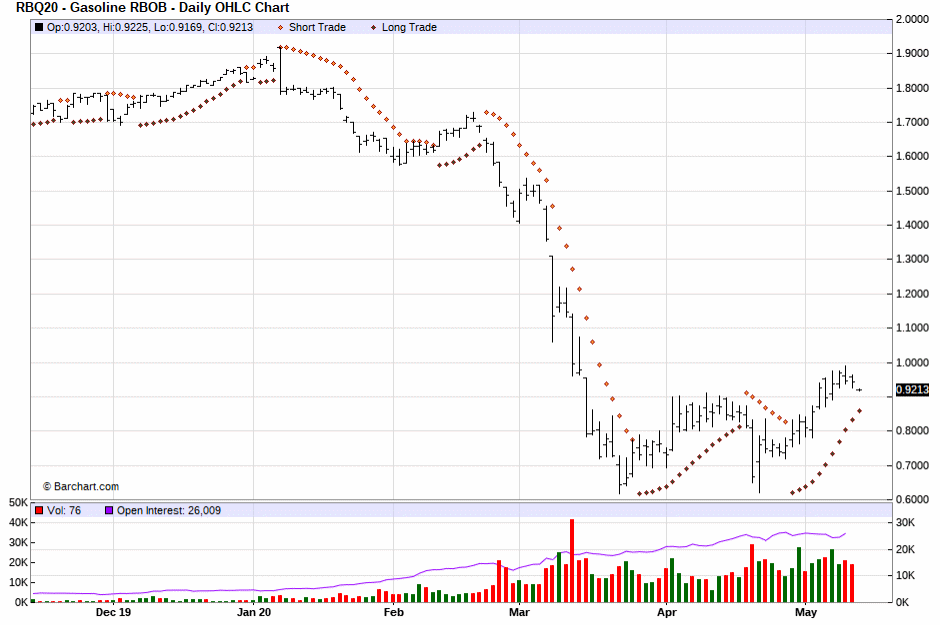
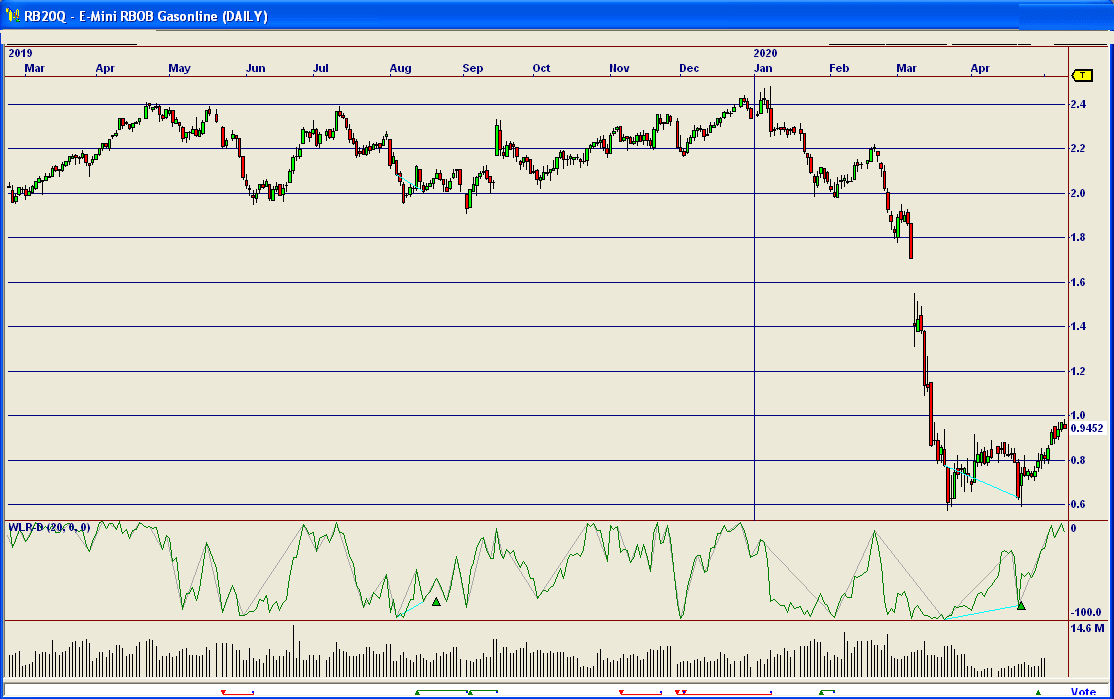
We fed Gasoline, Crude Oil, and Heating Oil into a neural network to get the following result:
August Gasolline:
August Gasolline:
There is a significant "floating supply" of crude oil headed toward the U.S. on tankers temporarily being sed as storage. India has cancelled several cargoes scheduled to arrive this month and next month. In Germany, however, there are growing signs of global demand with reports that driving activity in Germanyi has jumped enough to produce aa increase in traffic jams. Some analysts however have suggested that gasoline demand may remain as much as 46% below normal levels. Fuel demand needs to jump sigtnificantly to soak up the supply built up within the distribution system. The market has already seen 2 weeks of notable declines in U.S. gasoline stocks with the year over year surplus reduced by 6.2 million barrels since April 17th.
Vertically-integrated sompanies may ramp up gasoline refinery activity as a way to free up storage space for ceude oil. Cumulative gasoline, distillate, and ultra-low-sulfur diesel inventories still have a year-over-year surplus of 83 million barrels. Some see the RBOB contract as relatively expensive and in need of a third straight week of gasoline declines to extend the recovery. At current levels the RBOB cibtract wukk see resustabce between 97 and 100.
Demand for gasoline is rebounding across the U.S. as more states begin to loosen restrictions and reopen their economies amid the coronavirus pandemic. Continued recovery in gas prices will nearly completely depend on improvement in the coronavirus situation. In the Pittsburgh area, gasoline prices averaged $2.16/gallon, up 1.2 cents from a week ago, while the national average rice was $1.83/gallon, up 6.4 cents in the past week.
Recent oil futures prices dropping below zero shook up energy markets. At one point crude oil hit -$38/barrel as traders scrambled to find ways to avoid deliveries with no place to store oil.
Crude oil staged a small rally after plunging to the lowest prices seen in many years. WTI intermediate crude closed as low as $10/barrel a few weeks ago. But it has since climbed back into the $20-$30 range.
In January, the U.S. exported more oil than it produced for the first time in history. $3/gallon gasoline for most of the country is considered very unlikely for most of the country, but three CAlifornia cities are likely to top $4, according to Gas Buddy, namely Los Angeles, Sacramento, and SAn Francisco. California typically has the highest prices among the lower 48 states.
Saudi Arabia has offered deep discounts to refineries that bought its oil and deep discounts to Asian customers. In March there was a record jump of 19.3 million barrels in crude stockpiles in one week. The build was 65% above forecasts and brought inventory gains to nearly 50 million barrels in three weweks. In the same period, bhe build in gasoline stocks came in at 25% less than forecast. That helped gasoline futures do better.
Saudi Arabia's national oil company offered credits through Saudi banks in recent weeks to bolster its market share. Aramco offered Asian buyers of its May Arab light crude oil a discount of $7 .30 versus the competing Oman/Dubia average. The official seeling price for Arab light crude to Asia was at a discount of $4.20/barrel. This is inconsistent with a Saudi policy of officallyi agreeing with the world int he need to cut oil production.
The vast majority of gas stations are now independently operated. Twelve years ago Exxon Mobil announced it was selling its 2,200 compoany-owned gas stations. Big oil companies have largely exited the business of owning gas stations that cary their signage because it was hard to make money on them.
In California, the Governor has asked the state attorney general to look into a differential of 20 to 50 cents per gallon that California motorists have paid tha cannot be accounted for after taxes and fees are taken out.
One source stated it takes as much as 6 weeks for crude oil pricing events to be reflected in gasoline prices. GasBuddy says motorists rushing to fill up today are wasting their money as prices will continue to drop. Gas stations passing along the drop in oil prices are several weeks behind, and there's plentyi of more roomk for prices to drop accordingn to that source.
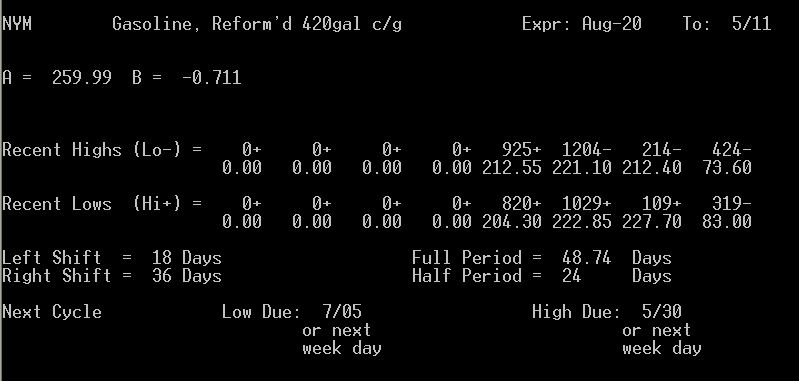
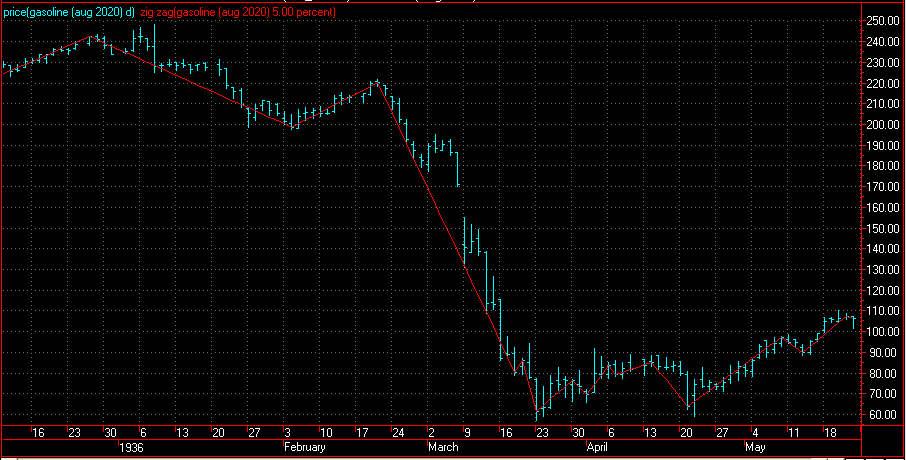
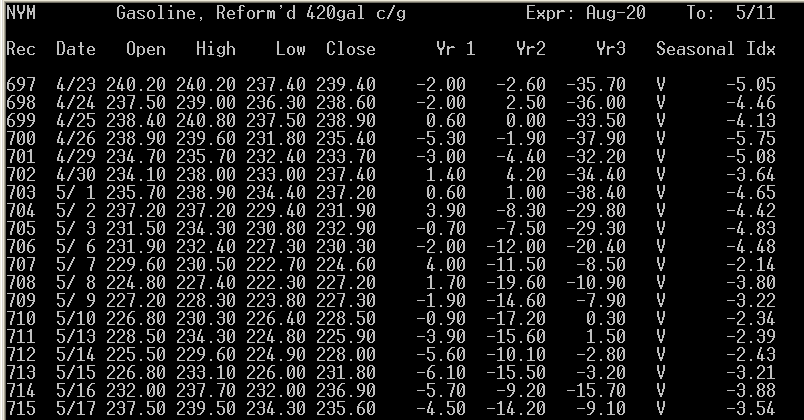
We are headed toward a cyclical high and a seasonal up period.
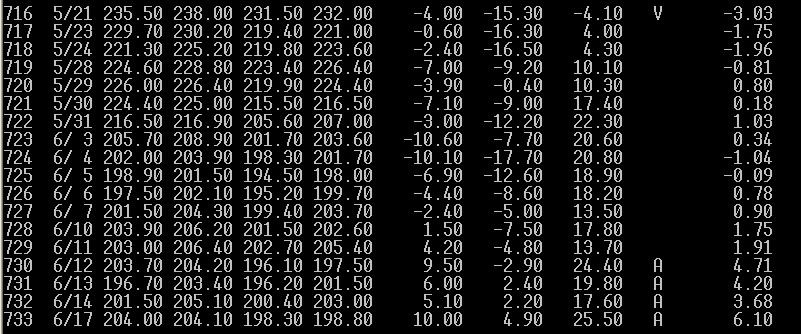
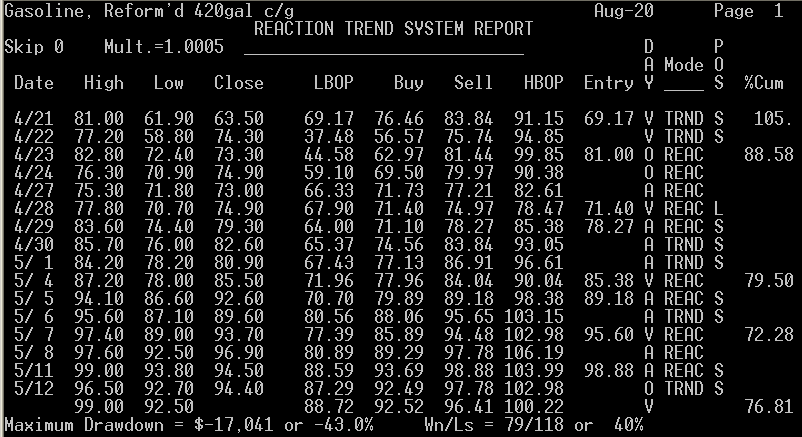
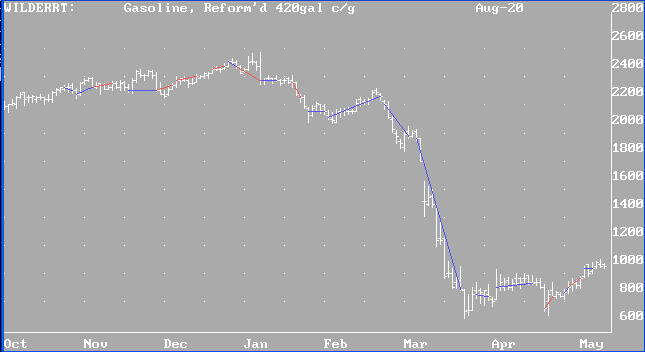
Our best-performing internal program is "WilderRT". It is giving a sell signal.
Results of "WilderRT" for Gasoline (blue lines = successful trades, red, unsuccessful):
(Always in the market.)
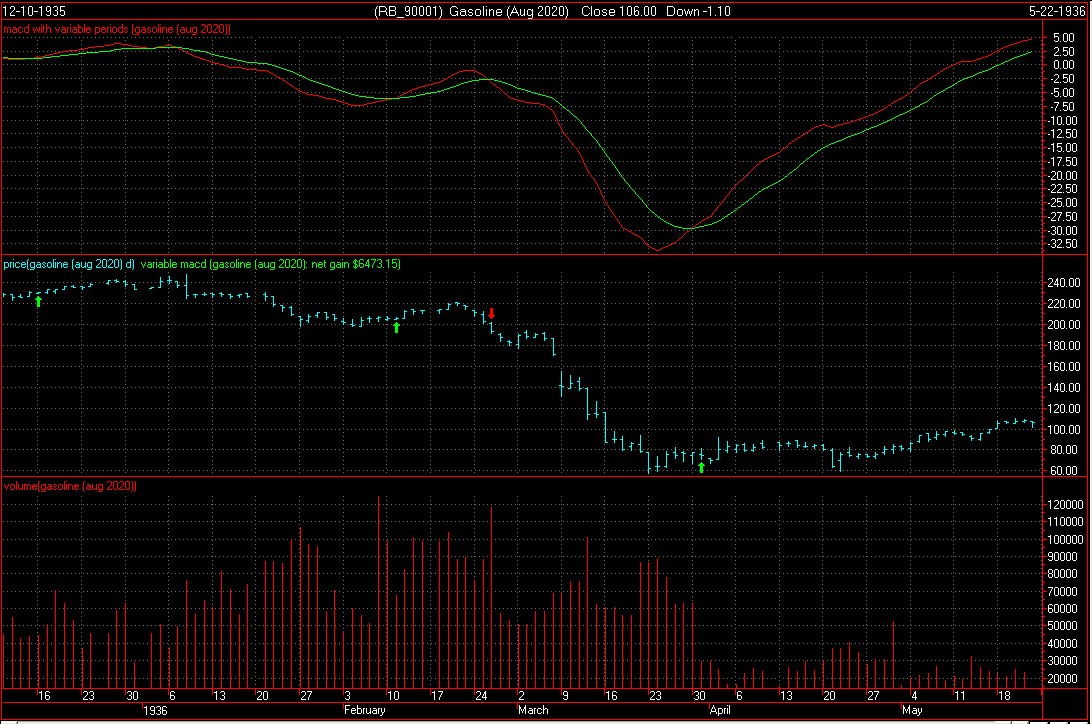
Our third system has triggered a buy signal. (Note, disregard the year on the chart. Our regular readers know this is not a Y2K-compliant system, but it still works.)
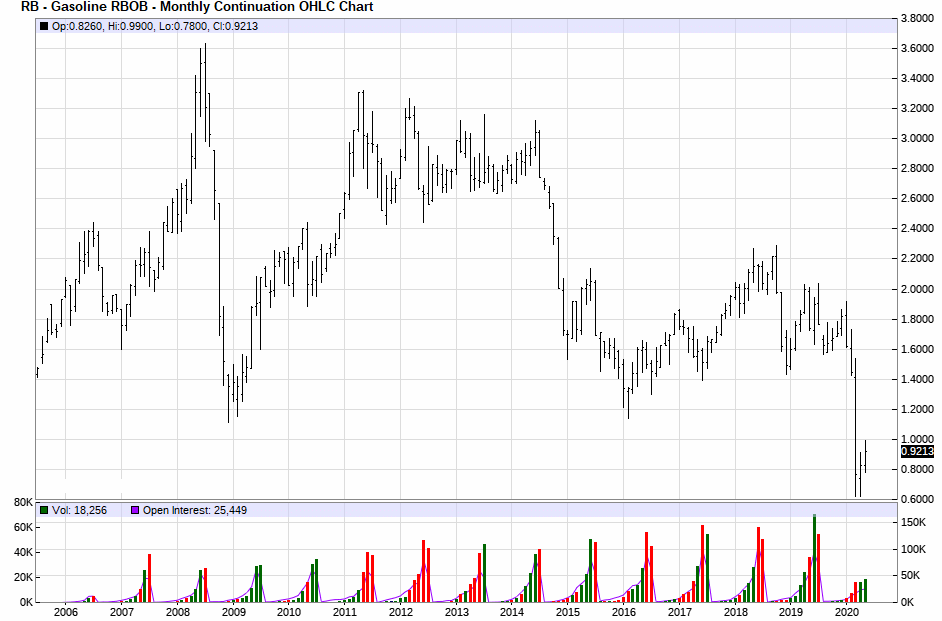
The point value is $420. Initial margin on a single contract is $10,450. Use of options is advised.
Scale trade buyers are entering the market for the long term in this price range.
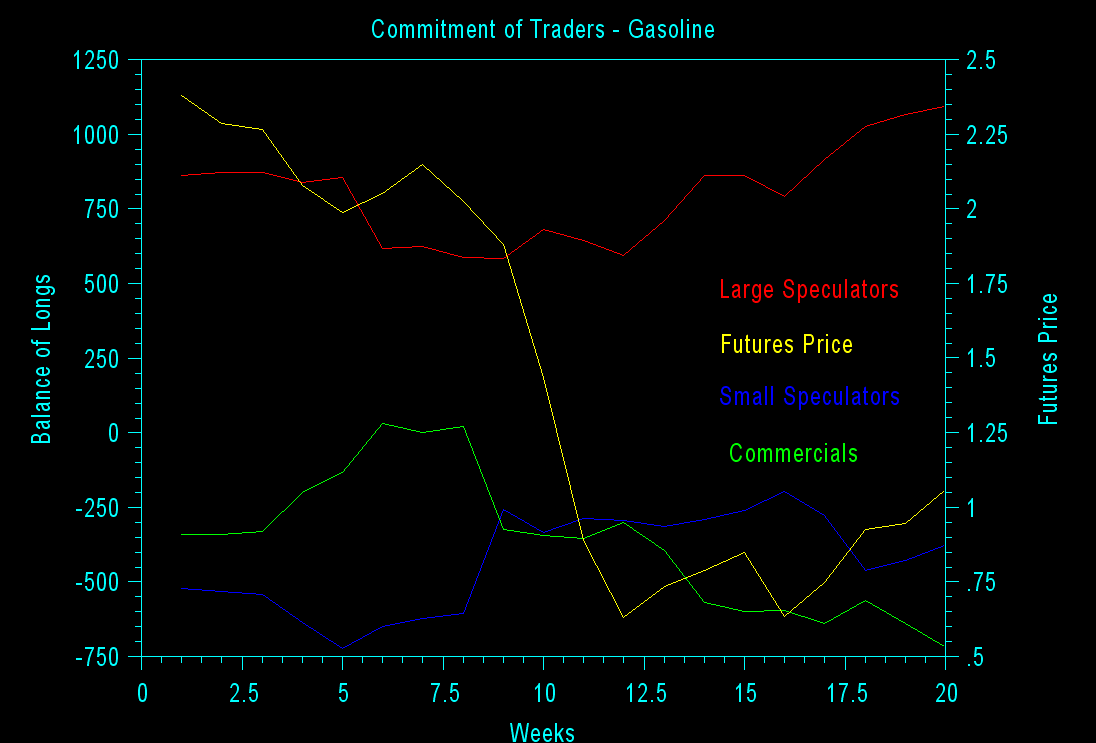
In the chart below, the yellow line is the futures price, read on the right axis. All other colors are read on the left axis. Blue is small speculators. Red is large speculators. Green is commercials. Commercials with the best track record are getting increasingly-short.
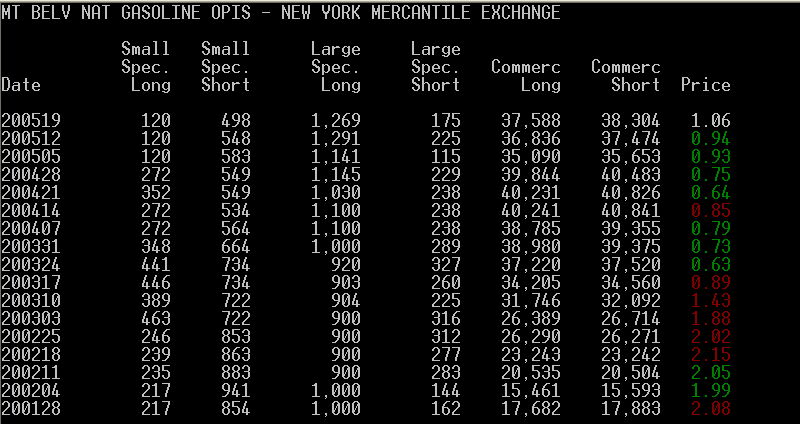
Interpretation of a Different Site Below (Their trader categories may vary from ours):
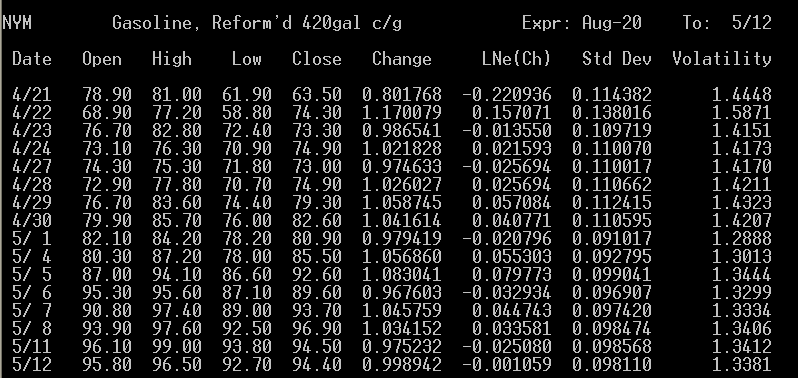
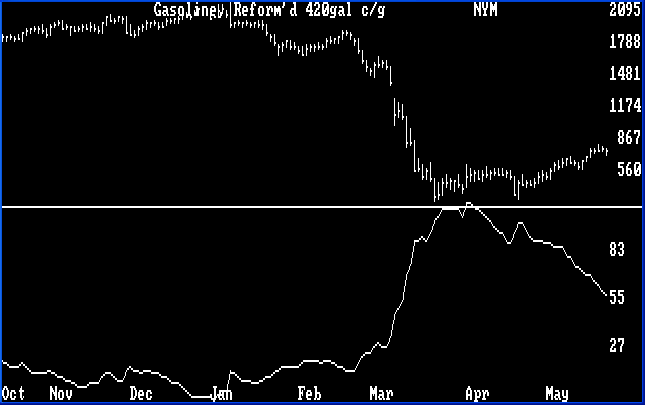
The average volatility shown below suggests that a downtrend remains intact from the last volatility low point.
An option trade recommendation may be placed later in this spot.
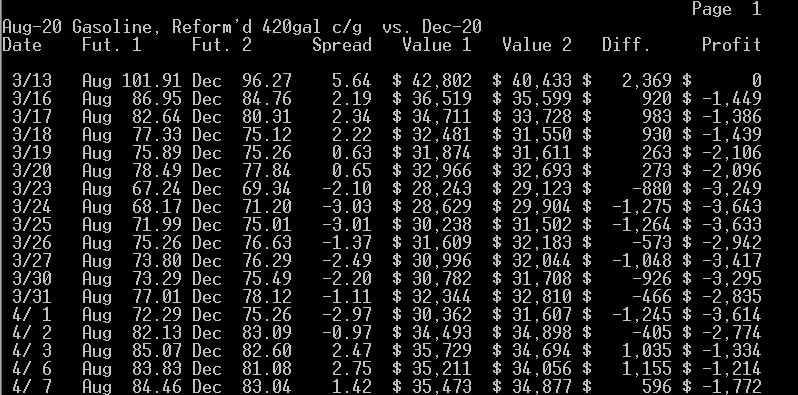
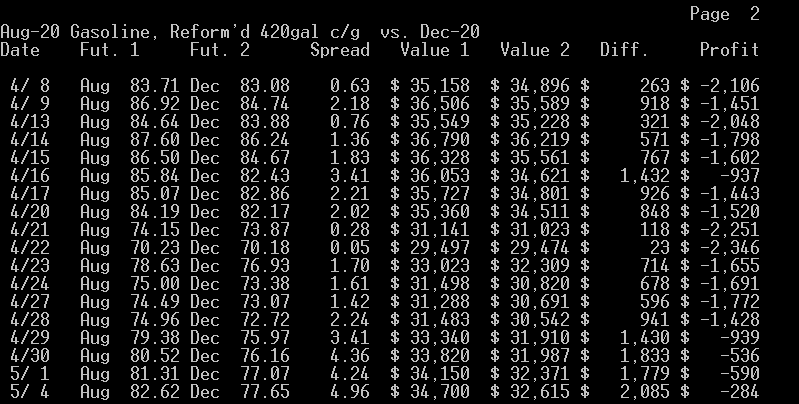
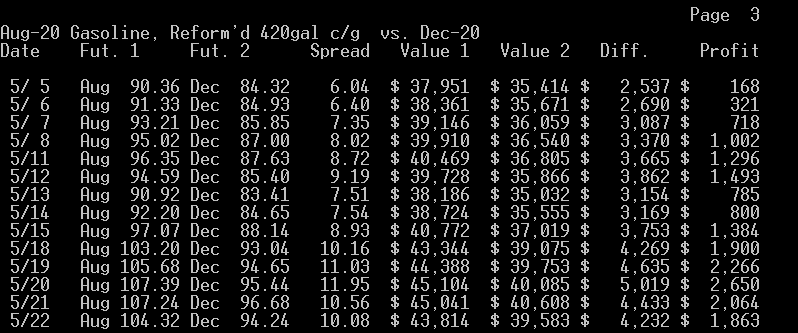
What the Aug. - Dec. calendar spread suggests to us is that buying the near contract and selling the far one is at most times profitable, which we think is a sign that these futures may go up in the long run. The best time to enter or leave the above spread is when it is at 0.20 or narrower selling the far as prices are falling and then buying the near, and exiting or entering when it is at 11.00 or wider buying the far as prices are rising and then selling the near. At this time, we appear to be near the buy the far, sell the near point.
To view the chart below correctly use Microsoft Internet Explorer.
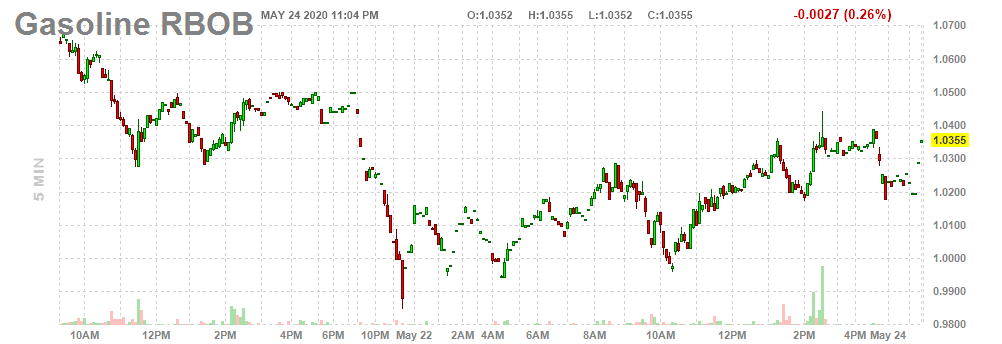
Here's an intraday chart for a previous day ( 7/11 ).
Introduction
The energy markets, particularly on the Nymex Exchange, have been shaken up by an extremely negative futures price for crude oil on an expiring contract recently, for the first time in history. There was simply no place to store deliveries. Traders were paying to have someone take the deliveries off their hands.
Intermarket Analysis


Parabolic Chart
Nirvana Chart
News Analysis
Point & Figure Chart
296.0|                                                                  T  5/11
     | NYM - Aug-20 Gasoline, Reform'd 420gal c/g  Cm.=0.01  Lim.= 0.5
     |
     |
     |
276.0|_________________________________________________________________________
     |
     |                        X
     |                    X   XO
     |                    XO  XO
256.0|____________________XO__XO_______________________________________________
     |                    XOX XO
     |                    XOXOXO
     |                    XOXOXO              X
     |                    XOXOXO              XO
236.0|______________X_____XO_O_O____X_________XO_______________________________
     |              X X   X    O    XOX     X XO
     |              X X   X    O    XOXO  X XOXO
     |              X X X X    O    XOXO  XOXOXO
     |              X X X X    O    XOXO  XOXOXO
216.0|______________XO__X______O____XOXO__XOXO_OX______________________________
     |            X X   X      O    XOXO  XOX  OXO
     |            XOX  O       O    XOXOX XOX  OXO
     |          X XOX          O    XOXOXOXO   OXO
     |          XOXO     O     O    XOXOXOX    O O
196.0|__________XOX____________O____XO_O_OX______O_____________________________
     |          XOX            O    X    O       O
     |          XOX            OX   X            O
     |          XO             OXOX X            O
     |          X              OXOXOX            O
176.0|____X_____X______________O_OXOX____________O_____________________________
     |    XO    X                OXO             O
     |    XO    X                OX              O
     |    XO    X                OX              O
     |    XO    X                O               O
156.0|__X_XOX___X________________________________O_____________________________
     |  XOXOXOX X                                O
     |  XOXOXOXOX                                OX
     |X XOXO OXOX                                OXO
     |XOXOX  OXOX                                OXO
136.0|XOXO___OXO_________________________________OXO___________________________
     |XO     O                                   O O
     |                                             O
     |                                             O
     |                                             O
116.0|_____________________________________________O___________________________
     |                                             O
     |                                             O
     |                                             O
     |                                             O
 96.0|_____________________________________________O___________________________
     |                                             O  X
     |                                             OX X
     |                                             OXOX
     |                                             OXOX
 76.0|_____________________________________________OXOX________________________
     |                                             OXOX
     |                                             OXOX
     |                                             OXOX
     |                                             O O
 56.0|----|----|----|----|----|----|----|----|----|----|----|----|----|----|---
         11       111          111          111
      7991114456790222222225677022112567899901212233344
      1010211211102020000112212101020021100122101211222
      4157202694965666789259866078284718336839389502513
The above chart is giving a conventional buy signal.
Cyclical and Seasonal Factors
Internal Program
Third System Confirmation
Margin
Historic Range
Commitment of Traders

Volatility / Probable Range

Possible Future Prices
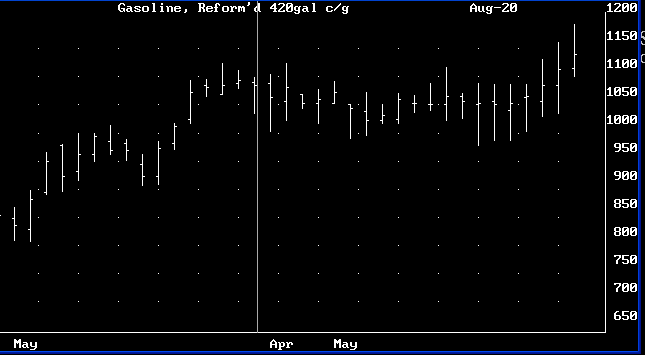
Option Recommendation
Calendar Spread
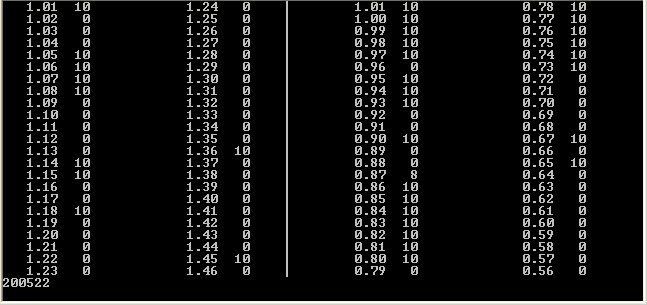
Level Table:
255.0|                                                                  T  5/22
 NYM - Aug-20 Gasoline, Reform'd 420gal c/g  Cm.=0.01  Lim.= 0.5
     |
     |QQ
     |QQQQ
235.0|DPPPQQQQQ________________________________________________________________
     |DDDNNNOPPQQQ
     |CDDDHHMNNNOOOOPPPPQQRR
     |ACCCCCCCCDDDEHHMMMNNNNNNOOOOPQQRRRRRR
     |AACCCCCDDDEEEEHHJJJLLLMMMMMMMNNNNNNOOOOR
215.0|ACCDDDEEEEEHHJJJJJKKLLMMMMNOOORTT________________________________________
     |ABCEEEJJJJJJKKKLLLLLLRRTTTT
     |ABBEEFGGHHJJJJKKKKKKKLRSSTTTTTT
     |AABFFFGGGGGGHHHHHKKKKRSSSSSSSSTTT
     |AAABBBBBBBBFFFFFFFFFGGGGGHHHHKRSSSSSST
195.0|AAABBBBFFFGHHRSSU________________________________________________________
     |AFGHUU
     |GUUUUUU
     |UUUU
     |UUU
175.0|UU_______________________________________________________________________
     |U
     |U
     |
     |
155.0|_________________________________________________________________________
     |U
     |UU
     |UUV
     |UUV
135.0|UUV______________________________________________________________________
     |UV
     |UV
     |V
     |VV
115.0|VV_______________________________________________________________________
     |VVV
     |VVV
     |VZZZ[[
     |VZ[   <<<
 95.0|VZZ______________________________________________________________________
     |VVYZZZZZZ
     |VVVVWYYZZZ
     |VVVVVWWXXXXYY
     |VVVWWWWXXXXXXXXYYYY
 75.0|VVVWWWWWWXXXXYYYYY_______________________________________________________
     |VWWWWWWXXYYYYY
     |VVWWWWWWXXYY
     |VVWWWXX
     |VVWXX
 55.0|VVX______________________________________________________________________
     |
     |
     |
     |
 35.0|-A-B-C-D-E-F-G-H-J-K-L-M-N-O-P-Q-R-S-T-U-V-W-X-Y-Z----|----|-- TPO=-0.075
                         1 1 1 1 1 1 1
       5 6 6 7 7 8 8 9 9 0 0 0 1 1 2 2 1 1 2 2 3 3 4 4 5 5           5
       2 1 2 0 2 0 2 0 1 0 1 3 1 2 1 2 1 2 1 2 1 2 0 2 0 2           2
       8 0 4 9 3 6 0 4 8 2 6 0 3 7 2 7 3 8 1 6 1 5 8 3 7 1           2
Other Factors
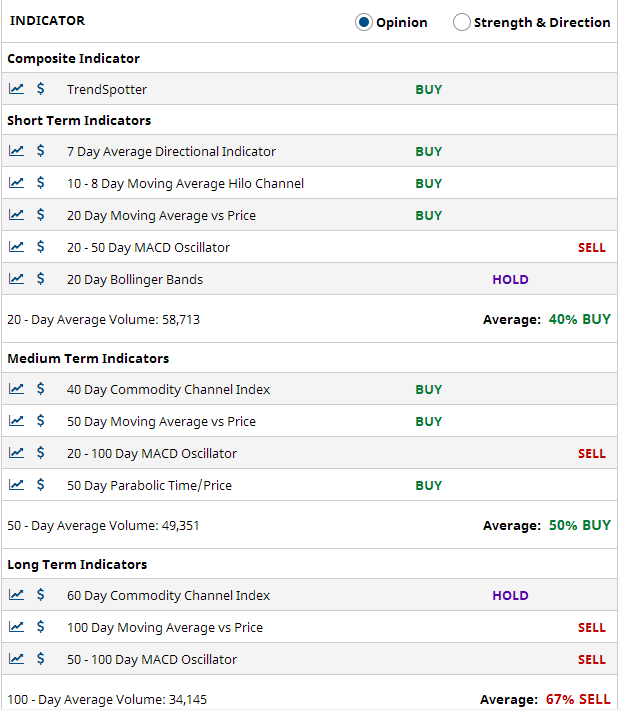
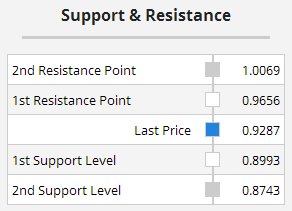
                 Risk Versus Opportunity Report
                ________________________________

                    RBQ0    August Gasoline

                      High Price:  1.4105
                   Current Price:  .944
                       Low Price:  .7341

                            Risk:  0.391
                     Opportunity:  0.870

                    (O/R) Ratio =  2.222