![]()
Introduction Nirvana Internal Progrm
We fed Orange Juice, Coffee, and Sugar into a neural network to get the following result:
September Orange Juice:
07-18-2020: September Orange Juice: Boosts Immunity Systems Causing Demand Spike
(Click on links below. Whole page needs to load before links work.)
Intermarket
Parabolic
News
Point & Figure
Cyclic/Seasonal
Third System
Margin


Introduction
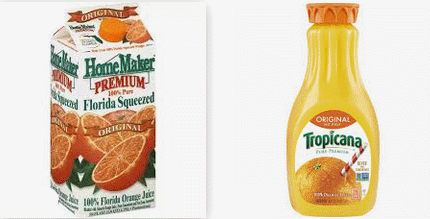
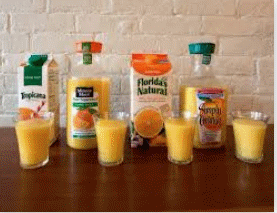
A shortage of oranges from greening disease in Florida has in the recent past been insufficient to drive prices higher because of a large incoming supply from Brazil. Pepsico and Coca Cola get their oranges from Brazil. The reason has been a decline in demand for orange juice, with the belief it contains too many calorie-laden fructose sugars. However, an unanticipated huge increase in demand has apparently been linked to the belief that orange juice strengthens the immunity system against the virus. How long this source of demand will last is questionable, and for that reason investors are hesitant... our indicators are narrowly balanced looking for prices to go either direction. We think the current reason for the demand is sustainable for at least the foreseeable future, and beside, there is bad weather for oranges in Brazil.
Intermarket Analysis


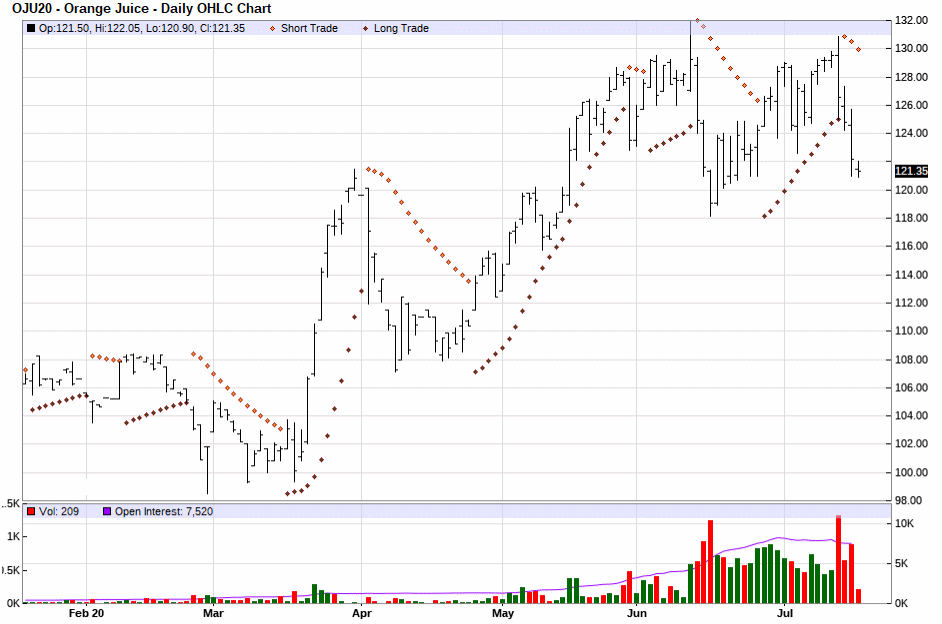
Parabolic Chart
September Orange Juice:
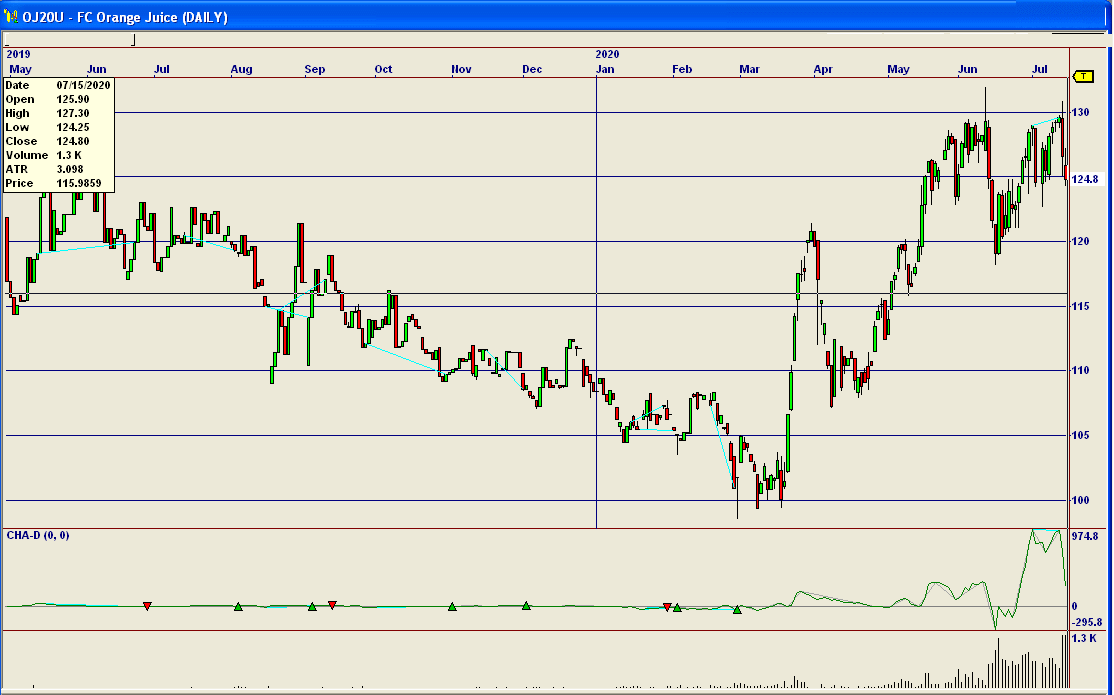
Nirvana Chart
Apparently, Americans have concluded that orange juice boosts their immunity systems against the pandemic. U.S. retail sales have gone up at least 30% from a yhear ago. Grapefruit produced in Florida has also seen sales climb to around 50% higher in the same period.
At the same time there is a shortage of orange juice products from a longstanding disease impact on Florida groves, with the shorttfall for Tropicana amounting to 22%, which will cause Tropicana to raise its wholesale prices by an average of 10% and impact retail prices by around 30 ro 40 cents per gallon.
According to the British Broadcasting system (BBC) producers have been hit by a struggle to export goods due to export restrictions. This has caused global orange juice prices to soar. One analyst commented that soft commodities like oranges and wheat are vulnerable to sudden price increases due to natural disasters.
Scarcity is considered the "number one culprit" to drive orange juice prices up. Demand has risen by supply has fallen for reasons mentioned above.
The Florida Dept. of Citrus reported a spike in demand for 100% orange juice in particular, both unforseen and significant. Orange juice is included with a number of different staples that consumers are stocking up on (hoarding) as people see it as a hydrate and source of Vitamin C. Increase in retail sales have offset other loss of business from food service and restaurant groups.
Pepsico (Tropicana) and Coca-Cola (Minute Maid) have both been reluctant to share recent sales figures, although previously they had fallen from 6 .1 gallons in 1998 to 2.5 gallons per person in 2018 for consumption on average for both.
Citrus greening has caused widespread shortages in orange juice supplies. That ailment wreaked havoc on the orange industry. Orange juice received bad publicity as a source of empty calories and sugar, and was neglected by consumers as a breakfast drink as they ate "breakfast on the go."
The soaring of orange juice sales has been widely anticipated since March and the start of recognition of the seriouness of the pandemic.
Brands like Simply and Tropicana come from Brazil, not Florida. Prior to 1993 almost all orange juice on grocery shelves came from the U.S. and mainly Florida. Florida now accounts for only about 10% of world orange juice production. Brazil's huge land mass gives them an advantage over smaller Florida. Land in Florida is much more valuable for condos than orange groves. In ten years, Florida's orange grove land decreased by 40%. It is unlikely Florida will ever regain its former prominence in the orange juice industry. Trade wars have put U.S. orange juice on the banned liste for imports to many countries.
It remains to be seen if recent sales represent a long-term reversal after 20 years of declining consumption. The sugar content of orange juice has been a major concern. The sugar in orange juice is fructose, not the healthiest form of sugar.
There has been some recent bad weather in Brazil, helping to increase prices of orange. This year there are concerns about having enough workers to harvest the produce there. A recent study in Britain concluded that a glass of orange juice daily can help boost belly fat burning. Orange juice contains zero fat and also a small amount of calories making it an excellent fruit if you're looking to shed extra fat, including stubborn bellyi fat whichis the most difficult to lose. Orange juice's high level of vitamin C helps metabolise fat faster. Anything that boosts metabolism can help burn fat throughout the day. Orange juice also helps decrease "sweet tooth" cravings for candy and the like during the day. Freshly-squeezed orange juice is better because it will not contain added sugars found in commercial products.
While Coca-Cola and Pepsico get their oranges from Brazil, Florida Natural Brand orange juice comes only from Florida. It was the victim of a lawsuit and appeal in the Second C ircuit Court regarding the claim it contained trace amounts of the weed-killer glyphosate. The suit was dismissed in court. The court added it was also okay to use the term "natural" in the brand name and that it was not misleading.
The shortage of laborers in Florida has caused much fruit to rot on the fround despite the spike in demand. In some groves half the fruit has been lost to fruit drop.
Our assessment of this news is that yes, demand will return to former declining levels, but only after the pandemic passes, which is not seen on the horizon any time soon, at least not until next year.
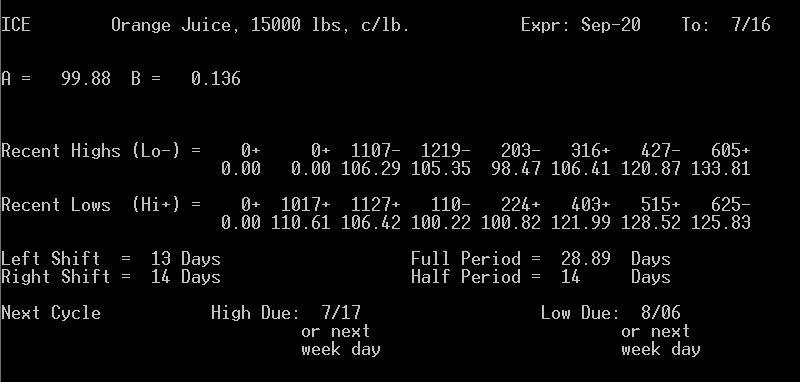
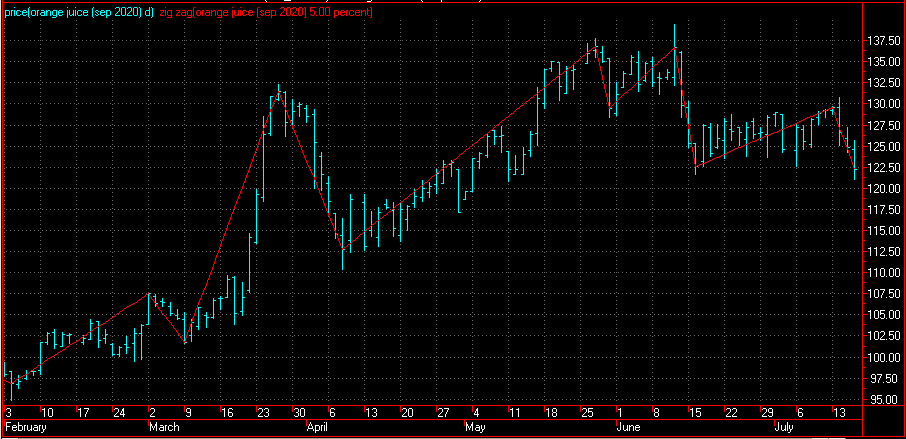
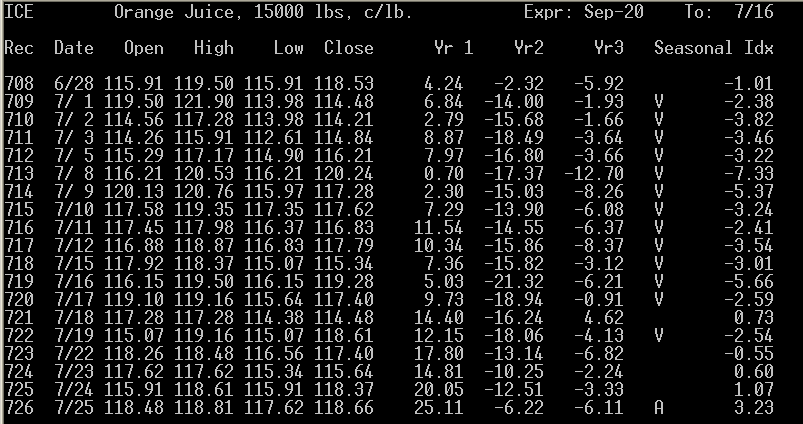
We are headed toward a cyclical low and a seasonal up period.
News Analysis
Point & Figure Chart
274.0|                                                                  R  7/15
     | ICE - Sep-20 Orange Juice, 15000 lbs, c/lb. Cm.=0.20  Lim.=10.0
     |
     |
     |
254.0|_________________________________________________________________________
     |
     |
     |  X X
     |  XOXO
234.0|__XOXO___________________________________________________________________
     |  XO O
     |X X  O
     |XOX  O
     |XOX  OX   X
214.0|XOX__OXO__XO____________X________________________________________________
     |XOX  OXO  XO        X   XOX
     |XOX  O O  XO        XO  XOXO
     |XO     O  XO        XO  XOXO
     |       O  XO        XO  XO O
     |       O  XO        XO  XO O
194.0|_______OX_XOX_____X_XO__X__O_____________________________________________
     |       OXOXOXO    XOXO  X  O
     |       OXOXOXO    XOXOX X  O
     |       O O OXO    XOXOXOX  O
     |           O O    XO OXOX  O
174.0|_____________O____X__OXO___O_____________________________________________
     |             O  X X  OX    O
     |             OX XOX  O     O
     |             OXOXOX        O
     |             OXOXO         OX
154.0|_____________O_O___________OXO___________________________________________
     |                           OXO
     |                           O O
     |                             O
     |                             O
134.0|_____________________________O____X______________________________________
     |                             OX   XO
     |                             OXOX XO
     |                             OXOXOXO
     |                             OXOXOX
114.0|_____________________________OXOXO_______________________________________
     |                             O OX
     |                               OX
     |                               OX
     |                               O
 94.0|----|----|----|----|----|----|----|----|----|----|----|----|----|----|---
       11111              11
      900122111233446788990213467834563456
      002101003202012112020012201120112011
      834412460767776452553680686414590756
Our computer tells us a non-conventional reactive approach works best for orange juice on p&f charts. Therefore the above chart is taken as giving a sell signal.
Cyclical and Seasonal Factors
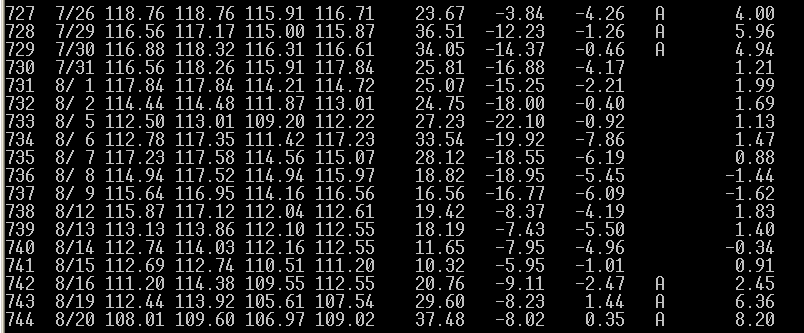
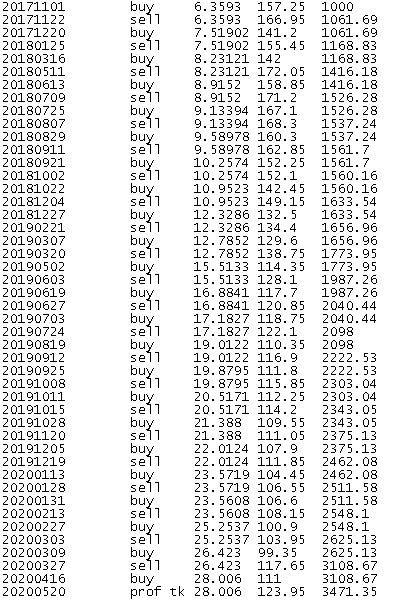
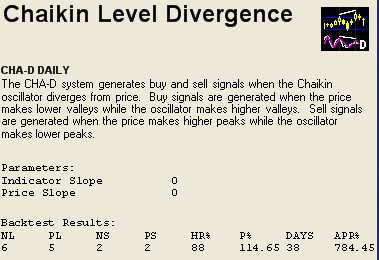
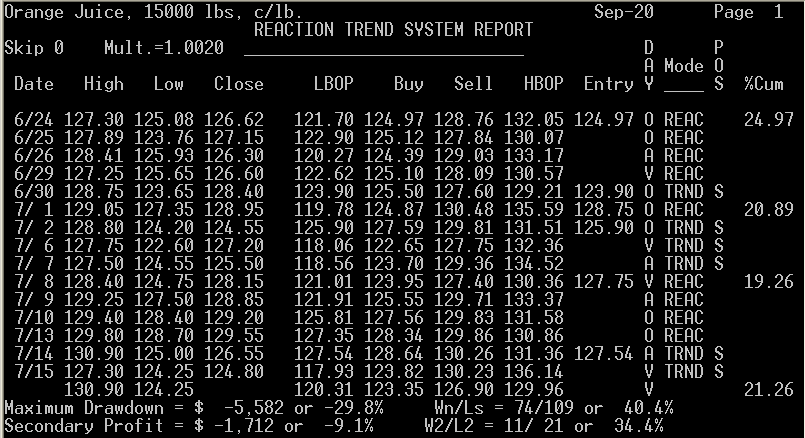
Our best-performing internal program is "WilderRT". It is giving a sell signal.
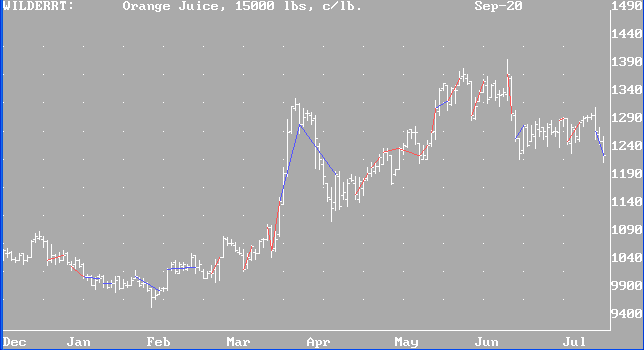
Results of "WilderRT" for Orange Juice (blue lines = successful trades, red, unsuccessful):
(Always in the market.)
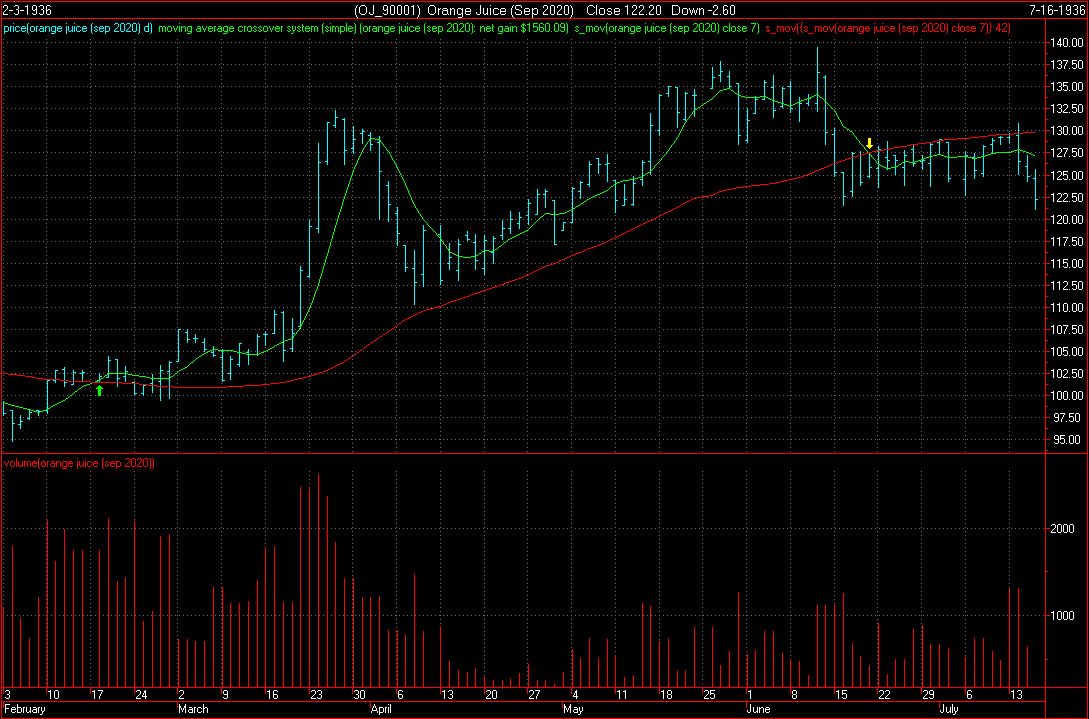
Our third system has triggered a sell signal. (Note, disregard the year on the chart. Our regular readers know this is not a Y2K-compliant system, but it still works.)
The point value is $150. Initial margin on a single contract is $1,386. Use of options is not advised.
Scale traders are not a factor in this price range.
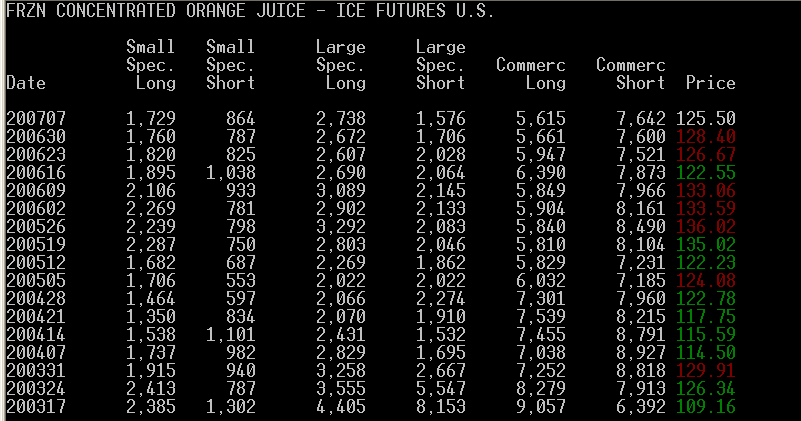
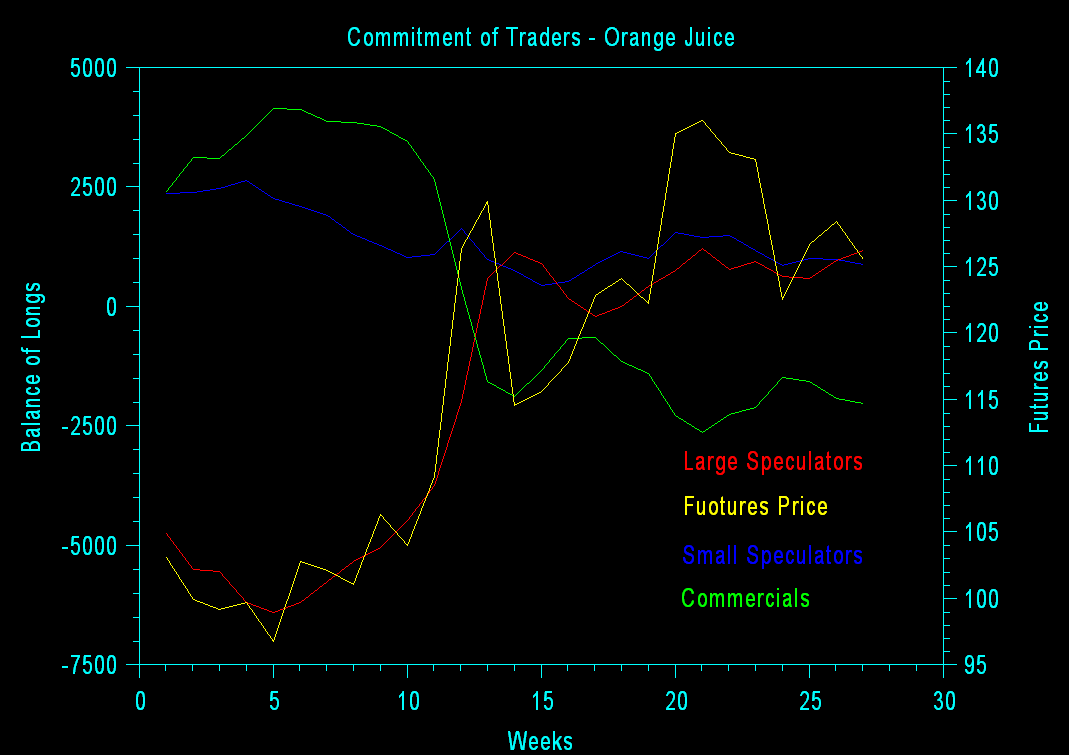
In the chart below, the yellow line is the futures price, read on the right axis. All other colors are read on the left axis. Blue is small speculators. Red is large speculators. Green is commercials. Large speculators with the best track record are getting increasingly-long.
Interpretation of a Different Site Below (Their trader categories may vary from ours):
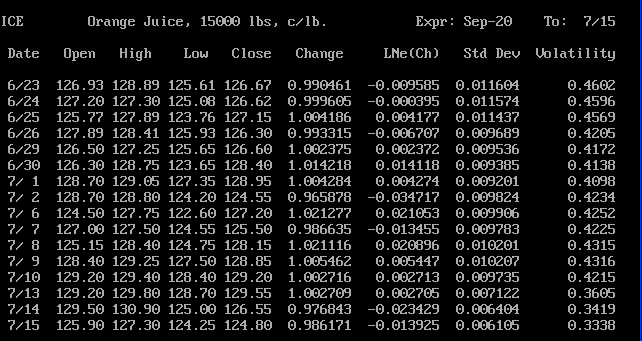
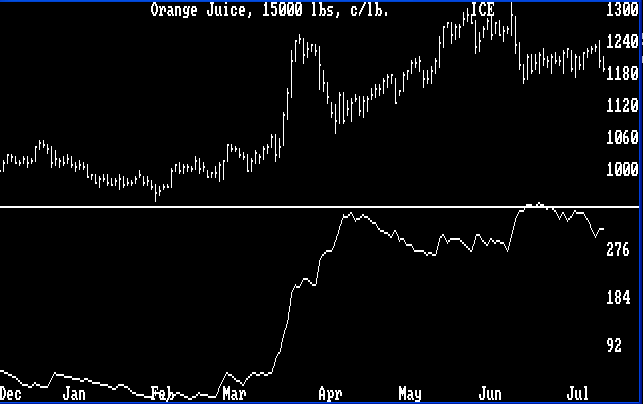
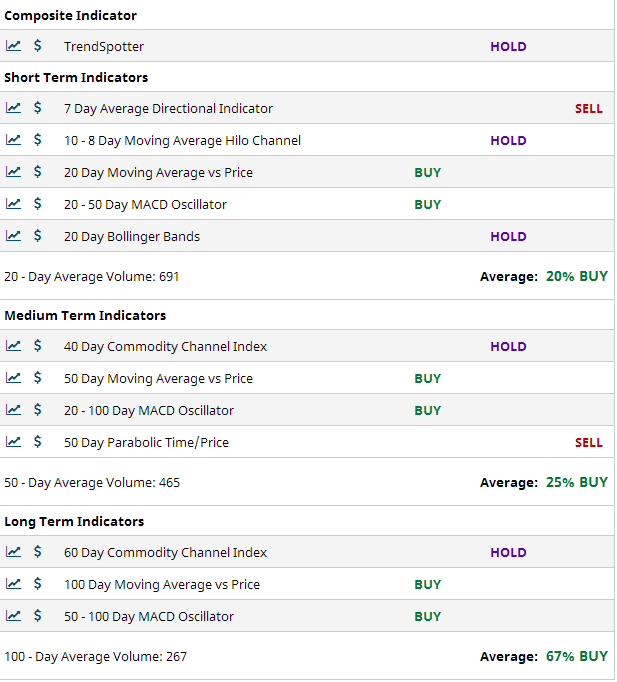
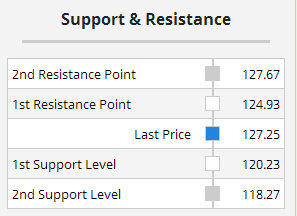
The average volatility shown below suggests that an uptrend remains intact from the last volatility low point.
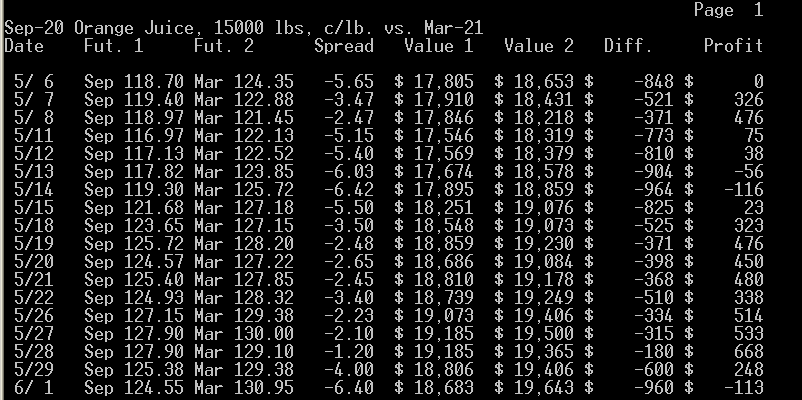
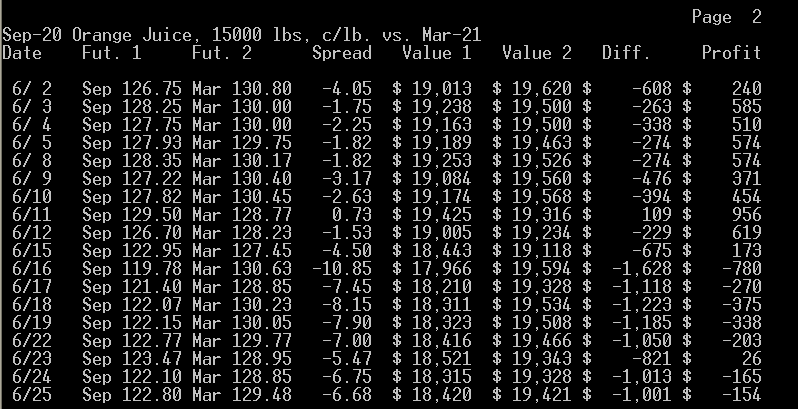
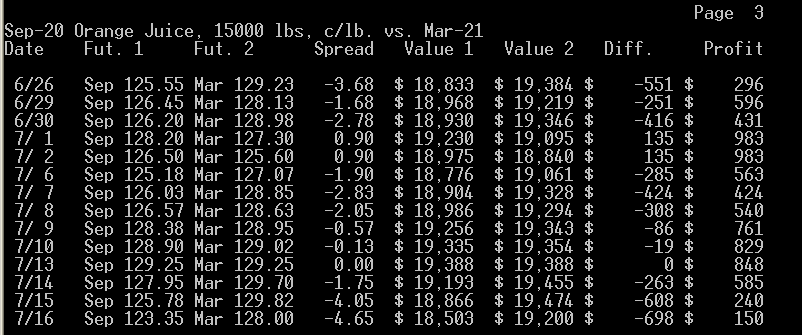
What the Sep. - Mar. calendar spread suggests to us is that buying the near contract and selling the far one is at most times not profitable, which we think is a sign that these futures may go down in the long run. This disagrees with our ultimate conclusion. The best time to enter or leave the above spread is when it is at -3.50 or narrower buying the far as prices are rising and then selling the near, and exiting or entering when it is at -7.00 or wider selling the far as prices are falling and then buying the near. At this time, we appear to be headed toward the sell the far, buy tne hear point.
To view the chart below correctly use Microsoft Internet Explorer.
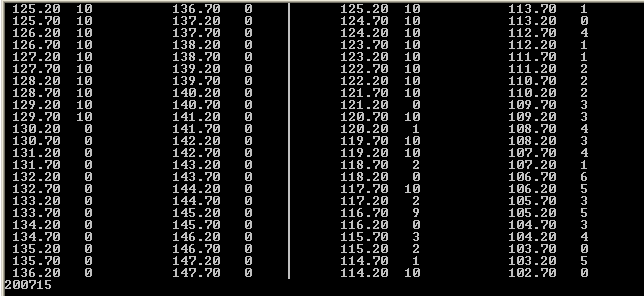
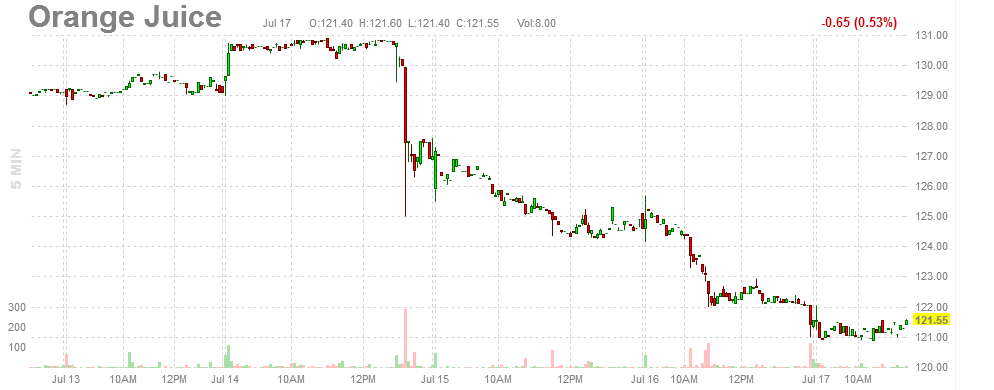
Here's an intraday chart for a previous day ( 7/15 ).
Internal Program
Third System Confirmation
Margin
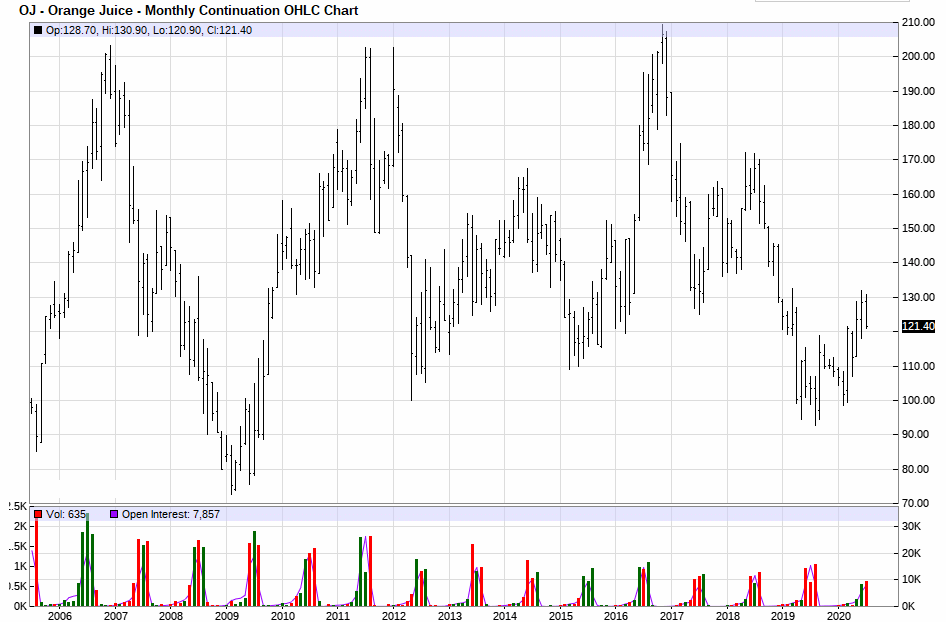
Historic Range
Commitment of Traders

Volatility / Probable Range

Possible Future Prices
Calendar Spread
Level Table:
143.0|                                                                  R  7/15
 ICE - Sep-20 Orange Juice, 15000 lbs, c/lb. Cm.=0.20  Lim.=10.0
     |
     |
     |
138.0|X________________________________________________________________________
     |X
     |WWX
     |WWWXXX
     |WWWWXXXXXX
133.0|WWWWWWXXXXXXX____________________________________________________________
     |WWWWWXXXXXXXX
     |SWWWWWWXXXXX
     |SSWWWWXX
     |SSSSWWWXXY[
128.0|SSSSSTWWXXYZZZZ[_________________________________________________________
     |SSSSSTWYYYYZZZZZ[
     |SSSTVWYYYYYYYYYZZZZZZ[[
     |STVVVVWYYYYYYYYYZZZZZZ[[
     |STVVVYYYYYYYZZZZZ[[
123.0|STTVVVVVYYYYYZZ   <<<
     |STTUUVVVVVYYZ
     |STTUUUUVVVVY
     |DSTTTUUUVV
     |DDSTTTUUUUV
118.0|AADDSSTTTUUUUV___________________________________________________________
     |AAAAAABBDDSTTTTUUUUU
     |AAAAAAAABBBBBBBDDSTTTTTTUUU
     |AAAAAAABBBBBBBDDESTTTTTTUUU
     |AABBBBBBDDDDEEFSTTTTTTUUU
113.0|BBBCCDDDDDDEEEFSSTTTTTU__________________________________________________
     |BBBBCCCCCDDDDDDDEEEFFSTTTT
     |BBBCCCCCCDDDDEFFST
     |BCCCCCCCDDEEEEFGGGST
     |BCCCCCCDDEEEEEFFFFFFFGGGGGGGS
108.0|CCCCCDDEEEFFFFFFGGGGHHRRS________________________________________________
     |CCDFFFFGGGGGGHHHJMMRRSS
     |CCFFGGGHHHHHJJJJJJMMQQQRRRS
     |CFHHHHJJJJJJJKKKKKLMMMQQQRRRRS
     |HHHHJJJJJJKKKKLLLMMMQRRRRRRRS
103.0|HHHJJKKLLLLLLLMMMMMMPQQRRRRR_____________________________________________
     |HHKKKKLLLMMMMMMNNPPQQQQRR
     |KKLLMNNPPPPPPQQQQQRR
     |NOPPQQQQQQ
     |NNNNNOOOOOOPQQQ
 98.0|NNNNNOOOOOOOOP___________________________________________________________
     |OOOPPP
     |OP
     |O
     |O
 93.0|_________________________________________________________________________
     |
     |
     |
     |
 88.0|-A-B-C-D-E-F-G-H-J-K-L-M-N-O-P-Q-R-S-T-U-V-W-X-Y-Z----|----|-- TPO= 0.500
                   1 1 1 1 1 1
       7 7 8 8 9 9 0 0 1 1 2 2 1 1 2 2 3 3 4 4 5 5 6 6 6 7           7
       1 3 1 2 1 2 1 2 0 2 0 2 0 2 0 2 0 1 0 1 0 1 0 1 2 1           1
       7 0 3 7 1 5 0 4 7 1 6 0 7 2 5 0 5 9 2 7 1 5 1 5 9 4           5
Other Factors
                 Risk Versus Opportunity Report
                ________________________________

                 OJU0    September Orange Juice

                      High Price:  137.9
                   Current Price:  124.8
                       Low Price:  118.4

                            Risk:  0.100
                     Opportunity:  0.204

                    (O/R) Ratio =  2.047