![]()
Introduction Nirvana Internal Progrm Historic Range
We fed the Japanese Yen, Swiss Franc, and British Pound into a neural network to get the following result:
June Japanese Yen:
03-14-2020: June Japanese Yen: Inadequate U.S. Virus Response Drives Investors to Safer Havens
(Click on links below. Whole page needs to load before links work.)
Intermarket
Parabolic
News
Point & Figure
Cyclic/Seasonal
Third System
Margin
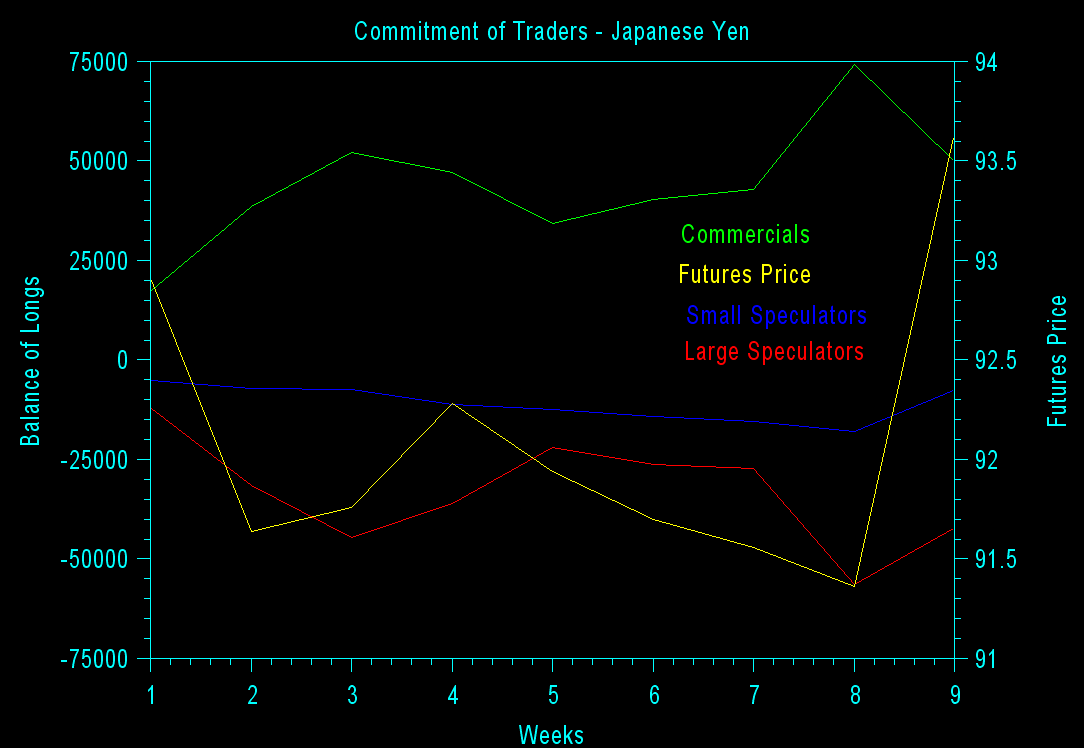
Commitment
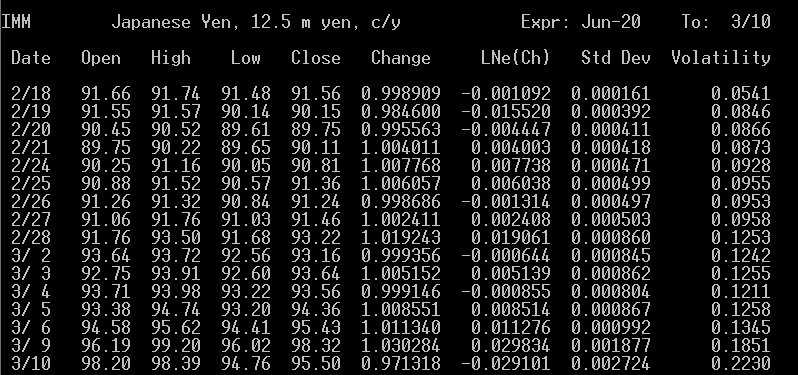
Volatility



Introduction
 We are seeing everywhere in recent markets "flights to safety." The Japanese Yen is considered one of the safer investments because of the structuring of the resilient Japanese economy, and
the increased risk in the rest of the world due to the coronavirus and its effects on trade. The response of the U.S. has been heavily criticized as inadequate due to poor leadership. Japan is considered to have better leadership. Moreover, we are seeing in the bond market, increasing prices of bonds which normally hate good news, stressing the lack of leadership in America.
Intermarket Analysis


Parabolic Chart
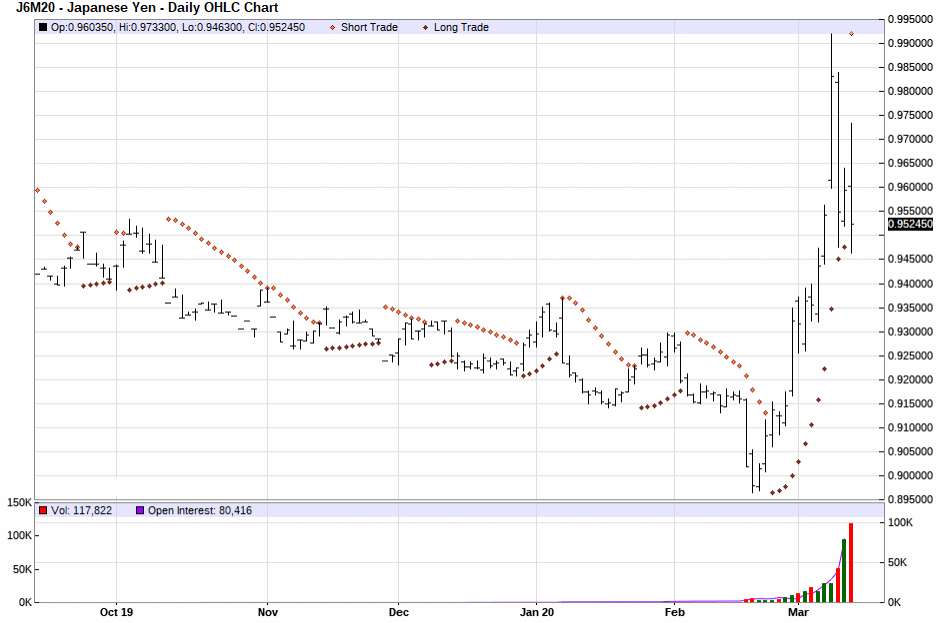
June Japanese Yen:
Nirvana Chart
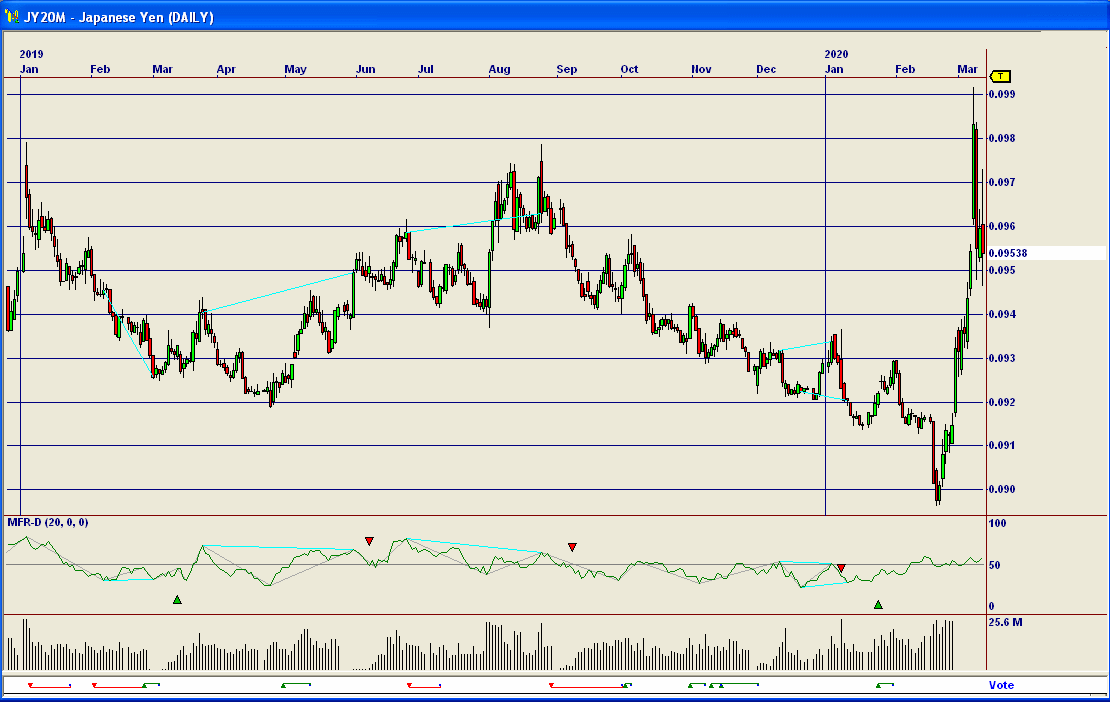

The U.S. Dollar recently filled a gap in the exchange rates when it was losing against the Japanese Yen. The Bank of Japan has a history of intervening close to the Yen-100 level, so it is likely that
level will be paid close attention by the market. Moves are being affected by latest headlines involving the coronavirus, what the U.S. Government is going to do about it, and central bank intervention around the world.
The Dollar is being buoyed by fiscal stimulus hopes. The Dollar's rally coincided with a rebound in the U.S. stock market and a bounce in Treasury yields across the board. The crisis caused
by the coronavirus is pushing central banks to spend money, which is good for the Dollar market. Stimulus, rather than a cut in interest rates or quantitative easing is what the world wanted.
The energy price war between Saudi Arabia and Russia triggered a big rout in oil prices causing Treasury yields to drop further. Data suggests the Swiss National Bank os already intervening
to weaken its currency. Japan is anticipated to do likewise.
Panic continues to fuel demand for safety as the Yen has appreciated. Governments' and central banks' measures are seen as too little too late. Things escalate exponentially, triggering an endless riun for safety, where the Yen is believed to provide freater safety. Bank of Japan Kuroda met with Prime Minister Abe and siad the central bank is ready to take the necessary
steps to support the economy through asset buying and by providing ample liquidity. Japan's February Producer Price Index contracted to 0.9% YoY in February from 1.5% in January. Data
anticipated to be released from the U.S. may reflect ongoing fears of a recession.
A recent speech by President Trump failed to strengthen U.S. markets, and USD/JPY is feeling the pull of gravity, tracking losses in U.S. stock futures. Trump's speech fell short of expectations and has bolstered risk aversion. During his speech Trump said he will instruct the Treasury to defer some tax payments and called on Congress to offer immeidate payroll tax relief. Trump also
promised $200 billion in aidditional liquidity to fight against the coronavrisu. Investors however were expecting stronger stimulus and sold risk following Trump's speech. The worsening of risk
aversion has so far boded well for the Yen. Increasing prospects of an all-out price war between Russia and OPEC members will likely add to the risk-off tone.
Toyota expects a stronger Yen to knock 350 billion Yen from its operating profit in the current financial yiear, roughly double its previous forecast and a big increase from last year's 50 billion Yen impact. Toyota now expects the YIen to average 108 (exchange rate with U.S.) this year from its previous forecast of 110.
Negative interest rates, like the Bank of Japan curretnly has, would currently discourage capital inflows. However, the debt structuring of Japan means that the current is considered very safe and stable for uncertain times. The Yen is still considered a "haven" despite Japan's currently sluggish economy. But ample liquidity allows the Yen to defend its safe haven status. Japan's current
account balance in trade deficits is a surplus, and the situation is unlikely to change despite trade wars. Japan's asset managers invest all around the world, where yields tend to be higher than the environment the Bank of Japan has created, leaving the Yen subject to massive repatriation in times of trouble. As long as the oiutlook for growth is bleak, the market will favor the Yesn for its carry, said a strategist at TD Securities.
Prime Minister Abe does not want a stronger Yen and prefers it to be stable. Japanese price inflation is stubbornliy low. It was just 1.1% year over year last year. This is way off the BOJ's target of 2%. Some believe a new Japanese Crown Price who will take the throne this Spring after his father abdicates at the end of April could be a catalyst for improved consumer and maeket sentiment.
The 2020 Olympics could do the same.
Japan unveiled a 430.8 billion Yen package focusing on financing for small firms. This was to cope with the fallout of the coronavirus oiutbreak, focusing on support to small and middle-sized firms, as concerns mount about risks to the fragile economy. This follows a similar package offered earlier. To help fund the package the government will tap the rest of this year's fiscal reserve budget of about 270 billion Yen according to Prime Minister Abe. The new package will fund improvements to medical facilities and provide subsidies to working parents who must take leave because of closed schools. Japan will boost to 1.6 trillion Yen its special financing for firms hit by the virus, up from about 500 billion Yen previously announced, Abe said.
As we read the news, the strength of the Yen exchange rate between itself and the U.S. Dollar seems to hinge largely upon disappointment with the Trump Administration's response to the coronavirus outbreak, which appears to lag that of other nations around the world due to earlier roadblocks, like Trump's bygone speech about hwo the pandemic was a "hoax" perpetrated by the Democrats, allowing the U.S. Government to do nothing and lose valuable time. Now, the uncertainty of just how large and where the virus spread is in the U.S. due to the lack of testing sources could allow undetected virus sources to rise exponentially. Currently, many hospitals take a swab from the mouth for testing purposes, then are forced to send it off to a lab for analysis for protein content and other clues as to virus presence, which could take as long as two weeks to get back results. In that time, who knows what could happen?
We are headed toward a cyclical low and a weak seasonal down period.
News Analysis
Point & Figure Chart
1115.5|                                                                  T  3/10
     | IMM - Jun-20 Japanese Yen, 12.5 m yen, c/y  Cm.=0.03  Lim.= 0.3
     |
     |
     |
109.0|___X_____________________________________________________________________
     |   X
     |   X X   X
     |   X XO  XO  X
     |   X XO  XO  XO
106.5|___XOXO__XOX_XO__________________________________________________________
     |   XOXO  XOXOXO  X
     |   XO O  XOXOXO  XO
     |   X  O  XOXO O  XO
     |   X  O  XOX  OX XO
104.0|_X_X__O__XO___OXOXO______________________________________________________
     | XOX  OX X    OXOXO
     | XOX  OXOX    OXO O
     |OXOX  OXOX    O   O
     |OXO   OXO         O
101.5|OX____O___________O______________________________________________________
     |OX                O                  X
     |OX                O                  XO
     |OX                O                  XO
     |OX                O                X XO
 99.0|OX________________O________________XOXO__________________________________
     |OX                O        X   X   XOXO            X
     |O                 O        XO  XO  XO O            XO
     |                  O        XOX XO  X  O            XO
     |                  O        XOXOXO  X  OX     X   X XO
 96.5|__________________O________XOXOXO__X__OXO____XO__XOXO____________________
     |                  O        XOXOXO  X  OXO    XO  XOXO
     |                  O    X X XOXOXO  X  O O    XOX XOXO
     |                  OX X XOXOXOXOXOX X    OX   XOXOXOXO
     |                  OXOXOXOXOXOXOXOXOX    OXO  XOXOXOX
 94.0|__________________OXOXOXO_OXO_OXOXOX____OXO__XOXO_OX_____________________
     |                  OXO O   O   O OXO     O OX XOX  OX
     |                  OX            O         OXOXOX  OX
     |                  OX                      OXOXOX  OX
     |                  OX                      O O O   OX
 91.5|__________________OX______________________________OX_____________________
     |                  O                               OX
     |                                                  OX
     |                                                  O
     |
 89.0|----|----|----|----|----|----|----|----|----|----|----|----|----|----|---
                    11111              11        111
      56666777778999011111111122334567912123356890121578923
      00222012222012000000122312022111120120221112020030021
      32347616796641428995947144205798228612893386708912580
The above chart is giving a conventional buy signal.
Cyclical and Seasonal Factors
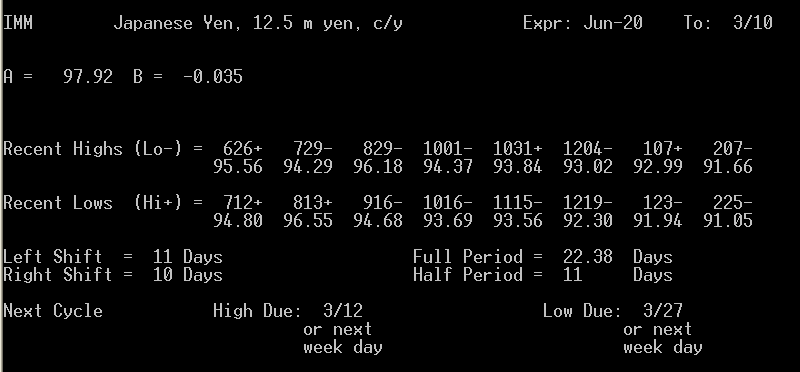
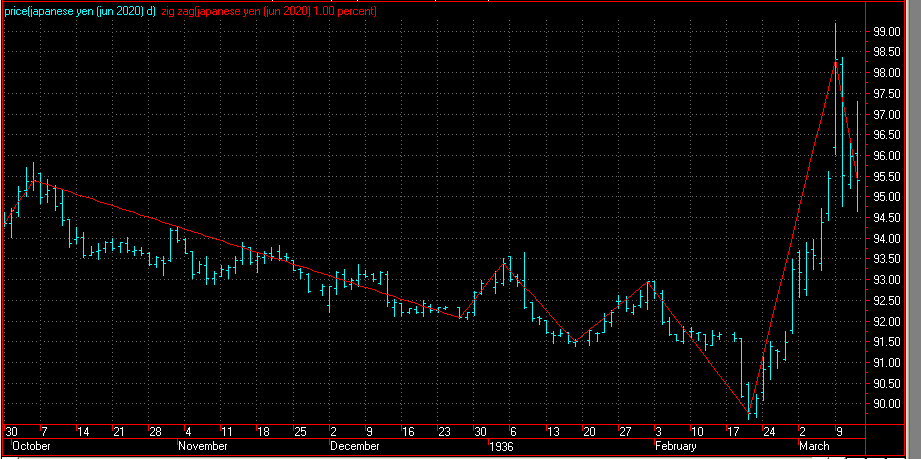
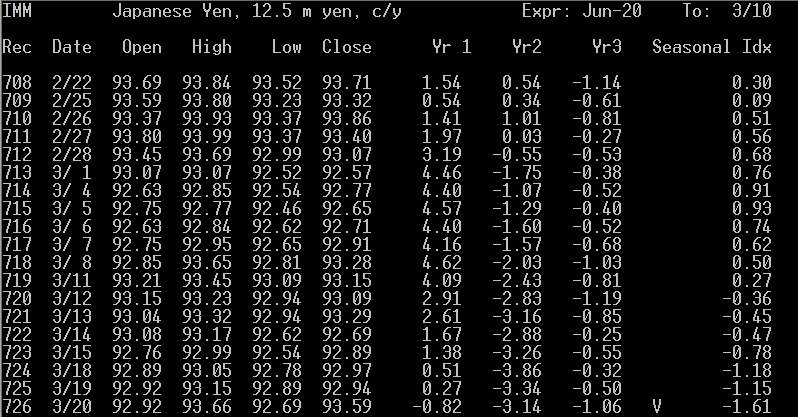
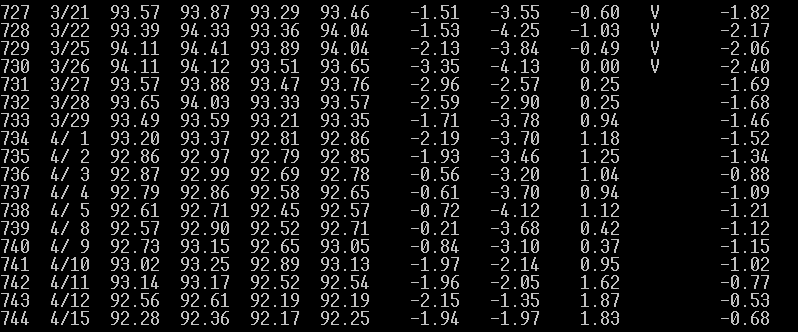
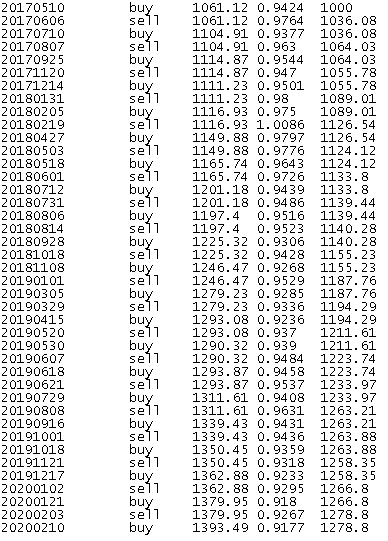
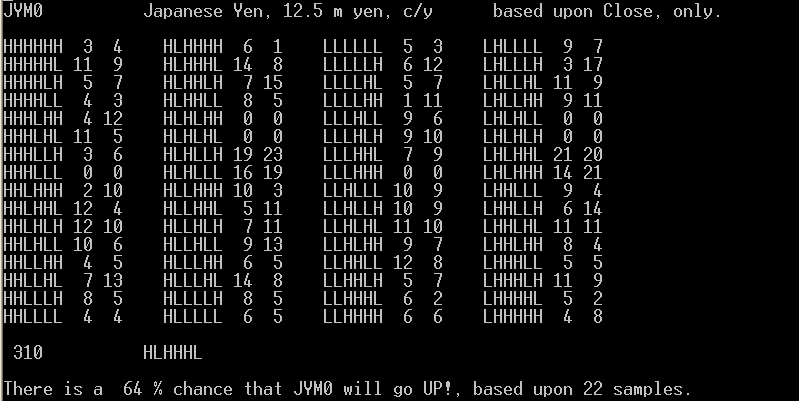
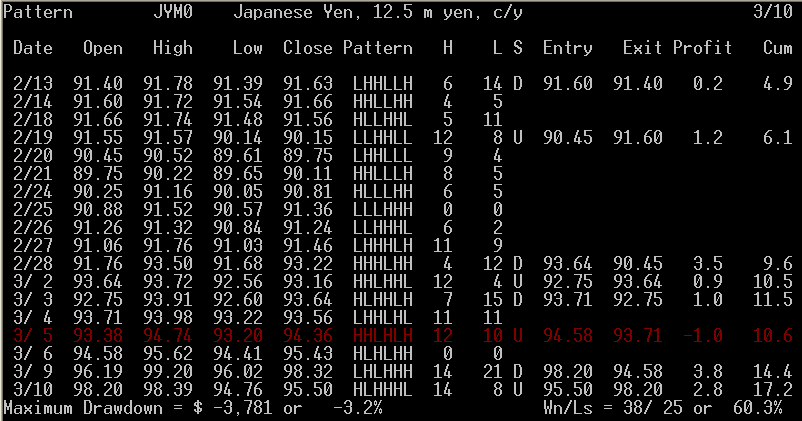
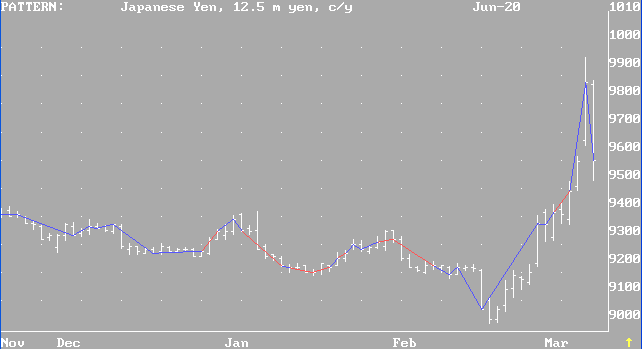
Our best-performing internal program is "Pattern". It is giving a buy signal.
Results of "Pattern" for Japanese Yen (blue lines = successful trades, red, unsuccessful):
(Always in the market.)
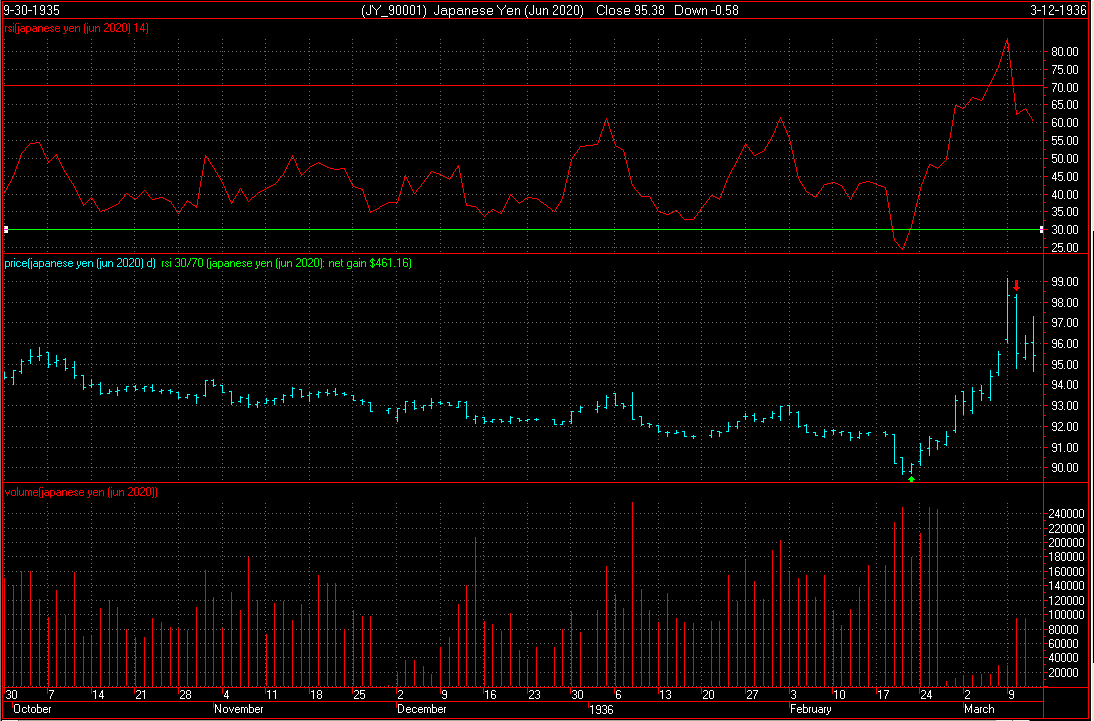
Our third system has triggered a sell signal. (Note, disregard the year on the chart. Our regular readers know this is not a Y2K-compliant system, but it still works.)
The point value is $1,250. Initial margin on a single contract is $2,640. Use of options is advised.
Scale trade buyers are marginally entering the market for the long term in this price range.
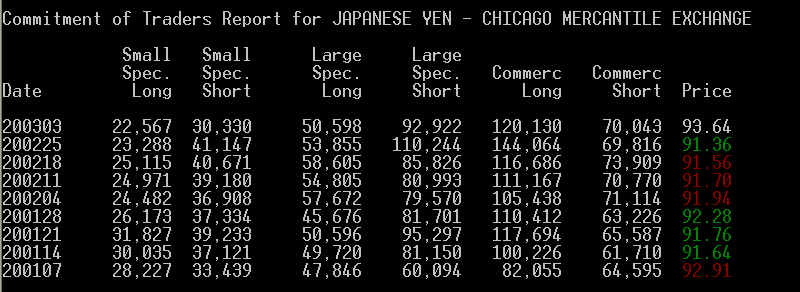
In the chart below, the yellow line is the futures price, read on the right axis. All other colors are read on the left axis. Blue is small speculators. Red is large speculators. Green is commercials. Large speculators with the best track record are getting increasingly-long.
Interpretation of a Different Site Below (Their trader categories may vary from ours):
The average volatility shown below suggests that an uptrend remains intact from the last volatility low point.
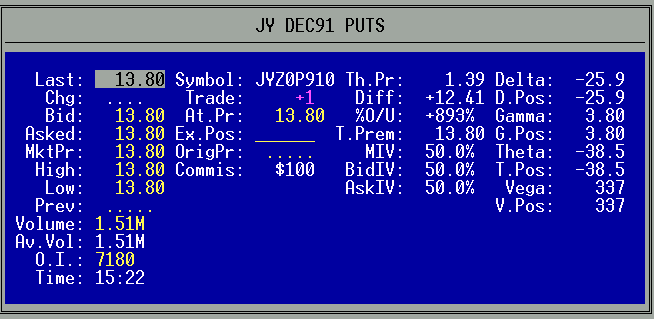
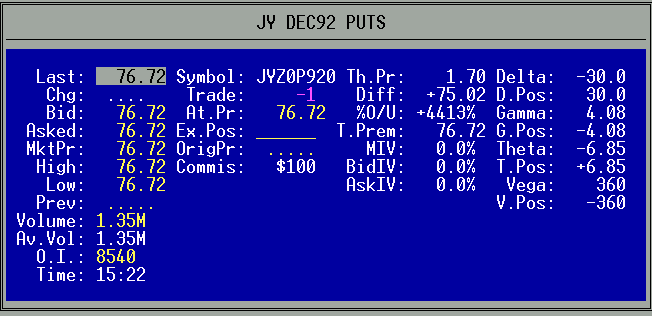
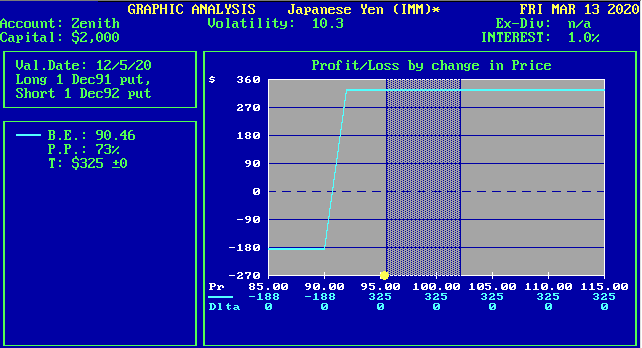
Our option trade recommendation is to Buy (1) Japanese Yen December 91 Put and Sell (1) Japanese Yen December 92 Put @.0 6296 to the sell side or grater.
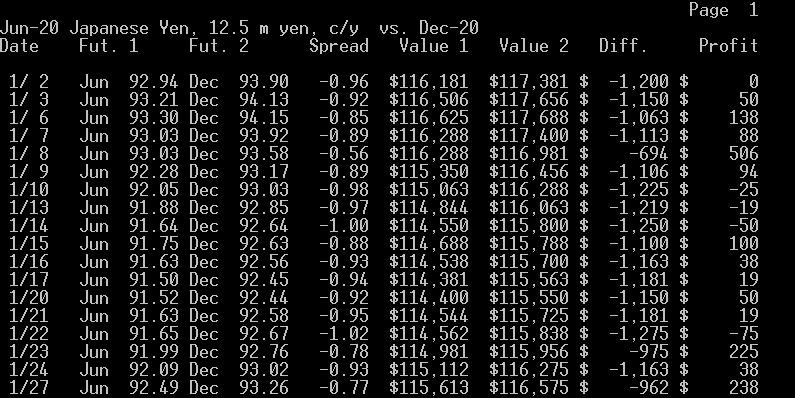
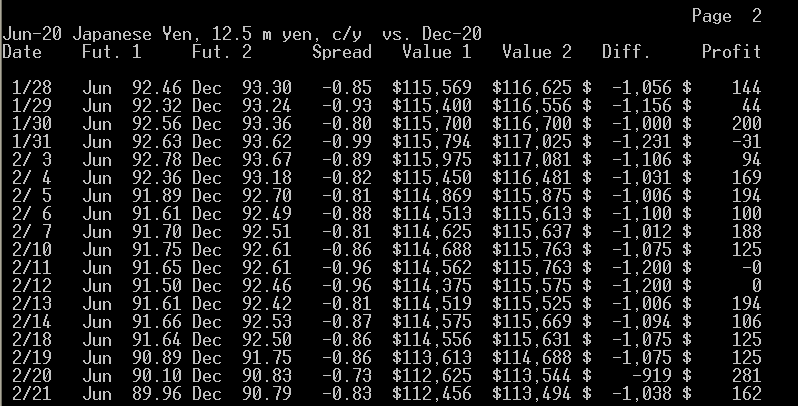
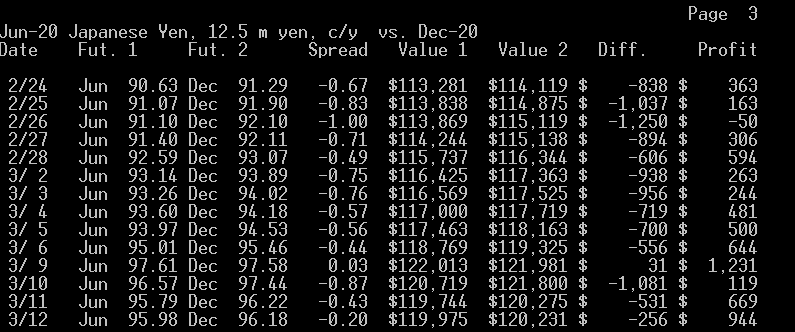
What the Jun. - Dec. calendar spread suggests to us is that buying the near contract and selling the far one is at most times profitable, which we think is a sign that these futures may go up in the long run. The best time to enter or leave the above spread is when it is at -.20 or narrower buying the far as prices are rising and then selling the near, and exiting or entering when it is at -0.96 or wider selling the far as prices are falling and then buying the near. At this time, we appear to be at the buy the far, sell the near point.
To view the chart below correctly use Microsoft Internet Explorer.
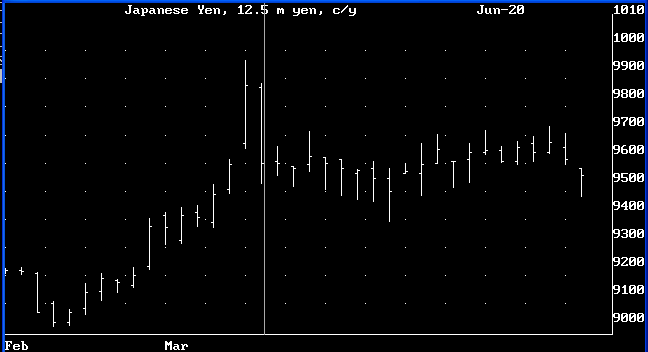
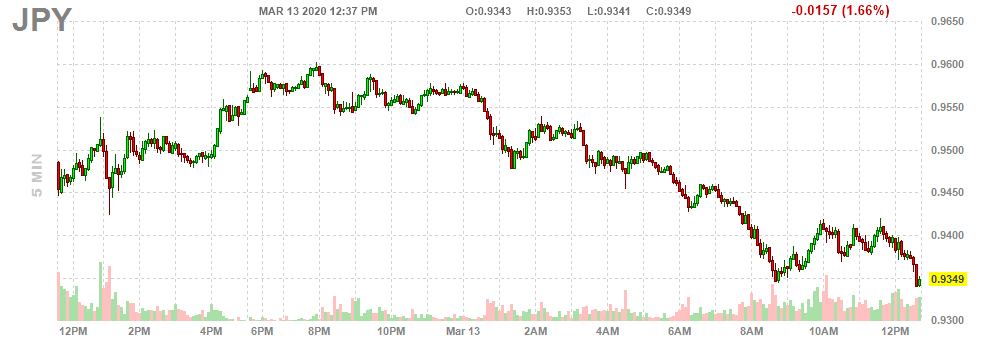
Here's an intraday chart for a previous day ( 3/13 ).
Internal Program
Third System Confirmation
Margin
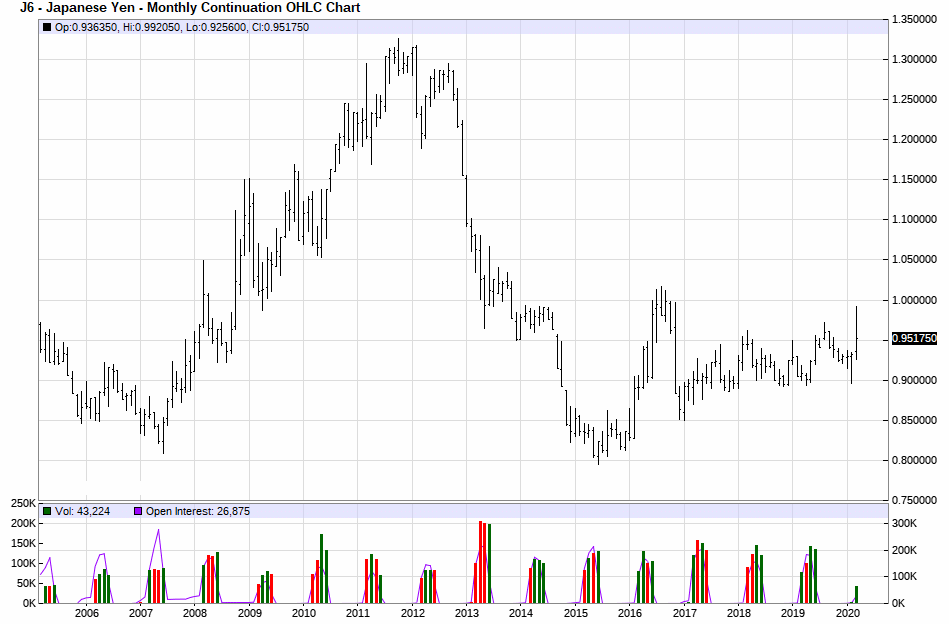
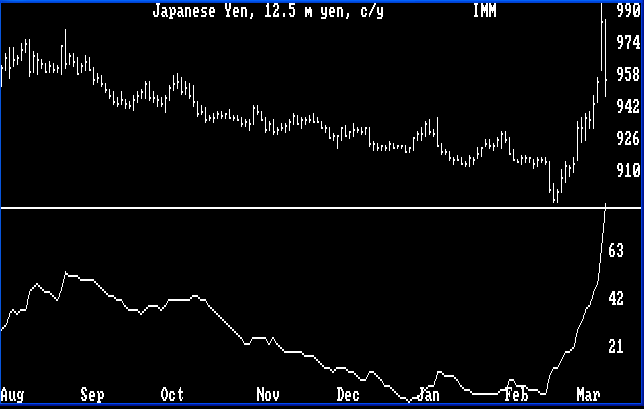
Historic Range
Commitment of Traders

Volatility / Probable Range

Possible Future Prices
Option Recommendation
Calendar Spread
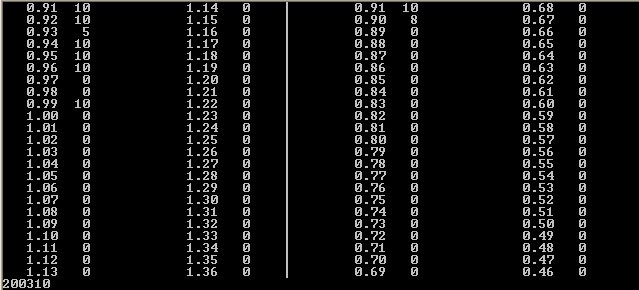
Level Table:
 99.0|                                                                  T  3/10
 IMM - Jun-20 Japanese Yen, 12.5 m yen, c/y  Cm.=0.03  Lim.= 0.3
     |[
     |[
     |[
 98.0|[[_______________________________________________________________________
     |[[
     |M[[
     |M[[
     |LLM[[
 97.0|LLLM[[___________________________________________________________________
     |LLLLLMM[[
     |LLLLLLMMM[[
     |LLLLLLLLMMMMN[[
     |LLLLLLLMMMMMMNN[[
 96.0|LLLLLLMMMMMMMMNNN[[______________________________________________________
     |HLLLLLLMMMMMMNNN[
     |HHHHLLLMNNP[
     |HHHHJKLNNNPPZ[
     |FFFHHHHHJKKLNNNOPPPPZ[   <<<
 95.0|FFFGGGHHHHHJJKKNOOPPPPPPZ[_______________________________________________
     |FFFFGGGGGGGHHJJJJJJJKKKKNNOOOPPPPPPZ[
     |FGGGGGGGGGHHJJJJJKKKKNNOOOOOOPPPZ[
     |FGGGHJJJJJKKNNOOOOOOPPPPZZ
     |AEEEEFJJJKKKKKNNOOOOOPPPPZ
 94.0|AAEEEEFFFFJJKKKKKOOOPPQRRZ_______________________________________________
     |AABBEEEEEEEFFFFFFKKPPQQQQRRRZ
     |AABBBEEEEEEFFKPQQQQQQQQRRSSZZZ
     |AAABBBDEEEEFQQQQQRRRSSSSSSSVZZZZ
     |AAABBDDEFFRRRRRRSSSSSTVVVZZZZZ
 93.0|AABCDDEFRRRRRSSSSTTTTTUUVVVVZZZZ_________________________________________
     |AAAAABCCCDRRTTTTTUUUVVVVVZZZ
     |AAAABBBBCCDDTTTTTTUVVVXXZZZ
     |ABBBCCDDDDDTTUVVXXXXXXZZZ
     |CCCCCDDDDDDDTUUUUUVVVWXXXXXXZ
 92.0|CCCCCDDDDTUUUUUUUVVVWXXXZ________________________________________________
     |DDWWWWXXXZ
     |WWWXYYZ
     |WWWWXYYYYYYYZ
     |WWYYYZZ
 91.0|YZZZ_____________________________________________________________________
     |YZZZ
     |YZZ
     |YZZ
     |YYZ
 90.0|YYYZ_____________________________________________________________________
     |YY
     |YY
     |
     |
 89.0|-A-B-C-D-E-F-G-H-J-K-L-M-N-O-P-Q-R-S-T-U-V-W-X-Y-Z----|----|-- TPO= 0.595
                                     1 1 1 1 1 1
       3 3 4 4 5 5 6 6 7 7 8 8 8 9 9 0 0 1 1 2 2 1 1 2 2 3           3
       1 2 0 2 0 2 0 2 0 1 0 1 3 1 3 1 2 1 2 1 2 0 2 0 2 0           1
       3 6 9 4 8 2 6 0 5 9 2 6 0 6 0 4 8 1 5 0 4 9 4 7 4 9           0
Other Factors
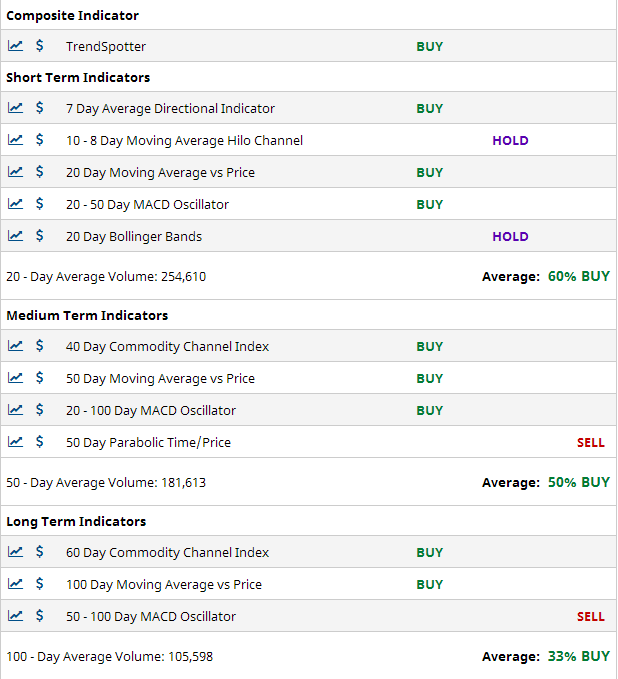
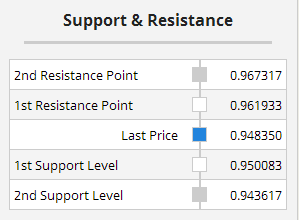
                 Risk Versus Opportunity Report
                ________________________________

                  JYM0    June Japanese Yen

                      High Price:  102.11
                   Current Price:  95.5
                       Low Price:  92.25

                            Risk:  0.067
                     Opportunity:  0.136

                    (O/R) Ratio =  2.034