![]()
Introduction Nirvana Internal Progrm Historic Range
We fed Copper, Gold, and Silver into a neural network to get the following result:
March Copper:
02-21-2020: March Copper: Virus Affects Global Economic Conditions
(Click on links below. Whole page needs to load before links work.)
Intermarket
Parabolic
News
Point & Figure
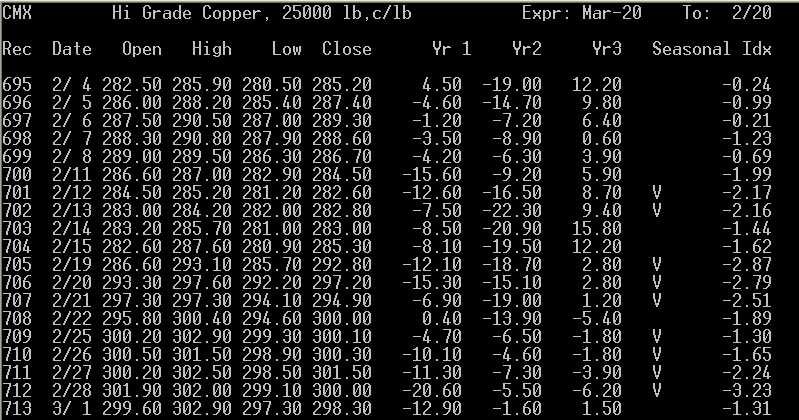
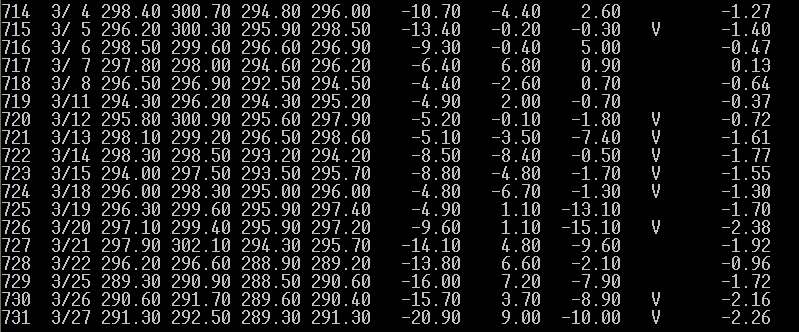
Cyclic/Seasonal
Third System
Margin
Commitment
Volatility





Introduction
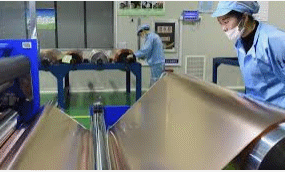
Two big factors are hindering copper prices worldwide. One is the coronavirus which has reduced smelting plant activity and ores shipments to China, a Number One purchaser. The other is a slowing global economy which has been riding on air for quite a while and due for a correction, something which would impact copper demand. Put together, copper continues toi look very weak in spite of bear trap rallies, and appears to be headed lower before it heads higher.
Intermarket Analysis


Parabolic Chart
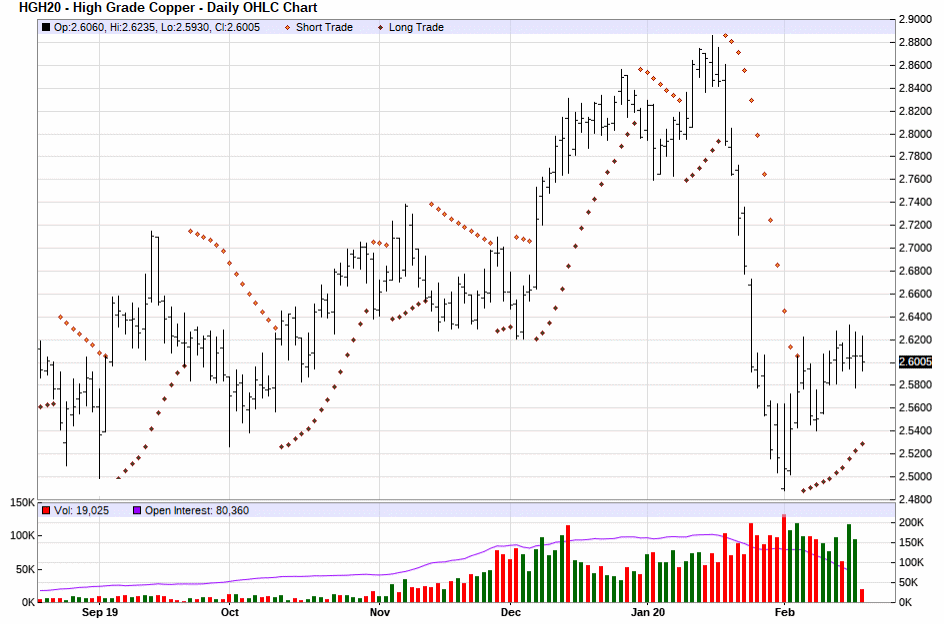
March Copper:
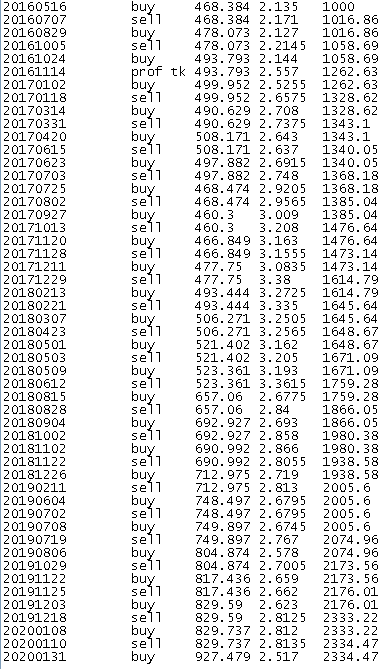
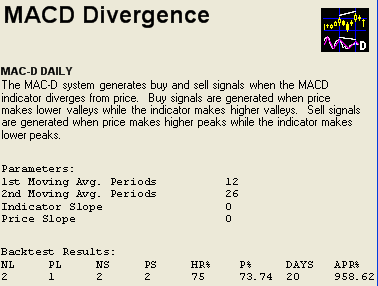
Nirvana Chart
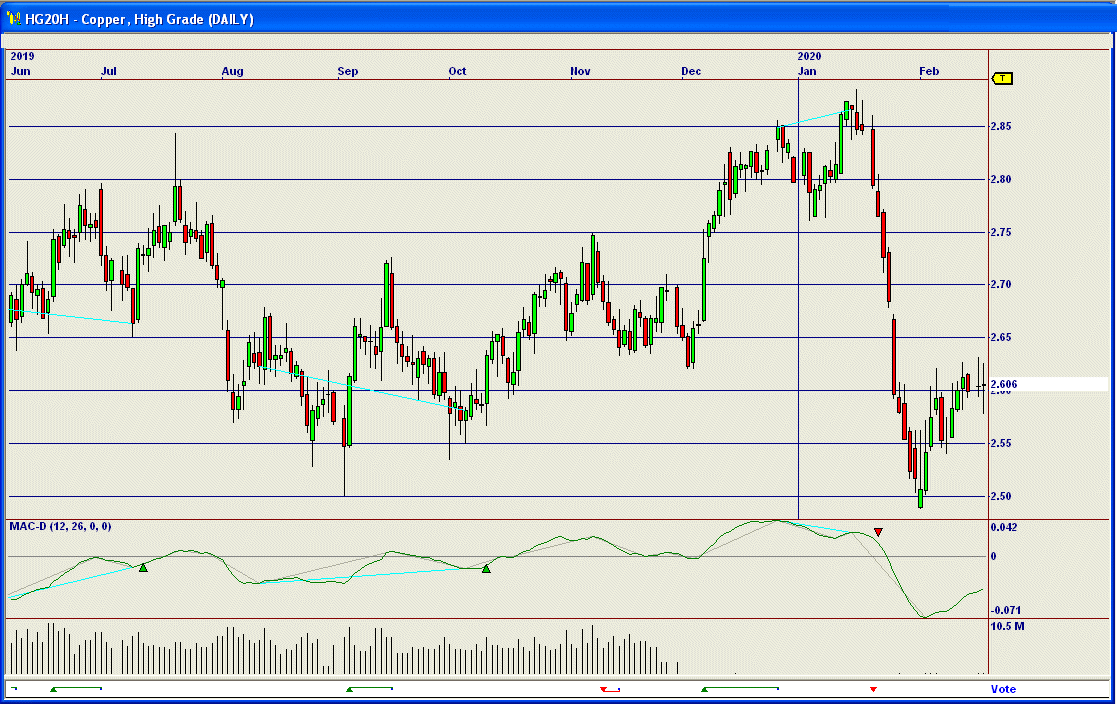
Copper has been on the longest losing streak in six years on China virus fears. The Chinese Government extended the Lunar New Year holiday and moire big businesses there told staff to work from home in an effort to curb the spread of the virus. Chinese demand accounts for about 50% of the majority of base metals. Wider geographical spread of the virus is veryk concerning, feeding through to the market. Infrastructure work in China will likely be pushed back until later in the year, but may still hit targets of 6% growth.
China reports that it is set to resume at least 50% of their state grid engineering projects by the end of this month. The Chinese have seen over 80% of power engineering oriented companies resume activityi to help repair significant reductions in Chinese copper demand. The gold/coppoer price ratio has reached an extreme level with gold excessively-valued with respect to copper price. Speculators and funds are short copper contracts in excess of 38,000 contracts which could start an avalanch of covering on any signs of strength.
With the coronavirus spread rate seemingly slowing, the Chinese are making every attempt to restimulate thier economy.
One of China's largest copper smelters, China Copper, locked in a major deal for supplyi at a time of reduced demand due to virus-led logistics lockldown in the country. Yunnan Copper's Ningde and Chifeng smelter bought 120,000 tonnes of clean copper concentrates for the first half of this year from a major trading house at a treatment charge of more than $70/tonne. The deliveryi period will be stretched to over three months. The treatment charge is considered igh compared to settlement levels agreed for supply contracts between miners and Chinese smelters over the same six-month period. Last year Antogagasta agreed toi supply concentrates to Jiangxi Copper and Tongling Nonferrous at a treatment and refining charge in the mid-$60's, or6 cents per pound from January until June 2020. Freeport-McMoRan and Chinese smelter Jiangxi Copper agreed to a full year contract at 6.2 cents per pound last November, considered a benchmark for the industry.
Transport disruptions are still in place to contain the spread of the virus, leaving manyi Chinese smelters struggling to destock sulfuric acid and coper cathodes, leading them to scale down their intake of copper concentrates. Market sellers are scrambling to find smelters willing to take cargoes.
Something called the copper smelting index puit January at 90.1, up from December's 88.9. These figures have ranged over the past 12 months from 85.2 in April to 93.8 in July. Activitiy was particularly strong in Europe. But activity levels in China reached their lowest levels since May, 2018.. The evidence from China sujggests production there has been curatiled but not stopped because of the virus.
Copper prices saw some improvement, lifted by news of a thaw in U.S.-China trade tensions and the promise of a deal between the two tariff-warring nations. Prices and production at Chile's Escondida's mine saw both fall 20% in the nine months to September, 2019, while Chile's state coopper comopany Codelco saw a 57% drop in profits to $603 million. Copper miners were hesitant to invest in new capacity. Peru expects $6.2 billion in mining investment in 2020 in seven projects, but mainly for base metals other than coipper.
In a seemingly endless bull market, U.S. equities may be living on borrowed time. U.S. stock markets seem to be in a state of denial about the actual real-world consequences of a Chinese industrial production shutdown and the impact upon global supply chains. Some elements even seem to be gloating about China's misfortune and predicament, completely oblivious to the act that this is going to have a negative impact on almost everyone. There has beena collapse of global freight as port ship handling in Malaysia, Sikngapore, and Japan is down 50% already. Supply chains are collapsing as all components made in China dry up for all sorts of products from cars to i-phones and computers. There has never been a global economic disruption on this cale in history, including the previoius SAR's pandemic. the CoiV's contagion rate if four times as fast as SAR's and up to 8 times as virulent. International air and sea travel are in free fall. Over 14 months, the Baltic Dry index plummeted from 2500 to just above 400, meaning the cost of shipping is just 1/6 of whkat it was about 5 months ago.
Analysts look for copper to make a weak rebound to alleviate a very oversold condition. But another severe downleg is projected by manyi chart analysts. Copper is often called "Dr. Copper" because weakness in copper is frequently seen as an earlyi warning sign of an impending recession. In this case it could mean even depression, and some see copper prices cracking the $2.00 level. Like copper, oil has been rallying feebly. Recent strength in the Chinese stock market is being interpreted by some as a "dead cat bounce."
Copper prices slipped lower on news that tech giant, Apple trimmed its revenue forecasts for the first quarter of this year, due to the impact of the coronavirus outbreak. Apple said production, workers' productivity and sales remain weak. China's virus death toll rose to more than 1,900, and infected cases at least 70,000.
Wall Street Journal reports were kicked out of China after making videos of China's makekshift hospitals, as China sought to restrain bad news related to how serious the virus outbreak is.
Intesa Sanpaolo Bank in Milan states that it expects the macroeconomic environment to deteriorate further in 2020 with llat copper prices in 2020. Singtificant downside risks persist it said. A Reuters poll finds similar outlooks from a variety of other analysts. 29 in all. Onliy severe shortages could lift prices amid a weak economic outlook.
We are headed toward a cyclical low and a seasonal down period.
News Analysis
Point & Figure Chart
355.0|                                                                  T  2/19
     | CMX - Mar-20 Hi Grade Copper, 25000 lb,c/lb Cm.=0.01  Lim.= 0.3
     |
     |                     X
     |                   X XO    X
335.0|___________________XOXOX___XO____________________________________________
     |                 X XOXOXO  XO
     |                 XOXOXOXOX XO
     |                 XOXOXOXOXOXO
     |                 XOXOXO OXOXO
315.0|_________________XOXOX__OXO_O____________________________________________
     |                 XOXO   O   O
     |                 XO         O
     |                 X          O
     |           X     X          O        X
295.0|___________XO____X__________O________XO__________________________________
     |     X X   XO    X          OX       XO
     |     XOXOX XOX   X          OXO  X X XO
     |     XOXOXOXOXOX X          OXO  XOXOXO    X
     |     XOXOXOXOXOXOX          O OX XOXOXOX   XO
275.0|_____XOXO_OXO_OXOX____________OXOXOXOXOXO__XO____________________________
     |     XOX  OX  O OX            OXOXO OXOXO  XO
     |     XOX  O     O             O O   OXO OX XO
     |     XO                             O   OXOXO
     |     X                                  OXOXO
255.0|_____X__________________________________OXO_O____________________________
     |     X                                  O   O
     |     X
     | X X X
     | XOXOX
235.0|_XOXOX___________________________________________________________________
     |OXOXOX
     |O OXO
     |  OX
     |  O
215.0|_________________________________________________________________________
     |
     |
     |
     |
195.0|----|----|----|----|----|----|----|----|----|----|----|----|----|----|---
           111111        111            111     11
      445681111221234556900212345667889901215789001
      020220122011231000112121010012120230120101022
      509323139560302139207534501555484002851912154
The above chart is giving a conventional sell signal.
Cyclical and Seasonal Factors
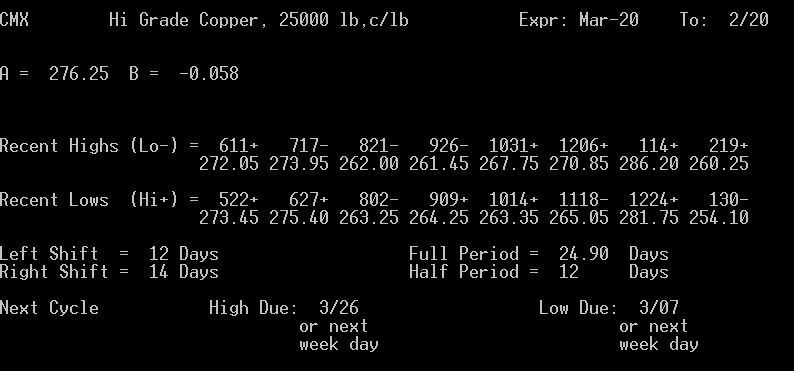
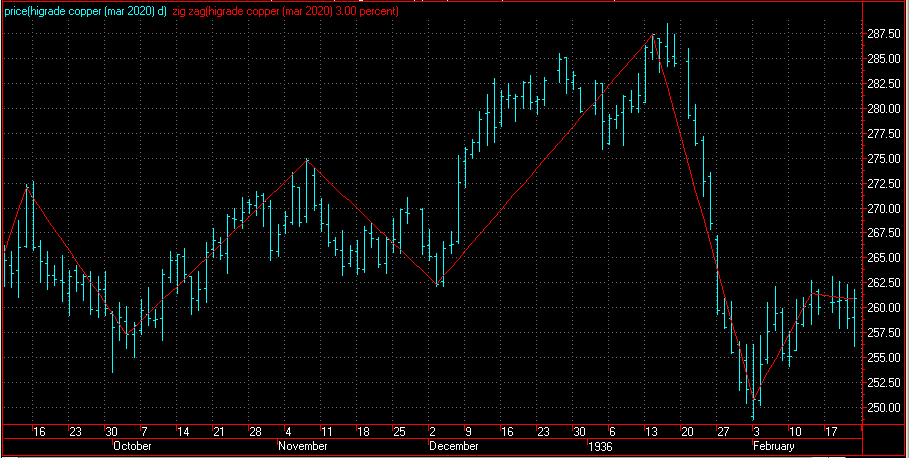
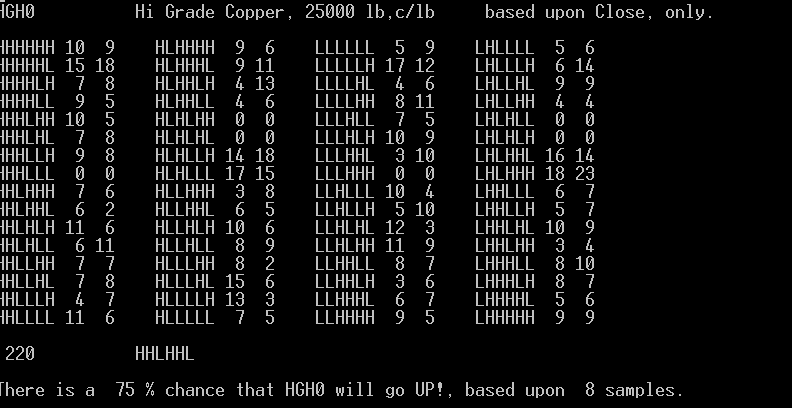
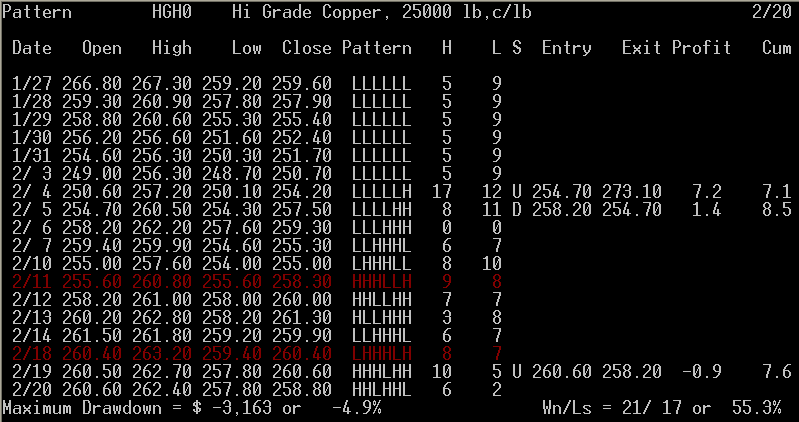
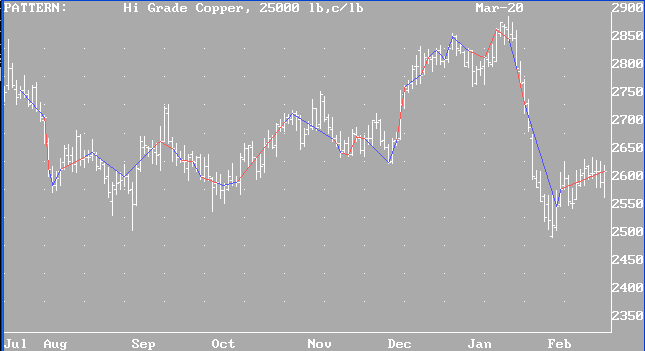
Our best-performing internal program is "Pattern". It is giving a buy signal.
Results of "Pattern" for Copper (blue lines = successful trades, red, unsuccessful):
(Always in the market.)
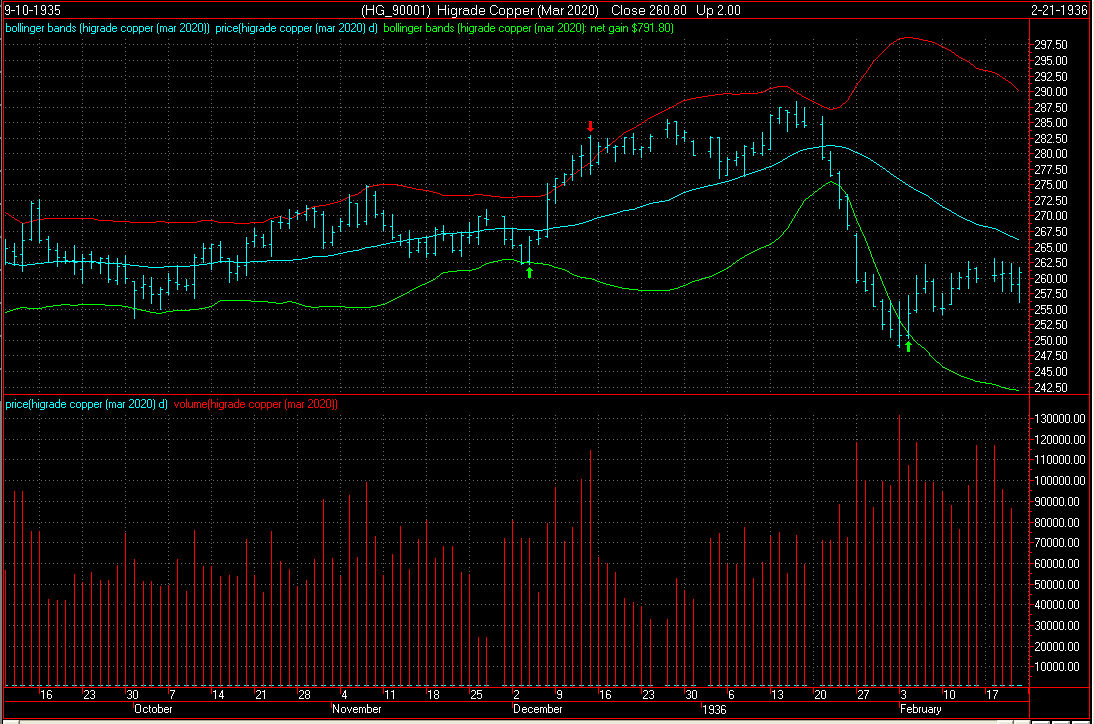
Our third system has triggered a buy signal. (Note, disregard the year on the chart. Our regular readers know this is not a Y2K-compliant system, but it still works.)
The point value is $250. Initial margin on a single contract is $ 2,970. Use of options is advised.
Scale traders are not a factor in this price range.
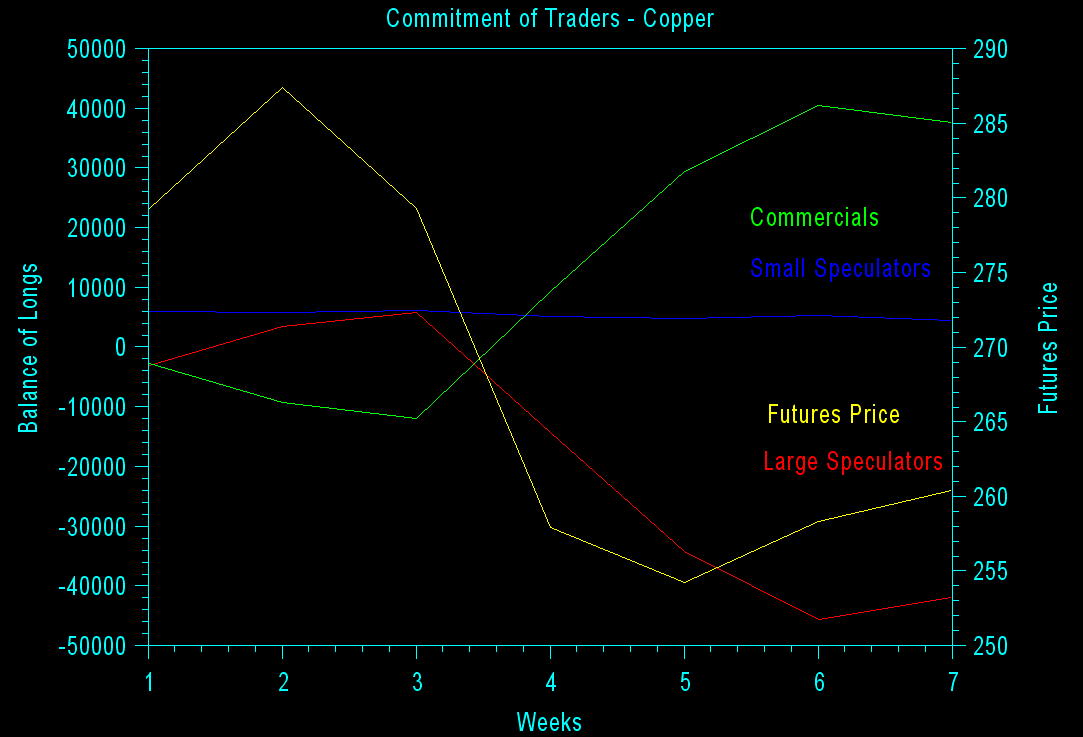
In the chart below, the yellow line is the futures price, read on the right axis. All other colors are read on the left axis. Blue is small speculators. Red is large speculators. Green is commercials. Large speculators with the best track record are getting increasingly-long.
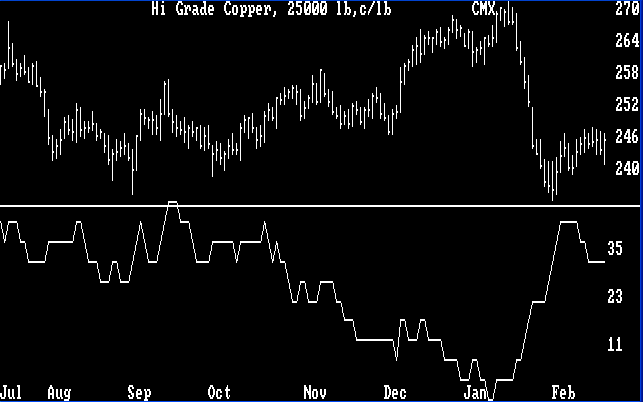
Interpretation of a Different Site Below (Their trader categories may vary from ours):
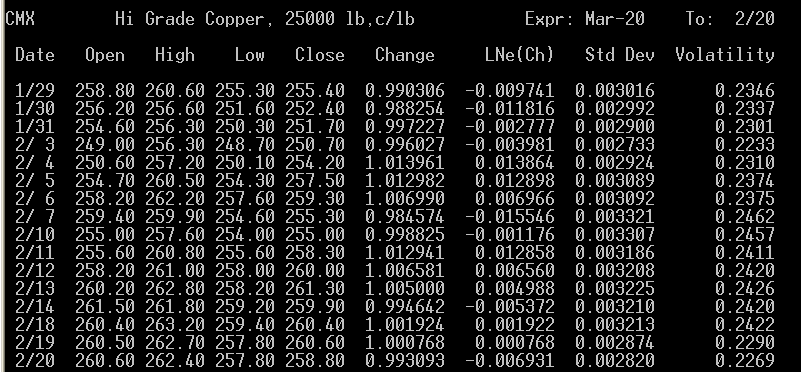
The average volatility shown below suggests that a downtrend remains intactd from the last volatility low point.
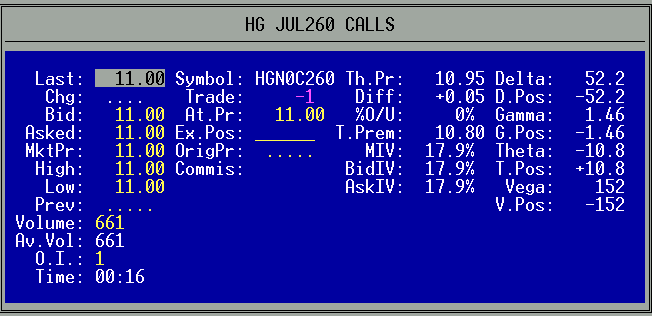
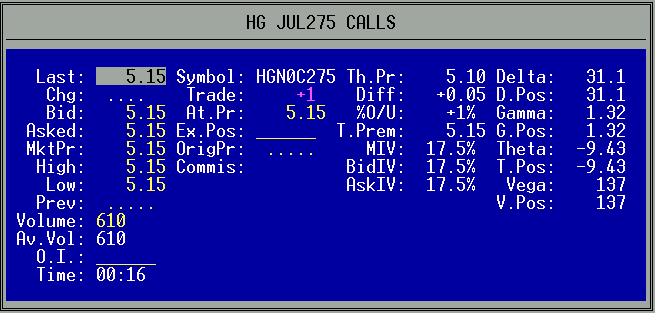
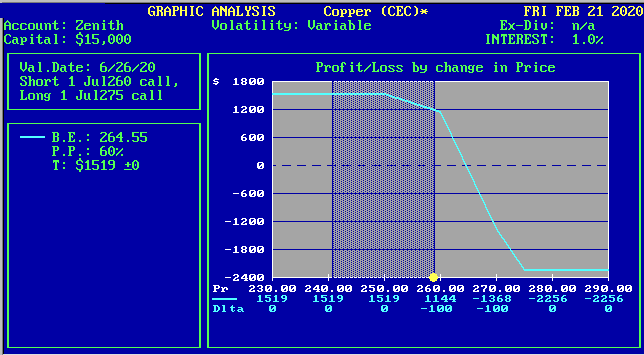
Our option trade recommendation is to Buy (1) July Hi-Grade Copper 275 Call and Sell (1) Julyi Hi-Grade Copper 260 Call @ 5.85 to the sell side or greater.
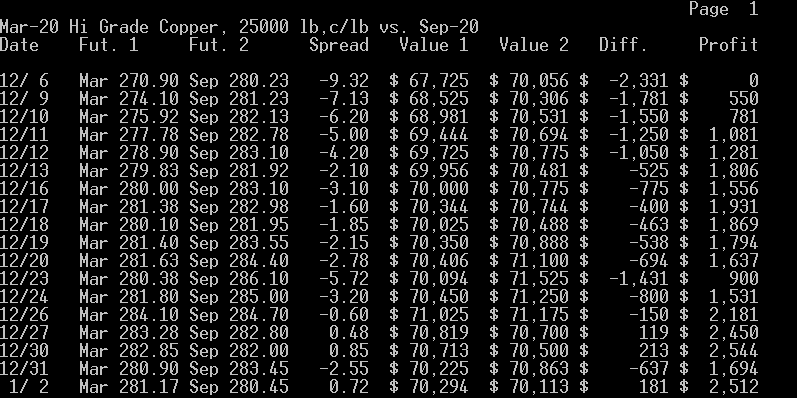
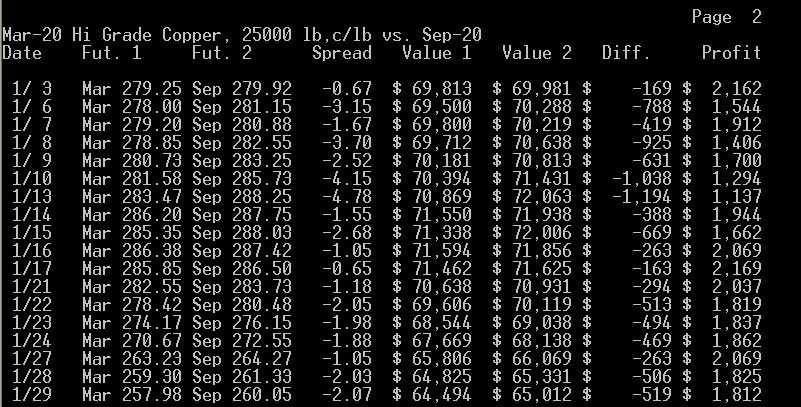
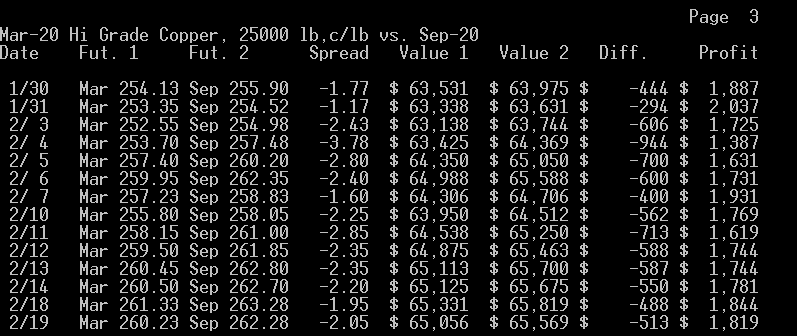
What the Mar. - Sep. calendar spread suggests to us is that buying the near contract and selling the far one is at most times profitable, which we think is a sign that these futures may go up in the long run. This disagrees with out ultimate conclusion. The best time to enter or leave the above spread is when it is at -1.00 or narrower buying the far as prices are rising and then selling the near, and exiting or entering when it is at -5.70 or wider selling the far as prices are falling and then buying the near. At this time, we appear to be midway with no particular trend detected in either direction.
To view the chart below correctly use Microsoft Internet Explorer.
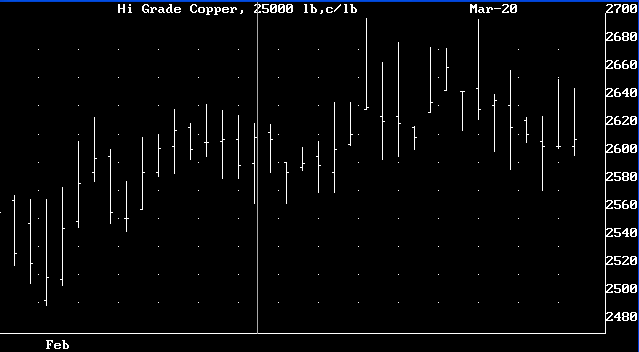
Here's an intraday chart for a previous day ( 2/20 ).
Internal Program
Third System Confirmation
Margin
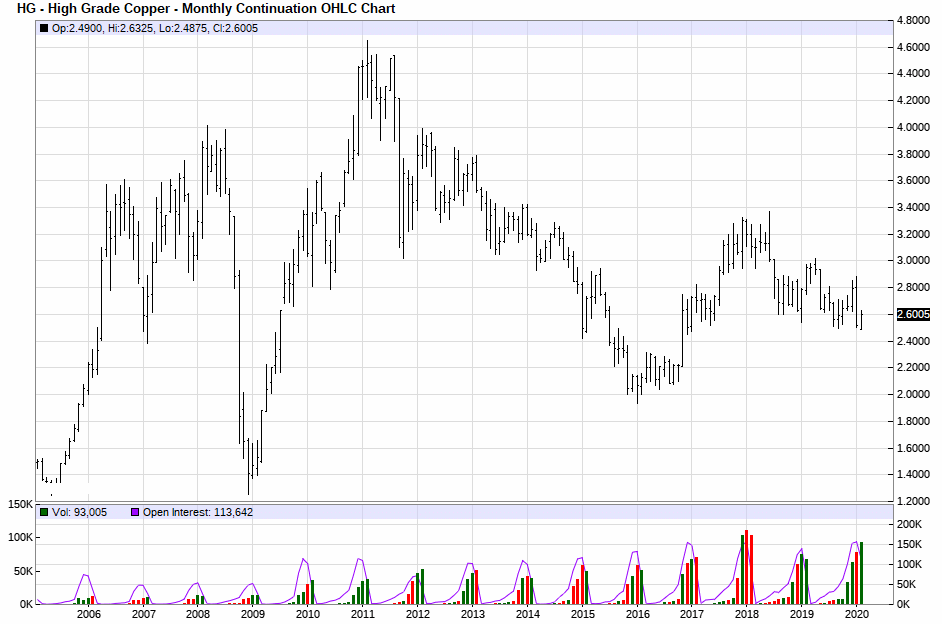
Historic Range
Commitment of Traders


Volatility / Probable Range

Possible Future Prices
Option Recommendation
Calendar Spread
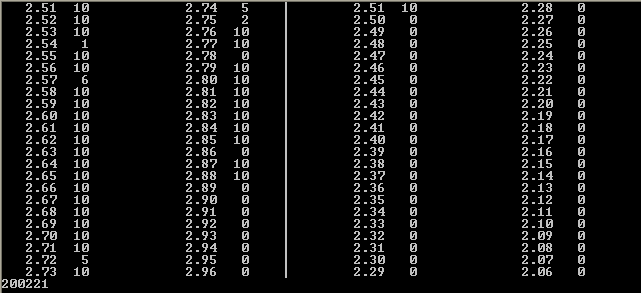
Level Table:
305.0|                                                                  T  2/21
 CMX - Mar-20 Hi Grade Copper, 25000 lb,c/lb Cm.=0.01  Lim.= 0.3
     |CD
     |AAAAABCDDD
     |AAAAAABBBBBCCCCDDDDDDDD
295.0|AAAABBBBBBBBCCCCCDDDDDDDE________________________________________________
     |AABBBBBBCCCDDDDEEEEEEE
     |BCCCEEEEEE
     |CCCCEEE
     |CCEF
285.0|EEFFXXXX_________________________________________________________________
     |EEFFFWWXXXXXX
     |EEEFFFFLVWWWWWXXX
     |FFFFFFLVVVVVVWWWWWWXXXXX
     |FFFFFFGJJLLVVVVVWWXXXY
275.0|FFFFGGJJJJKLLLLVVVVWWXYY_________________________________________________
     |FGGGJJJJJJJJJKKKLLLLLLLLTVVVY
     |GGGGHJJJJJKKKKKLLLLLMSTTVVYY
     |GGGGHHHHJKKKKKMPPSSSSSSTTTUVY
     |GGGHHHHHHHHHJKKKKMPPRSSSSSSSTTTUUUUVY
265.0|GGHHHHHHKKMMNPPPRRRSSTTTTTUUUUUUUVY______________________________________
     |GHKMMMMMNNOOOOOPPPPRRRRRRRSTTTTUUUUUY
     |MMMMMMNNNNNNOOOPPPPPPPPQQQRRRRRRRUUYZ
     |MMMMMMNNNOOOPPPPQQQQRRRRYZZZZZZ[[
     |MMMNNNOOOOQQQQQQQRYYZZZZZZZ[[   <<<
255.0|MNNNOOOQQQQRYYZZZZ[______________________________________________________
     |NOOQQYYYYZZZ
     |NOYYYY
     |OYYY
     |Y
245.0|_________________________________________________________________________
     |
     |
     |
     |
235.0|-A-B-C-D-E-F-G-H-J-K-L-M-N-O-P-Q-R-S-T-U-V-W-X-Y-Z----|----|-- TPO=-0.784
                                       1 1 1 1 1 1
       2 3 3 4 4 5 5 6 6 7 7 7 8 8 9 9 0 0 1 1 2 2 1 1 2 2           2
       2 0 2 0 2 0 2 0 1 0 1 3 1 2 1 2 1 2 0 2 0 2 0 2 0 2           2
       5 8 2 5 2 6 0 4 8 2 7 1 4 8 2 6 0 4 7 1 6 0 7 2 5 0           1
Other Factors
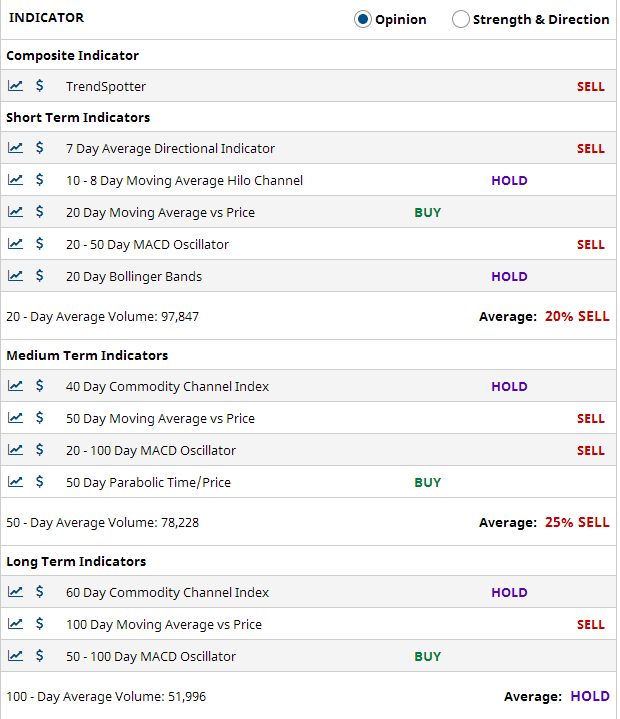
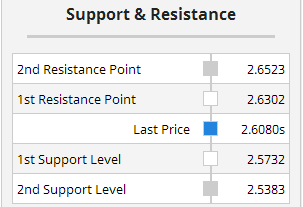

                 Risk Versus Opportunity Report
                ________________________________

                 HGH0    March Hi-Grade Copper

                      High Price:  267.75
                   Current Price:  258.8
                       Low Price:  240.5

                            Risk: -0.070
                     Opportunity: -0.144

                    (O/R) Ratio =  2.045