![]()
Introduction Nirvana Internal Progrm Historic Range04-24-2020: June Gold: Hyper Inflation Makes Sense Only if Products Make It to End Users
(Click on links below. Whole page needs to load before links work.)
Intermarket
Parabolic
News
Point & Figure
Cyclic/Seasonal
Third System
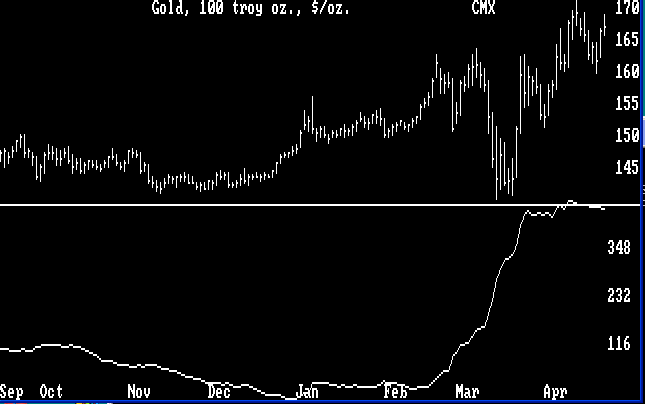
Margin
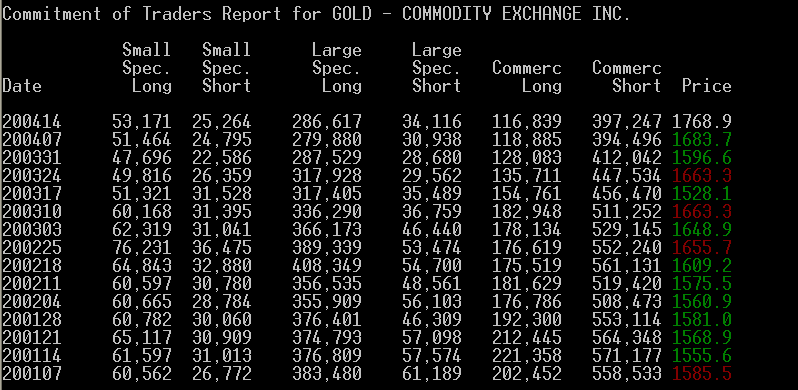
Commitment
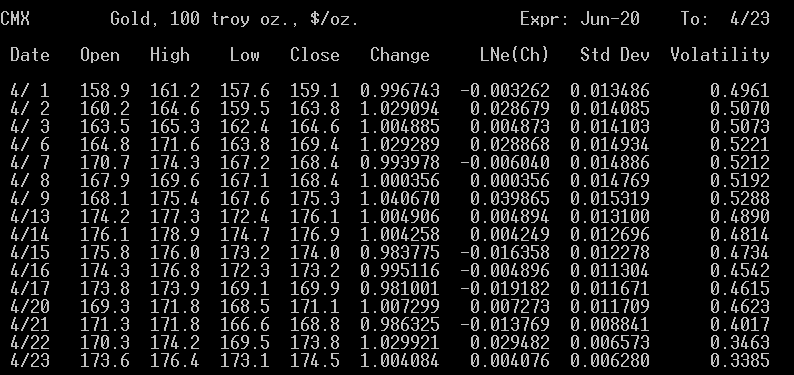
Volatility


Central banks are buying more gold because they see the possibility of hyper-inflation as a result of the reckless and ill-considered rush to provide bailouts and stimulus by both the European Common Union and also the U.S., increasing national debts into the stratosphere. To get out of debt these nations can always run printing presses to print out more worthless money, but there is only a finite amount of gold in the world. Thus central bankers are touting all sorts of rosy predictions about where gold prices are going. But bankers should never be brokers, and that last disaster was a result of Reagan Administration deregulation.
The commonly accepted historic precedent is for gold to move opposite to equities. Any current strenth in equities should normally be accompanied by weaker gold. But this is not a normal situation. The current crisis is driven not be economic factors but by an upredictable pandemic. In this situation, it seems possible for gold and equities to move in cotango.
The current situation is so unprecedented, added to by the Saudi-Russian attempt to corner the oil market by giving oil away. Our technical factors slightly favor a gold selloff. It's a little hard to understand why, given the possibility of hyper-inflation. But that is what our system is telling us.
One possible setup for gold price collapse is a worldwide logistics problem. Getting commodities from one place to another, whether they be gold shipments from Switzerland to the U.S. or meat or grains to market (even though there are plenty of meats and grains) and finding places to store oil, all these pandemic-related things cause situations where producers may be forced to "give away" products to unload them. That would be a deflationary situation and is a real possibility.
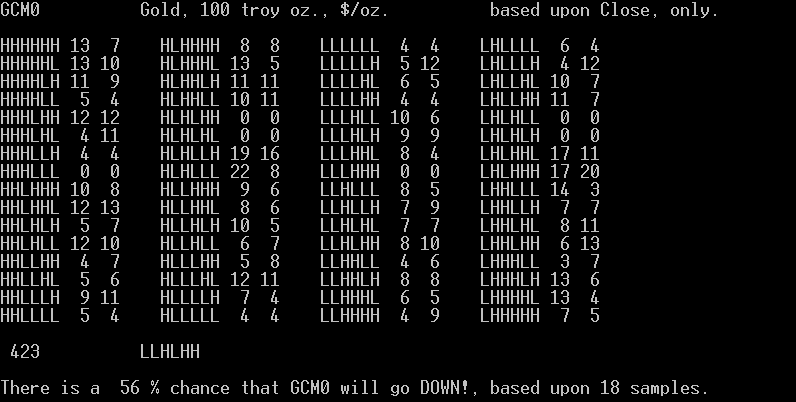
We fed Gold, Silver, and Palladium into a neural network to get the following result:
June Gold:
June Gold:
The ongoing historical decline in crude oil has had a deflating impact on most physical commodities. Crude oil price action could become the market's primary leading indicator on the global economic outlook, with spillover pressure on gold. Following the announcement of 3 new global stimulus packages and a key interest rate cut by China, it might be anticipated that gold prices would increase but that did not happen.
Bank of America raised their 18 month gold price forecast from $2,000 to $3,000/ounce. Central bank gold buying has been suggested, and exploding government and central bank balance sheets and unheard of fiscal deficits should life gold prices.
Jewelry demand for gold in India and China is soft.
The International Monetary Fund noted increased central bank gold holdngs for the month of March in Russia, Uzbekistan, and Turkey but Germany saw its central bank gold holdkngs decline.
ETF holdings of gold increased for the 21st straight trading session bringing net purchases to 11.6 million ounces.
There have been reports that the North Korean leader is gravely ill foillowing cardiovascular surgery last week. A power shift in North Korea might be a negative for gold as that could reduce tensions in the region.
A Swiss financial institution has published warnings for those looking for substitute gold-like instruments as that cold ioncrease demand for bullion, coins and bars. A major investment fund CEO who company manages $10.6 billion has indicated demand for his gold derivative instruments has been difficult to keep up with it. The Sprott physical gold trust saw $400 million of inflows in the first quarter compared to $178 million outflow last year.
Swiss exports of gold to the U.S. jumped sharply last month to reach the highest levels since 2012. The coronavirus has prompted safe haven buying in this country. The threat of a severe slowing in the virus remains a predominant threat to gold markets and it has periodically put off gold buying. But signs of ongoing investment interest combined with news of ongoing central bank purchases are seen encouragement to maintain prices off recent lows. Shipments to the U.S. from Europe's biggest precious metals refining hub rose to 43.2 tons. Exports to India and the U.K. had dropped and there were no shipments to mainland China, but the U.S. got almost half of all Swiss gold exports. There might not be enough gold bullion in New York to deliver against the futures contracts traded on the Comex. Lower production at key refineries including in Switzerland,and historic disruption in global travel has fueled volatility. Comex gold stockpiles have more than doubled to a record since late March.
There has been a massive failure of palladium prices caused by the deflationary environment cast by crude oil, and significant slowing of demand from the auto sector where palladium is used in converters, and this deflationary situation could spread to influence gold.
Jim Rogers says to stock up on gold and silver before the virus crisis is over. He sees airlines, hotels, tourism bursting out to recover and do well. More asset managers are turning to gold, due to its potential to perform well in the current environment. Fiscal stimulus deployed by the UK and U.S. in response to the virus crisis could lead to hyper inflation as all of the extra cash moves through the economy and demand picks up. Gold tends to hold its value even if inflation is rising. While more paper currency can be made, there is a finite amount of gold in the woirld. If there is no inflation, that could still helpgold as the yield on government bonds would be very low. Gold competes with government bonds for the role of safe haven in times of market strife.
TD Securities, State Street Advisers, and Cramer's "The Street" all think gold is on track for $1,900/ounce.
After announcing that it was to stop gold purchases from April 1st, Russia’s central bank has announced what may well be its last addition to its gold reserves for some time of some 300.000 ounces (9.33 tonnes) in March. This brings Russia’s total gold reserve to around 2,300 tonnes, the fifth largest national total according to the IMF, although one has one’s doubts about the 1,948.3 tonnes as reported by China which many believe is actually far higher. China has a long track record of under reporting its gold reserves and then coming up with a big upwards adjustment at multi-year intervals.
The reason for the Russian central bank’s decision to cease gold purchases for the Russian banks, which in turn bought gold from the country’s big gold mining industry – the world’s third largest after China and Australia – was to boost the country’s payments balance with world markets given the big decline in the price of oil and gas – Russia’s biggest export. Oil demand has been decimated by the global industrial downturn and national lockdowns which have hugely cut motor usage due to the coronavirus, as witness futures prices of West Texas Intermediate crude falling into negative territory. While European and Asian oil prices have not suffered quite such a calamitous meltdown, the oil price is at a fraction of where it was pre-coronavirus.
The Russian central bank has been by far the largest individual gold purchasing entity in the central bank universe for the past several years. Thus the fact that it is no longer buying gold will drastically affect the central bank gold purchasing element in gold supply/demand patterns this year. However a huge inflow into gold ETFs, given the general expectation of a rising gold price and the likelihood of further falls in equities due to the coronavirus effect on the global economy, will be more than counterbalancing the fall-off in Russian central bank gold purchases as long as the virus impact on the global economy persists. This could go on for many months yet, and when the world starts to re-open for business, no doubt the oil price will pick up at least a little and the Russian central bank resume its gold purchasing programme.
There has, reportedly, been a plea, though, by Russia’s gold miners that the central bank should resume some gold purchases because there has been a huge interruption to transportation of Russian gold to world markets given the shutdown of much of the global air travel sector. We somehow doubt that this will have any effect on the central bank’s position and we suspect that the gold producers will find means of getting their product to world markets in any case.
A month ago the nation’s February gold reserve increasec 12.44 tonnes questioning whether the nation could keep up its current rate of gold reserve purchases for the foreseeable future given the enormous fall in the oil price. It remained to be seen and the March volume announcement would be awaited with interest. However, the oil price fall is partly self-inflicted with Russia’s decision not cut oil deliveries in the light of a global over-supply situation. There may be an element of Russia trying to get back at the U.S. over sanctions in its oil export policy. The huge fall in the oil price may also have been aimed aimed at putting U.S. shale oil producers out of business by making their operations uneconomic.
The Russian central bank has had a policy of increasing its gold reserves virtually every month for more than 10 years. It looks to be paying off well economically. This could prove to be even more so, particularly if pundits predictions for the gold price to take off as the world dives into recession come about. It will certainly probably prove to have been a better choice for the nation’s reserves than the Swiss National Bank’s purchases of equities which will have crashed in value enormously over the past month. They could crash much further in the weeks and months ahead. The gold price is around 8% up year to date despite today’s heavy fall, whereas the Dow is down by nearly 20%, and could yet fall far further.
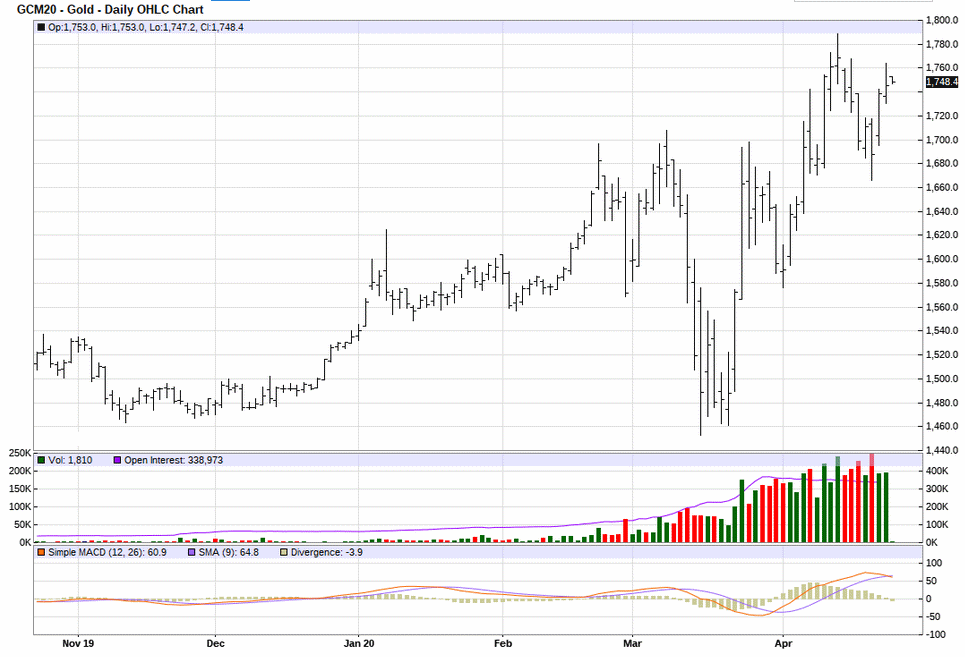
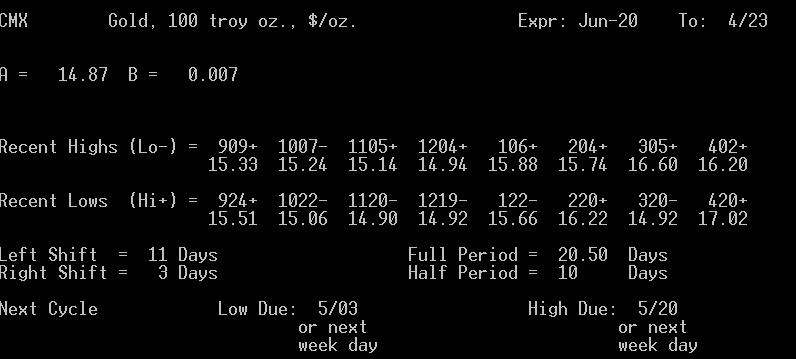
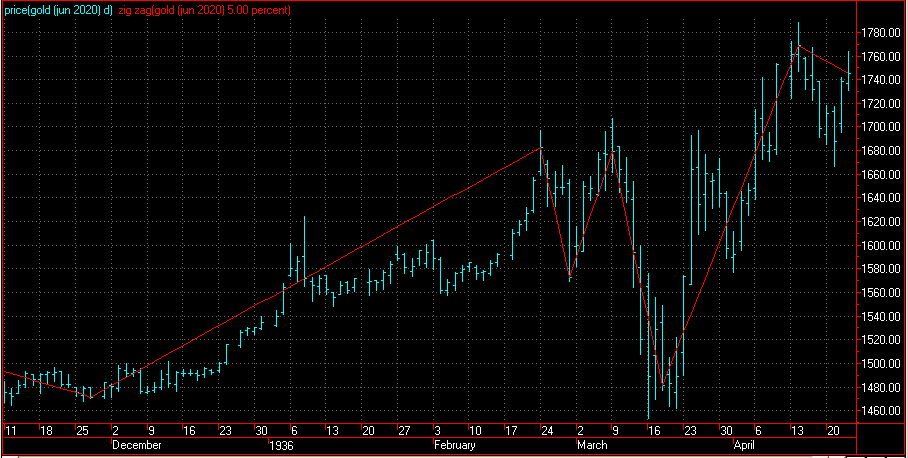
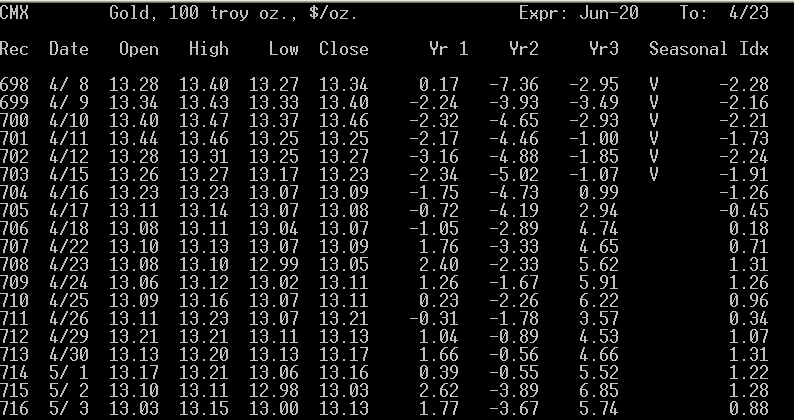
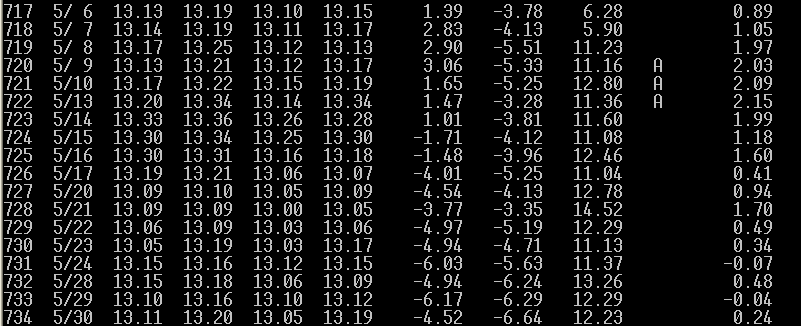
We are headed toward a cyclical low and a weak seasonal up period.
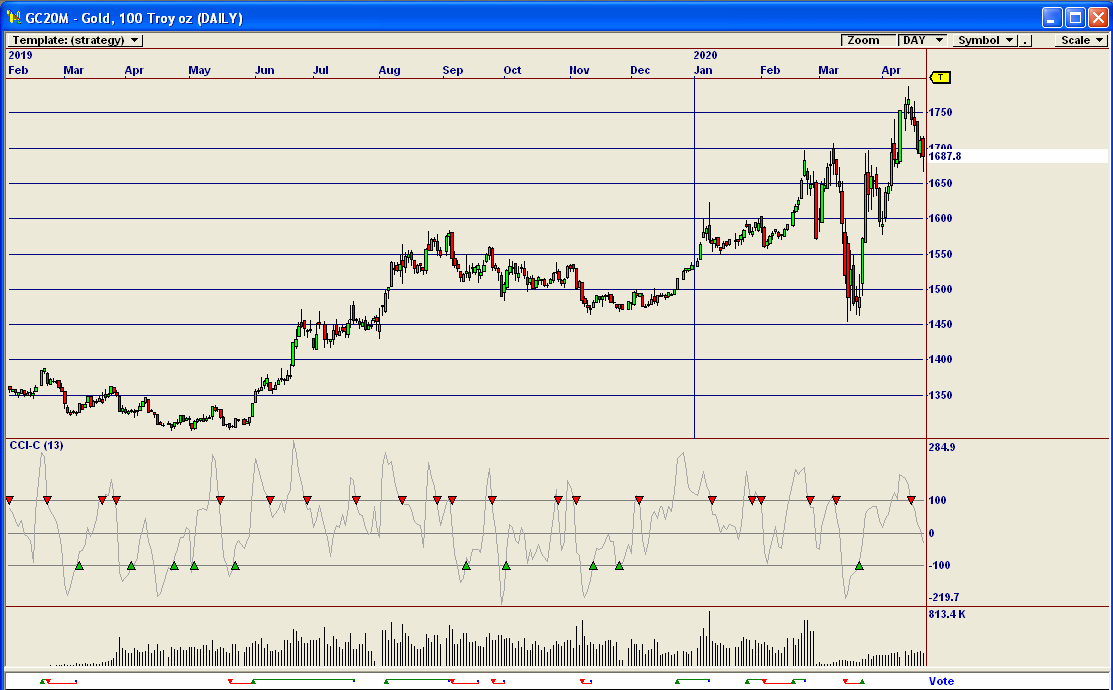
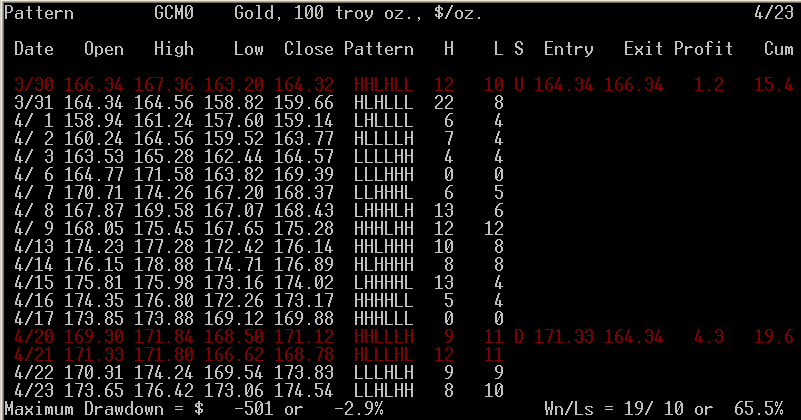
Our best-performing internal program is "Pattern". It is giving a sell signal.
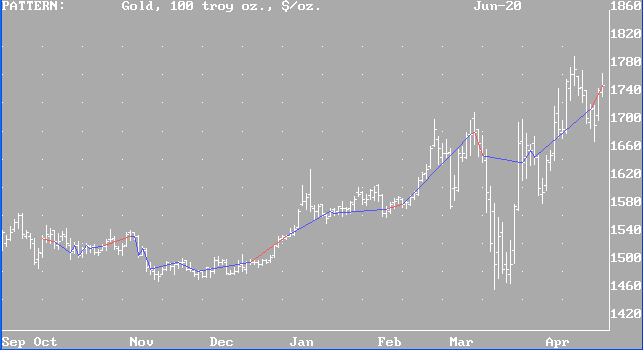
Results of "Pattern" for Gold (blue lines = successful trades, red, unsuccessful):
(Always in the market.)
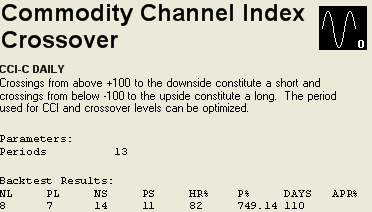
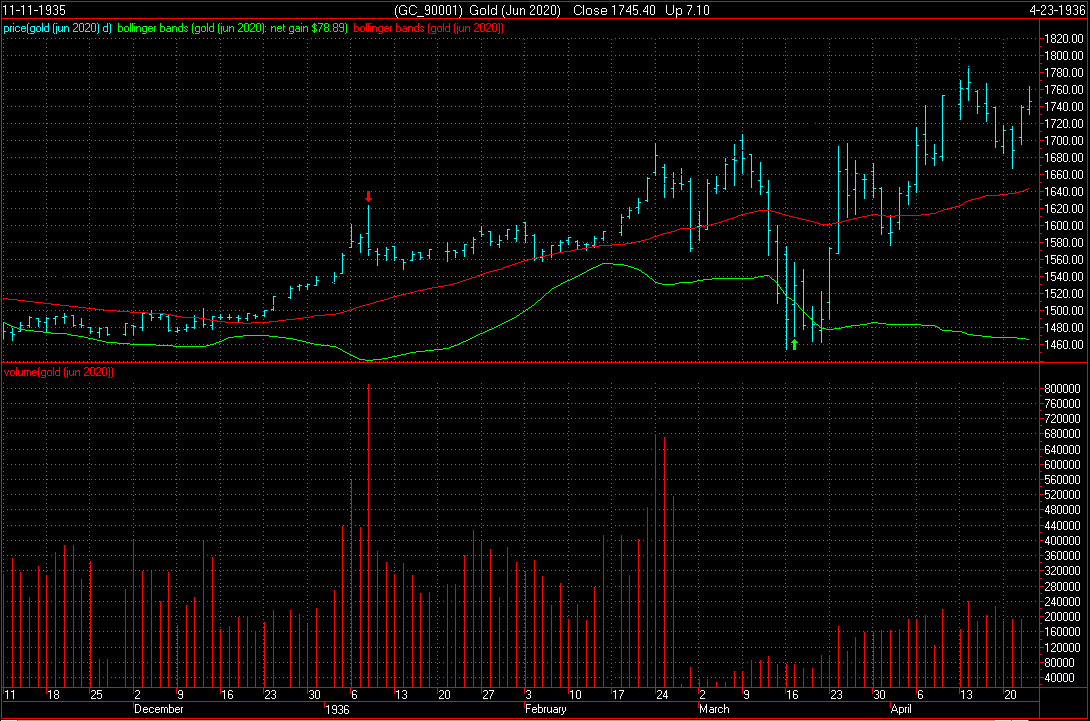
Our third system has triggered a buy signal. (Note, disregard the year on the chart. Our regular readers know this is not a Y2K-compliant system, but it still works.)
The point value is $100. Initial margin on a single contract is $10,065. Use of options is advised.
Scale trade sellers are entering the market for the long term in this price range.
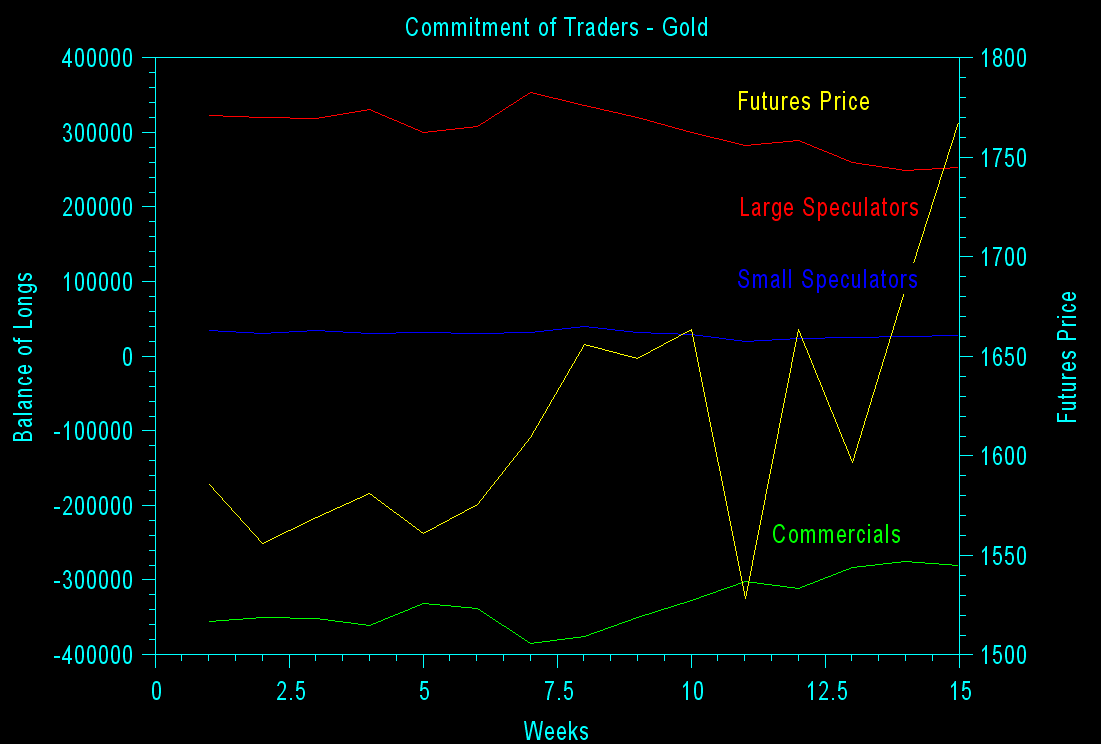
In the chart below, the yellow line is the futures price, read on the right axis. All other colors are read on the left axis. Blue is small speculators. Red is large speculators. Green is commercials. Large speculators with the best track record are getting increasingly-short with exception of slight blip in latest data.
Interpretation of a Different Site Below (Their trader categories may vary from ours):
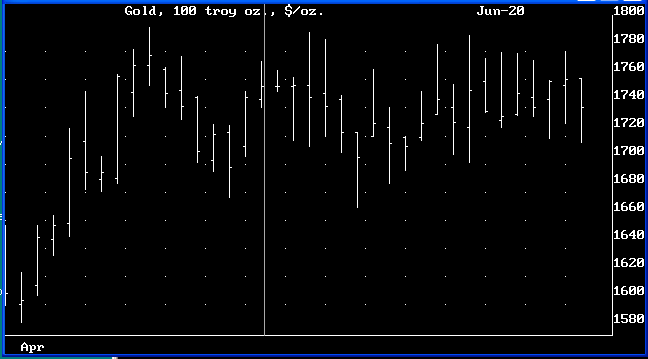
The average volatility shown below suggests that an uptrend remains intact from the last volatility low point.
An option trade recommendation may be added later in this spot.
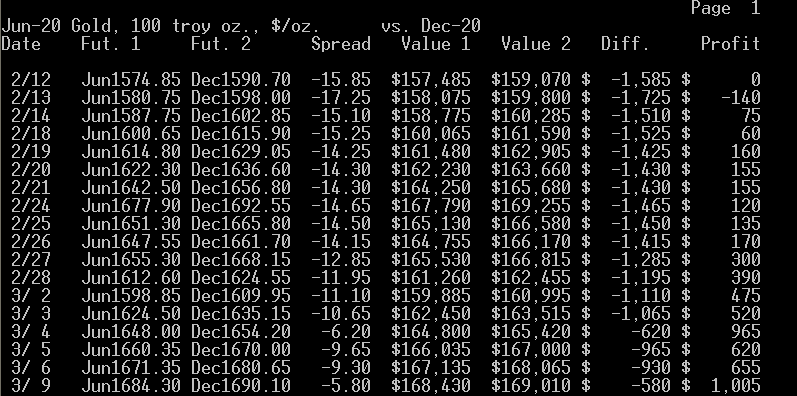
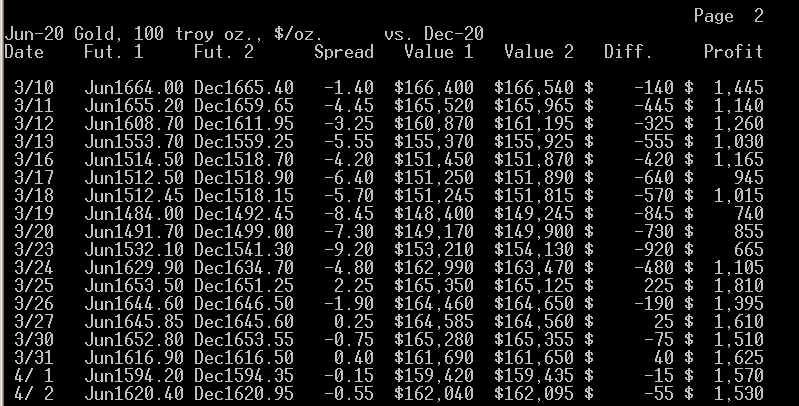
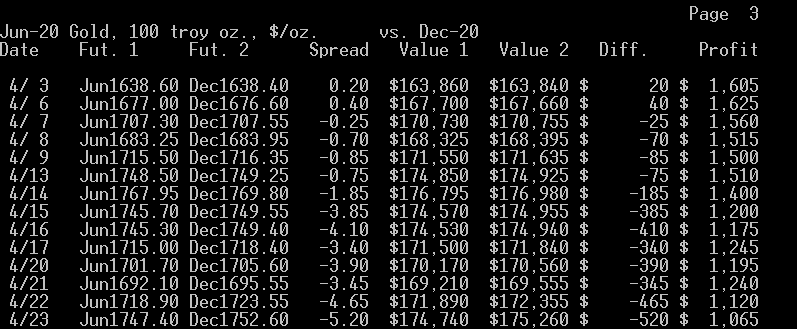
What the Jan. - Jul. calendar spread suggests to us is that buying the near contract and selling the far one is at most times profitable, which we think is a sign that these futures may go flat in the long run. The best time to enter or leave the above spread is when it is at +0.25 or narrower buying the far as prices are rising and then selling the near, and exiting or entering when it is at -15.00 or wider selling the far as prices are falling and then buying the near. At this time, we appear to be midway but approaching the buy the near, sell the far point.
To view the chart below correctly use Microsoft Internet Explorer.
wp iwp
Here's an intraday chart for a previous day ( 7/11 ).
Introduction
If products like paper towels, toilet paper, thermometers and meat don't make it to market, wouldn't that cause their value to accelerate in shortages? The answer may be the opposite of what one thinks. If basic commodities cannot make it to market (and we are thinking about things from a producer rather than a consumer standpoint like oil which can't be sold if there is no place to store it), then they may have to literally "give them away" to unload large inventories. That looks more like a deflationary situation.
Intermarket Analysis


Parabolic Chart
Nirvana Chart
News Analysis
Point & Figure Chart
180.0|                                                                  T  4/23
     | CMX - Jun-20 Gold, 100 troy oz., $/oz.      Cm.=0.00  Lim.= 0.9
     |
     |                            X
     |                            XO
175.0|____________________________XOX__________________________________________
     |                            XOX
     |                          X XOX
     |                          XOXOX
     |                          XOXOX
     |                          XOXOX
170.0|__________________________XOXOX__________________________________________
     |              X           XOXOX
     |            X XO      X   XO OX
     |            XOXO      XO  X  O
     |            XOXO      XOX X
165.0|____________XOXO______XOXOX______________________________________________
     |            XOXO      XOXOX
     |            XOXO      XOXOX
     |            XOXO      XOXOX
     |        X   XOXO      XO OX
160.0|________XO__XOXO______X__OX______________________________________________
     |        XOX XOXO      X  OX
     |        XOXOXOXO      X  O
     |X       XOXOXO O      X
     |XO      XOXO   OX     X
155.0|XO__X___XO_____O_O____X__________________________________________________
     |XOX XO  X      O OX   X
     |XOXOXOX X      O OXO  X
     |XOXOXOXOX      O OXO  X
     |XO O OXOX      O OXOX X
150.0|X____OXOX________OXOXOX__________________________________________________
     |     O OX        OXOXOX
     |       OX        OXOXO
     |       O         OXO
     |                 OX
145.0|_________________O_______________________________________________________
     |
     |
     |
     |
140.0|----|----|----|----|----|----|----|----|----|----|----|----|----|----|---
            111
      8999990021122233333333333344444
      0011220120201201111122222300012
      7528373148748520667800356127952
The above chart is giving a conventional sell signal.
Cyclical and Seasonal Factors
Internal Program
Third System Confirmation
Margin
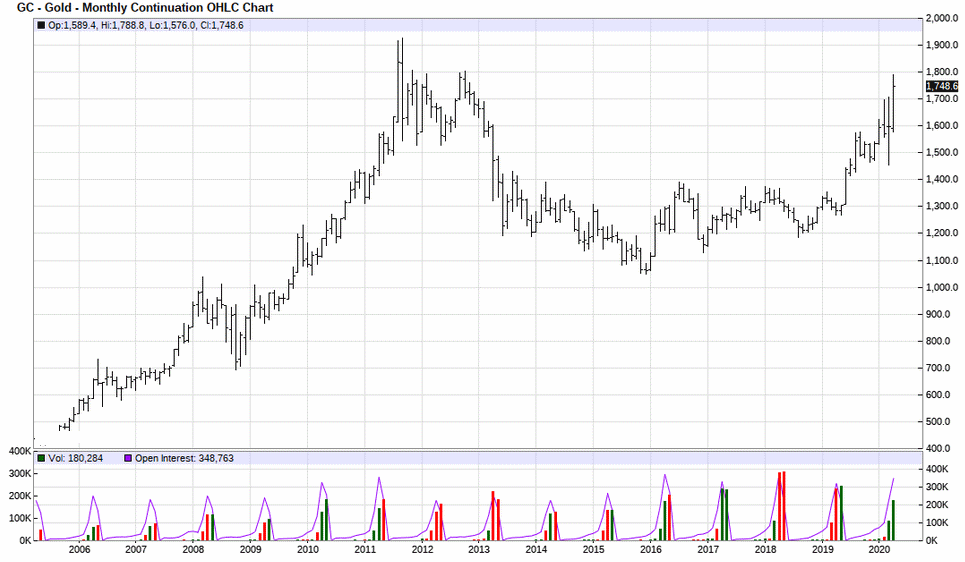
Historic Range
Commitment of Traders

Volatility / Probable Range

Possible Future Prices
Option Recommendation
Calendar Spread
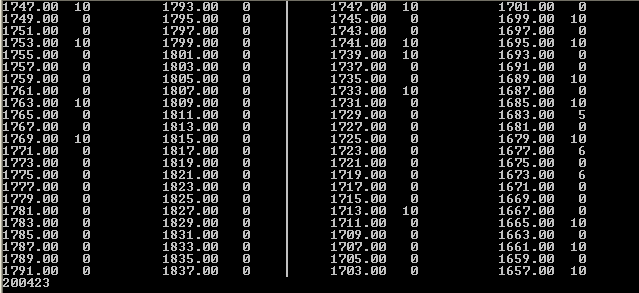
Level Table:
184|                                                                 R  4/23
 CMX - Jun-20 Gold, 100 troy oz., $/oz.      Cm.=0.00  Lim.= 0.9
     |
     |
     |
179|_________________________________________________________________________
     |
     |Z
     |Z
     |ZZZ
174|ZZZZ[____________________________________________________________________
     |ZZZZ[   <<<
     |ZZZZZZ[[
     |ZZZZZ[
     |YZZZZZ[
169|WYZZZZZ[_________________________________________________________________
     |VWWYYZZZZZZ
     |VWWYYYZZZZZ
     |VWWWXYYYYZZZ
     |VWWWWWXXYYYYY
164|VWWWWWWWXXYYYYYY_________________________________________________________
     |VWWWWWWWXXXYYYYYYYYY
     |VWWWWXYYYYYYYY
     |VWWXYYYYYY
     |SVVWWWXYYYYY
159|SVWWWXYYYY_______________________________________________________________
     |SSUUUUVWWWXXYYY
     |KSSSTUUUUUUVVVWWXXYY
     |JJJKKKSSSTTTTUUUUVVVWXXXY
     |JJJJKKKSSSTTTTTTTTUUUXXXX
154|HHHJJJJJKKLLSSTXXXX______________________________________________________
     |HHHHHJJKKKLLLSXXXXX
     |HHHHHHHJJJJKKKKKLLLLMMMMMNOOSSXXXXX
     |HHHHHHJJJJJKKKKKLLLLLLMMMMMMMMNNNOOOOSSSXXXXX
     |HHKKKKLLLLMMMMMMNNNNNNNOOOORSXXXXXX
149|HLMMMMNNNNNOOOOORXXXXXX__________________________________________________
     |HHLMOPQQQQRRRRRRXXXXXX
     |HMOOPPPPPPPPQQRRRRXXXXX
     |FFGHOOPPPPQQQQQQQXXXX
     |EEFFGGPXXX
144|EEEEEFFFFGGGGGGGGX_______________________________________________________
     |EEEEEEEFFFFFFFGGGGGG
     |EEEEEEFFFFFFG
     |DEEEEFFF
     |DEEE
139|D________________________________________________________________________
     |D
     |DDD
     |CDDDD
     |CCDDDDD
134|CCD______________________________________________________________________
     |C
     |BBC
     |BBBC
     |AAAAAAAABBBCCCCC
129|AABBBC___________________________________________________________________
     |
     |
     |
     |
124|-A-B-C-D-E-F-G-H-J-K-L-M-N-O-P-Q-R-S-T-U-V-W-X-Y-Z----|----|-- TPO= 0.111
                             1 1 1 1 1 1 1
       4 5 5 6 6 7 7 8 8 9 9 0 0 0 1 1 2 2 1 1 2 2 3 3 4 4           4
       2 0 2 0 2 0 2 0 1 0 1 0 1 2 1 2 1 2 1 2 1 2 1 2 0 2           2
       6 9 3 7 1 8 2 5 9 3 7 1 5 9 2 6 1 6 0 7 0 5 0 4 7 2           3
Other Factors
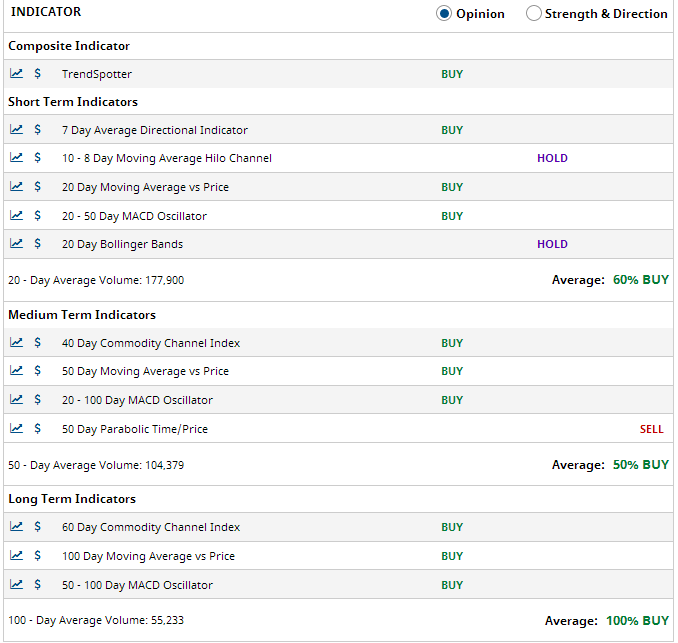
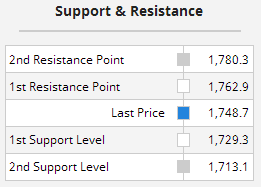
                 Risk Versus Opportunity Report
                ________________________________

                     GCM0    June Gold

                      High Price:  1836
                   Current Price:  1745
                       Low Price:  1558

                            Risk: -0.107
                     Opportunity: -0.220

                    (O/R) Ratio =  2.055