![]()
Introduction Nirvana Internal Progrm
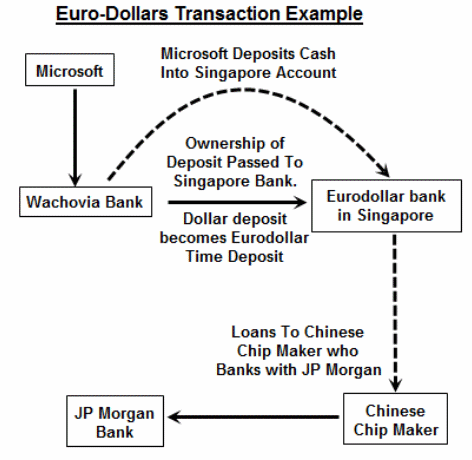
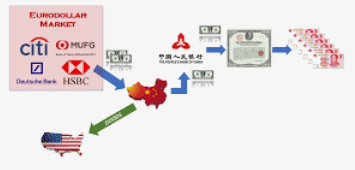
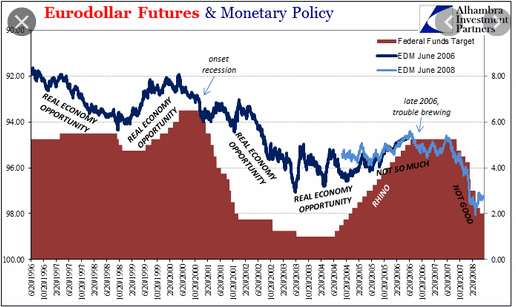
In the case of Eurodollars, the use of the LIBOR index is being increasingly discredited as a measure of the demand for Eurodollars with out indices taking precedence in a period of change. Change involves shifting importance of London fionancial markets due both to Brexit and highly volatille and sometimes irrational panic selling triggered by the virus problem.
We fed Eurodollars, Treasury Bonds, and Treasury Notes into a neural network to get the following result:
September '21 Eurodollars:
06-13-2020: September '21 Eurodollars: Dull Comes To Life
(Click on links below. Whole page needs to load before links work.)
Intermarket
Parabolic
News
Point & Figure
Cyclic/Seasonal
Third System
Margin

Introduction
Interest rate - financial futures have recently taken on a very unusual pre-eminence in volatility and movement over many other commodities. Thus we are showing greatest changes and either strengths or weaknesses in this unlikely group of futures. Investors should not lose sight of this. Something unusual is happening.
Intermarket Analysis


Parabolic Chart
September '21 Eurodollars:
Nirvana Chart
Competing for Eurodollar trading is the fastest-growing futures contract in Chicago Mercantile Exchange history, "Secured Overnight Financing Rate ("SOFR") futures. They debuted a year ago. They are often spread against the Federal Reserve 30-Day Federal Funds futures, or against Eurodollar futures, changing hands at the rate of 28,000 contracts a day ($7775,000 in terms of one basis point of SOFR exposure.)
Libor transactions have dwindled but they are the basis for an interbank lending market. The Libor Index is considered increasingly unreliable. U.S. Dollars and the SOFR Index have been suggested as replacements for the Libor rates.
SONIA (based on the British Pound) and EONIA (based upon the Euro) are considered a better overnight reference rate, used in swaps, where a fixed rate is swapped against a pre-determined published index of a daily overnight reference rate.
A "leverage ratio" requirement in the U.S. requires banks to hold capital equal to balance sheet assets at a minimum level of 4% in the U.S. In order to be well-capitalized, banks must achieve a 5% minimum leverage ratio is having a negative effect on Eurodollar trading.
Forbidding international tensions are impacting Eurodollar trading, including the bombing of 33 Tuirkish soldiers in Syria by Russia in the Middle East.
Sometimes the Euro vs. the U.S. Dollar is referred to as the "Eurodollar pair." The Euro has not necessarily remained weak and while some suggest it will reach parity with the U.S. Dollar before, others suggest a flight to safety may favor both the Euro and the Swiss Franc.
Latest developments in the sturggle internationally against the virus have resulted in extreme market volatility or "panic mode" and selloffs. The European Central Bank appears to be unable to generate enough stimulus to trigger inflation and make the Euro more attractive for carry traders. A zero interest rate Euro is simply not attractive to traders except as a carry item.
The German economy, formerly strongest in the Euro Zone, is showing signs oif slowing down. Germany is playing catch-up to China and U.S. in technological developments for electric vehicles and autonomous driving. This can spell pain for the Euro going forward and iompact Eurodollar trading negatively.
Trump's tariffs are helping to weaken the European economy, resulting in reduced demand for Eurodollars.
As China tightens its grip on Hong Kong, Hong Kong will lose much of its appeal to foreign investors as a financial hub. The Hong Kong Dollar is pegged to the U.S. Dollar meaning it trades with a very narrow spread between the two currencies. HSBC Bank (Hong Kong and Shanghai Bank) has supported mainland China's policies toward Hong Kong. This is allowing HSBC to be an under-performer in markets, and affects Eurodollar trading. That does not mean lack of interest, for the former dull futures market has been very active coming to life. However, investor interest in haviong Eurodollars seems to be cooling.
We ssee overall news as generally negative for Eurodollars.
The "LIBOR" rate is the London Inter-Bank Overnight Rate. It is similar to the Federal Funds rate and usually tracks it closely, but may offer a better interest rate on deposits. American banks can use overseas deposits to credit the necessary capitalization requirements
by law in the U.S. Eurdollars have interest rates close to an index, the "LIBOR", while T-Bills are similar short-term contracts based upon the Fed Funds rates. In times of crisis, spreads between interest on Eurodollars and U.S. bank interest rates, with whichever area (domestic
or overseas) having the worst crisis apt to have interest rates increase.
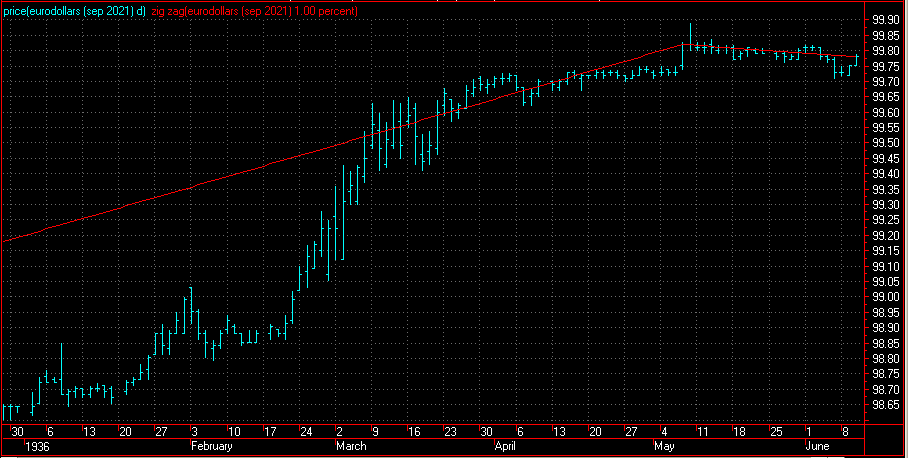
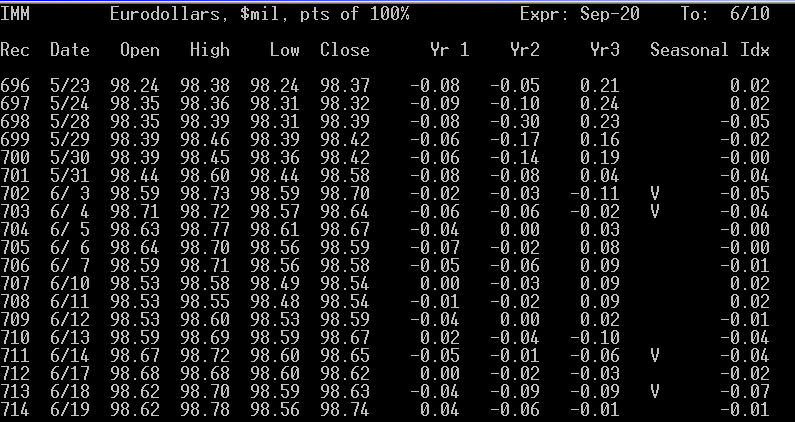
We are headed toward a cyclical low and are in a seasonal down period.
News Analysis
Point & Figure Chart
100.0|                                                                  R  6/10
     | IMM - Sep-20 Eurodollars, $mil, pts of 100% Cm.=0.01  Lim.= 0.2
     |
     |
     |                                  X
 99.8|__________________________________X______________________________________
     |                                  X
     |                                  X
     |                                X X
     |                                XOX
 99.5|________________________________XOX______________________________________
     |                                XO
     |                                X
     |                                X
     |                              X X
 99.3|______________________________X_X________________________________________
     |                            X X X
     |                            XOX X
     |                            XOXO
     |                            XO
 99.0|______________X_X_X_________X____________________________________________
     |              XOXOXOX     X X
     |              XOXOXOXO    XOX
     |              XO O OXO    XOX
     |            X X    OXOX X XO
 98.8|X___________XOX____OXOXOXOX______________________________________________
     |XO        X XOX    OXOXOXOX
     | O        XOXOX    OXOXOXO
     | OX       XOXOX    O O O
     | OXO      XOXOX
 98.5|_OXO______XO_OX__________________________________________________________
     | OXO      X  O
     | OXO      X
     | OXO      X
     | OXO      X
 98.3|_OXO____X_X______________________________________________________________
     | OXO    XOX
     | O O    XOX
     |   O    XOX
     |   O    XOX
 98.0|___O__X_XOX______________________________________________________________
     |   O  XOXO
     |   O  XOX
     |   O  XOX
     |   O  XOX
 97.8|___O__XOX________________________________________________________________
     |   O  XO
     |   OX X
     |   OXOX
     |   OXOX
 97.5|___OXOX__________________________________________________________________
     |   OXOX
     |   OXOX
     |   O OX
     |     OX
 97.3|_____OX__________________________________________________________________
     |     OX
     |     O
     |
     |
 97.0|----|----|----|----|----|----|----|----|----|----|----|----|----|----|---
       1    1              111
      81495611245667888889901211122233333
      11012010200110011221212100202200012
      70389197711041135360400289751823373
Our computer tells us a non-conventional reactive approach works best for Eurodollars on p&f charts. Therefore the above chart is taken as giving a sell signal.
Cyclical and Seasonal Factors
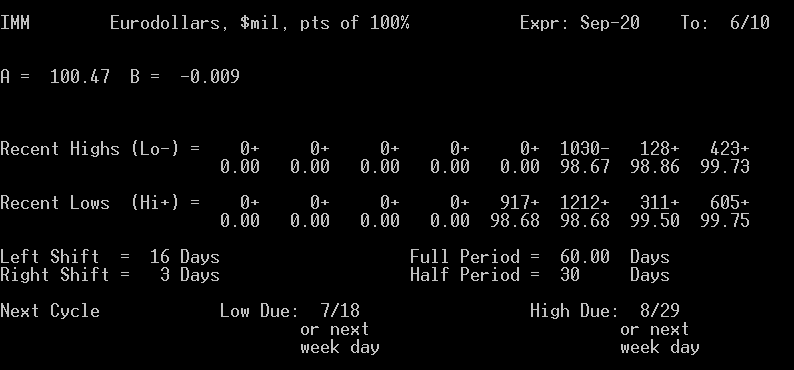
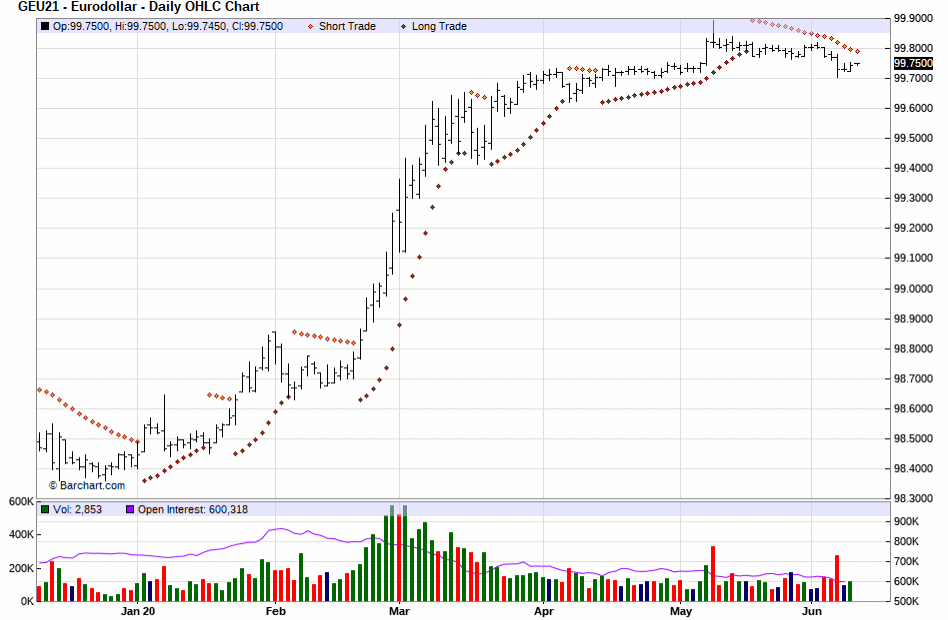
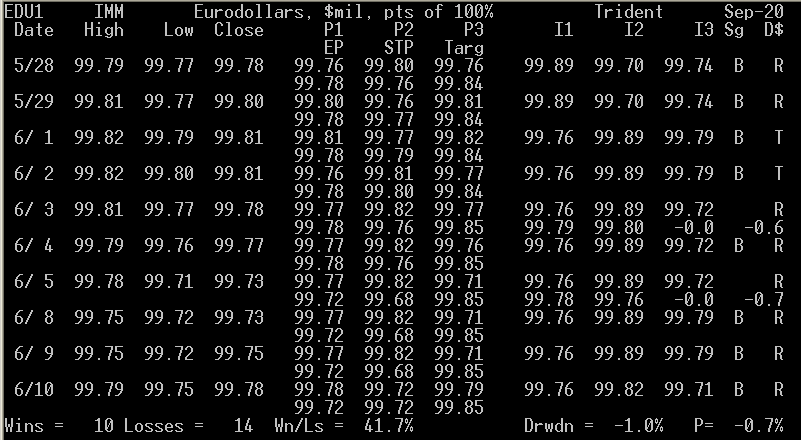
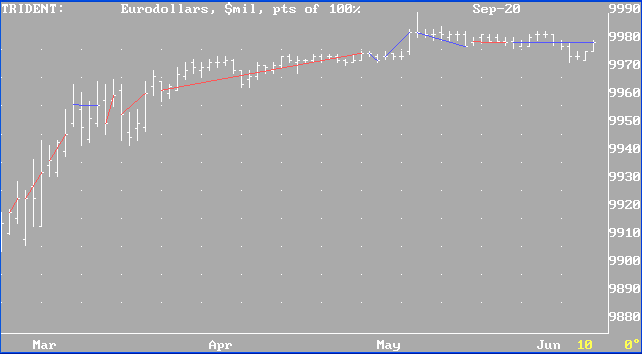
Our worst-performing internal program is "Trident" (meaning do the opposite of what it says). It is giving a buy signal so sell it..
Results of "Trident" for Eurodollars (blue lines = successful trades, red, unsuccessful):
(Always in the market.)
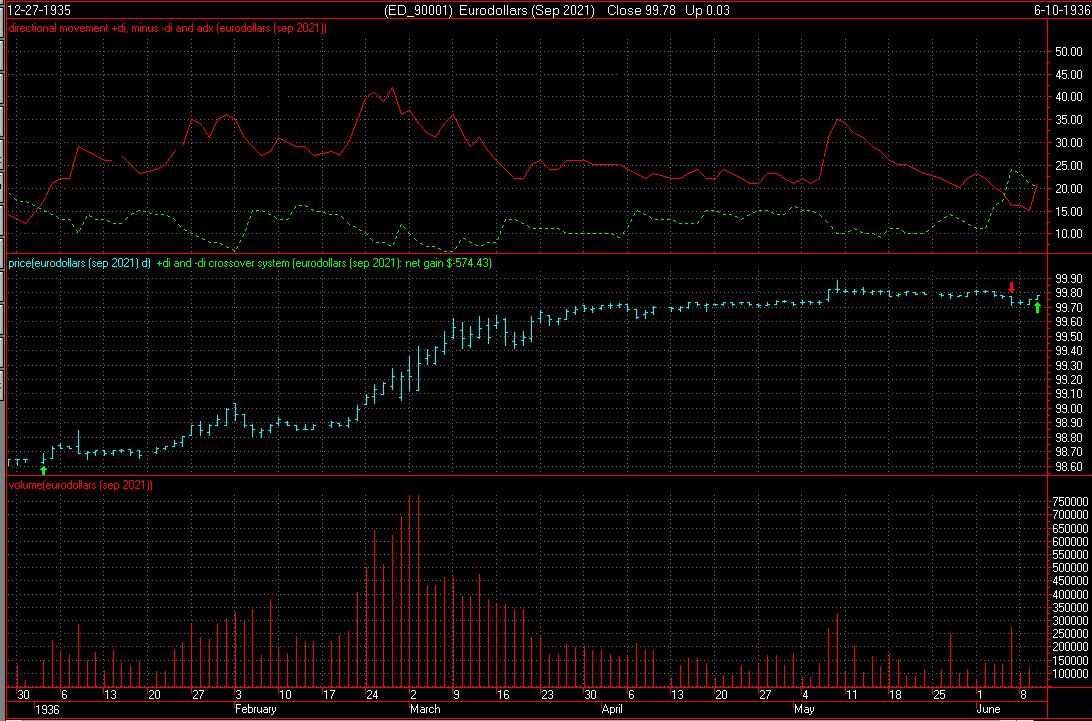
Our third system has just triggered a byy signal. (Note, disregard the year on the chart. Our regular readers know this is not a Y2K-compliant system, but it still works.)
The point value is $2,500. Initial margin on a single contract is $396. Use of options is not advised.
Scale trade sellers are entering the market for the long term in this price range.
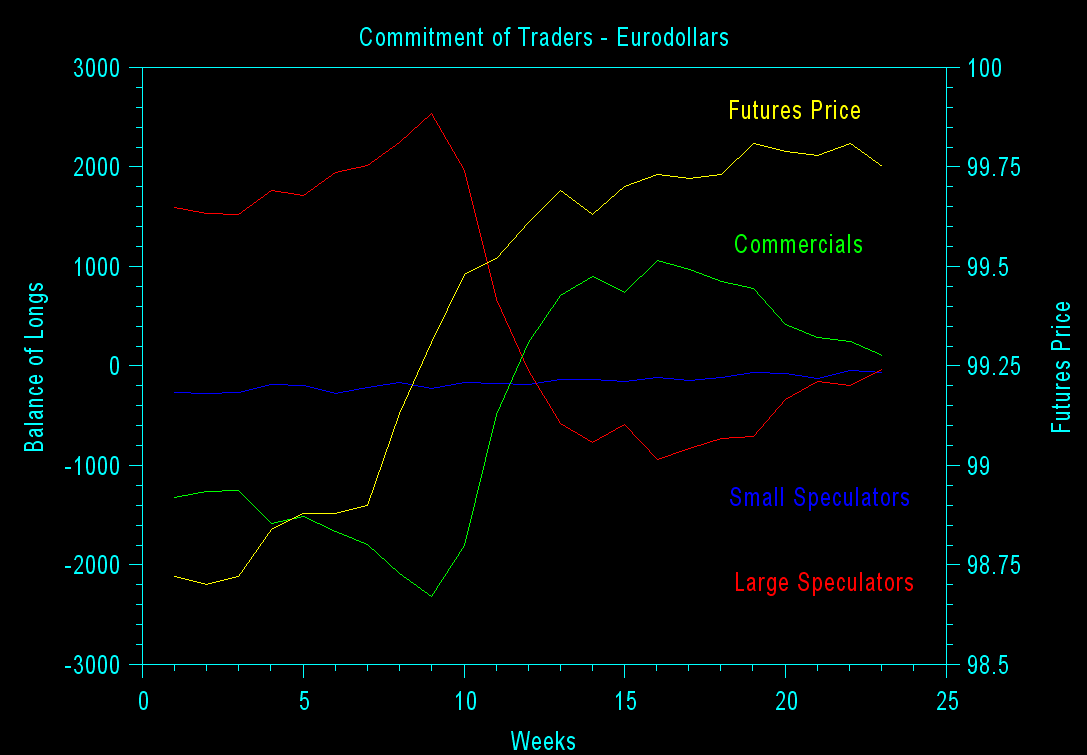
In the chart below, the yellow line is the futures price, read on the right axis. All other colors are read on the left axis. Blue is small speculators. Red is large speculators. Green is commercials. Commercials with the best track record are getting increasingly-short.
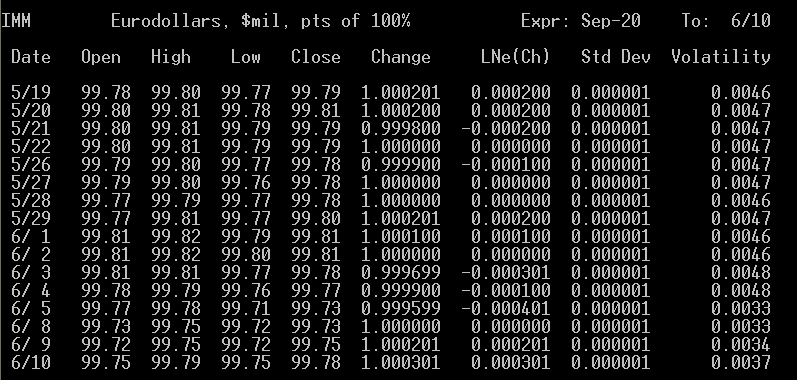
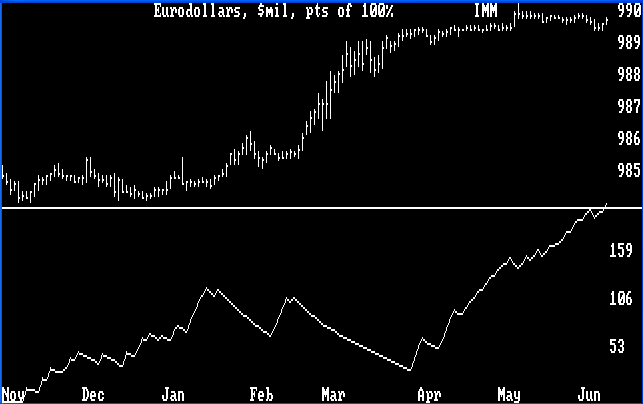
The average volatility shown below suggests that an uptrend remains intact from the last volatility low point.
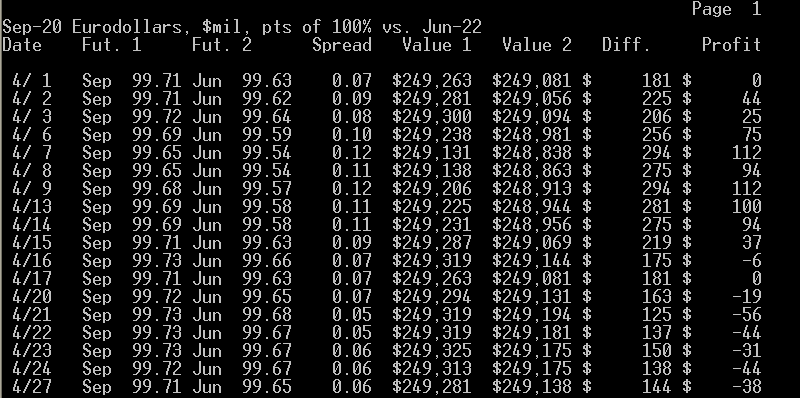
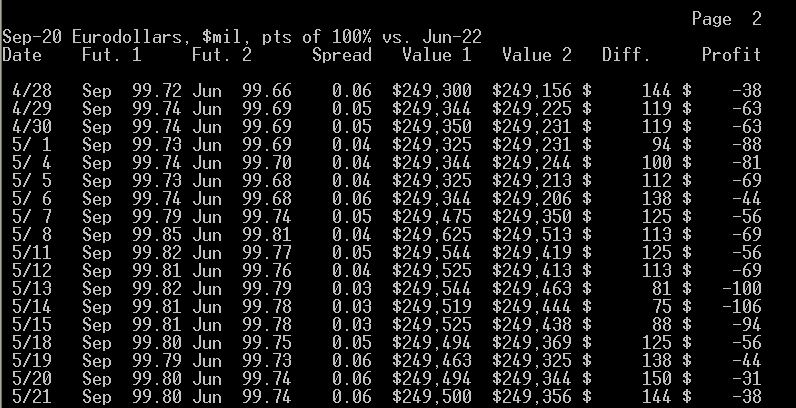
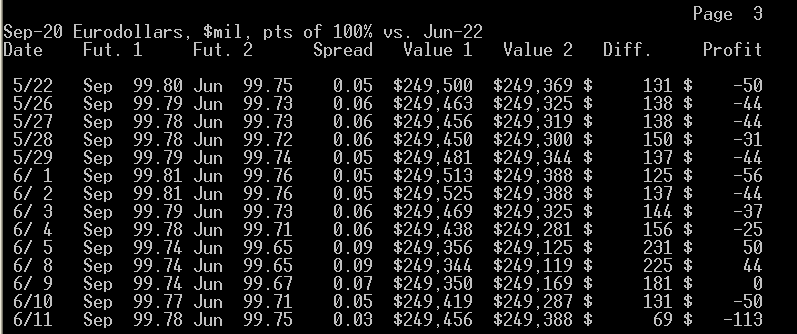
What the Sep. '21 - Jun. '22 calendar spread suggests to us is that buying the near contract and selling the far one is at most times not profitable, which we think is a sign that these futures may
go down in the long run. The best time to enter or leave the above spread is when it is at 0.03 or narrower selling the far as prices are falling and then buying the near, and exiting or entering when it is at 0.11 or wider buying the far as prices are rising and then selling the near. At this time, we appear to be at the sell the far, buy the near point, which disagrees with our ultimate recommendation.
To view the chart below correctly use Microsoft Internet Explorer.
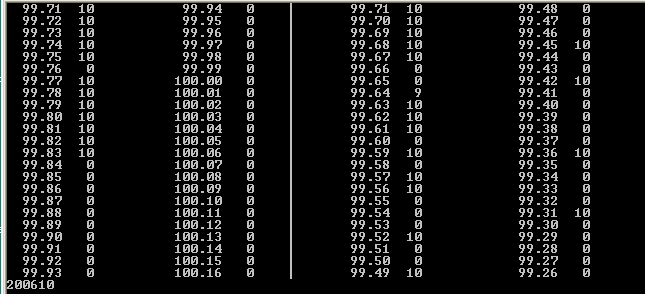
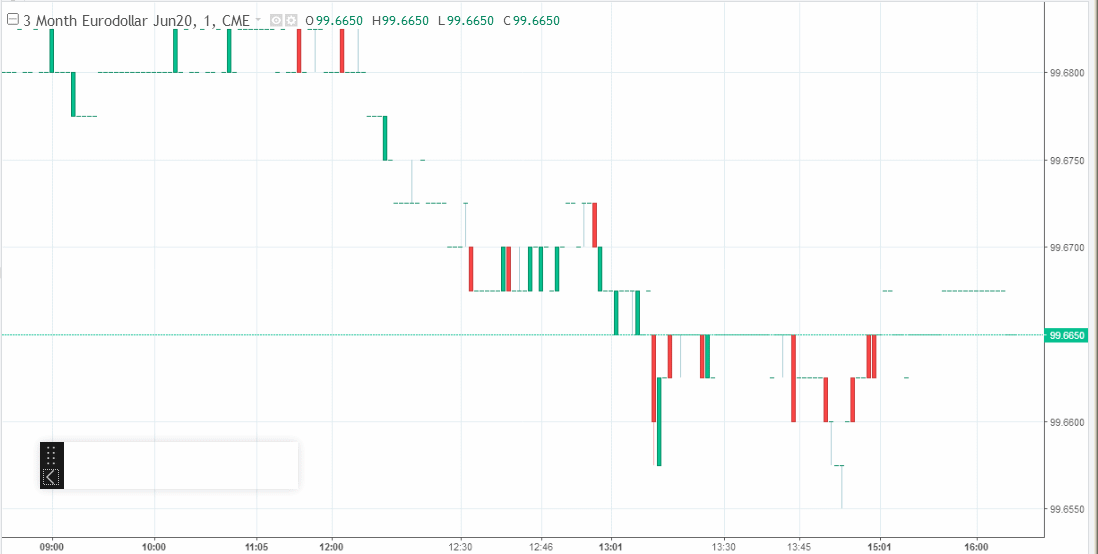
Here's an intraday chart for a previous day ( 7/11 ).
Internal Program
Third System Confirmation
Margin
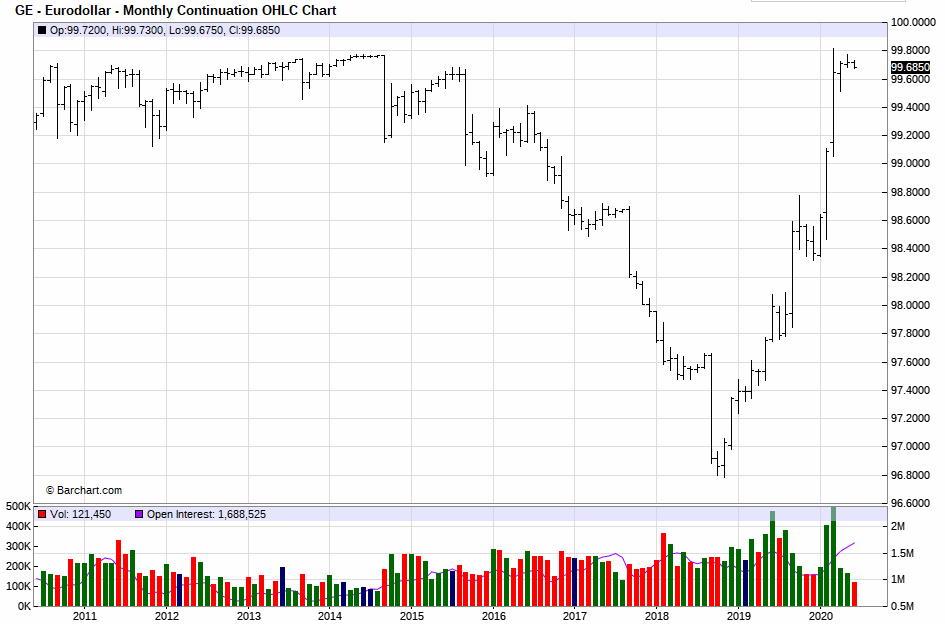
Historic Range
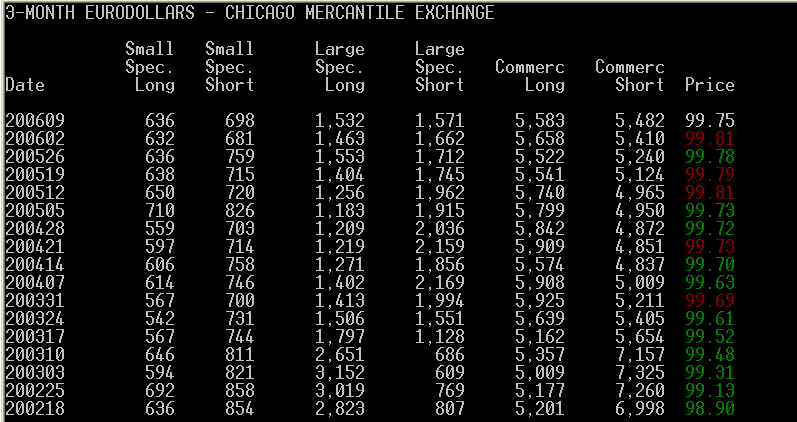
Commitment of Traders
Volatility / Probable Range

Possible Future Prices
Calendar Spread
Level Table:
100.0|                                                                  R  6/10
 IMM - Sep-20 Eurodollars, $mil, pts of 100% Cm.=0.01  Lim.= 0.2
     |
     |
     |X
 99.8|XXYYYYYYYYYYZZZZZZZZ_____________________________________________________
     |WWWWWWXXXXXXXXZZ[[   <<<
     |VVVVVVVVWWWWX
     |UUUVVVV
     |TTTUUUUUUU
 99.5|TTTTUUUU_________________________________________________________________
     |TTTTTUUUUU
     |TTTUUUU
     |TTTT
     |TTTT
 99.3|TTTT_____________________________________________________________________
     |STTT
     |STTT
     |SSSTTT
     |SSST
 99.0|EEFFFGSST________________________________________________________________
     |DEEEEEFFFFFFFGJJJRRS
     |DDEEEEEEEFFFFFFFGGGJJJJJRRRRS
     |DDEEEEEFFGGHJJJJQRRRRRSSS
     |ABDEEFGHHHHJNNPQQQRRRRSS
 98.8|AABBDGGHHHJJKLMMNNPQRR___________________________________________________
     |AAABBBBDDGGGGHHHHHHHJJJJKKKKLLMMMMMMNNNNNPPPQQQ
     |AAAAABBBBCCDGGGGHHHJJJJJKKKKKKLLLLLMMMMNNNNNNNNOPPPPPPQQQQ
     |AAAAABBCCCCCCCDDDGGGKKKLLLLLNNOOOOOOPPPPQ
     |AAAAAABBCCCCCCDDDDDDGLLLLLNNOOOOOOOO
 98.5|ABCDD____________________________________________________________________
     |D
     |D
     |
     |
 98.3|-A-B-C-D-E-F-G-H-J-K-L-M-N-O-P-Q-R-S-T-U-V-W-X-Y-Z----|----|-- TPO= 0.310
                       1 1 1 1 1 1 1
       6 6 7 7 8 8 9 9 0 0 1 1 2 2 2 1 1 2 2 3 3 4 4 5 5 6           6
       1 2 1 2 0 2 0 1 0 1 0 1 0 1 3 1 3 1 2 1 2 1 2 1 2 0           1
       2 5 0 4 7 1 5 9 3 8 1 5 2 6 1 5 0 3 8 3 7 3 7 1 6 9           0
Other Factors
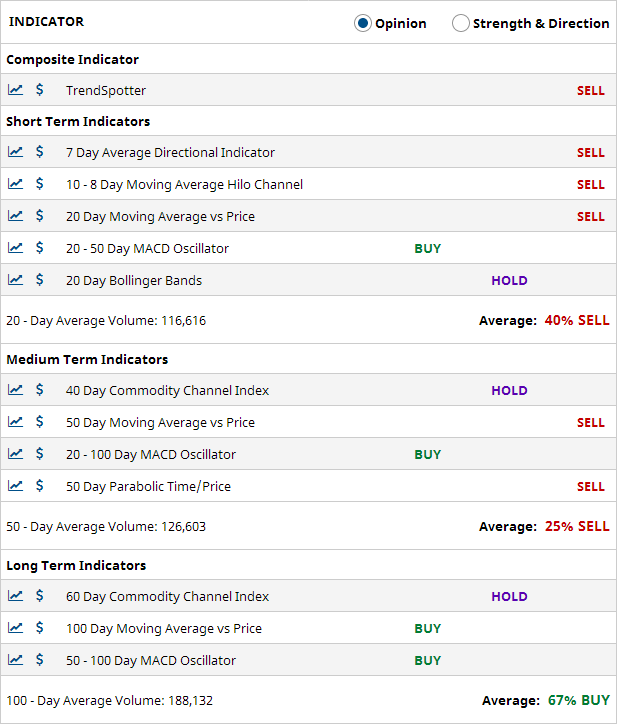
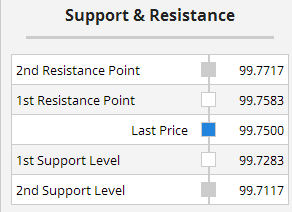
                 Risk Versus Opportunity Report
                ________________________________

                  EDU1    September '21 Eurodollars

                      High Price:  99.85
                   Current Price:  99.79
                       Low Price:  99.68

                            Risk: -0.001
                     Opportunity: -0.002

                    (O/R) Ratio =  1.833