![]()
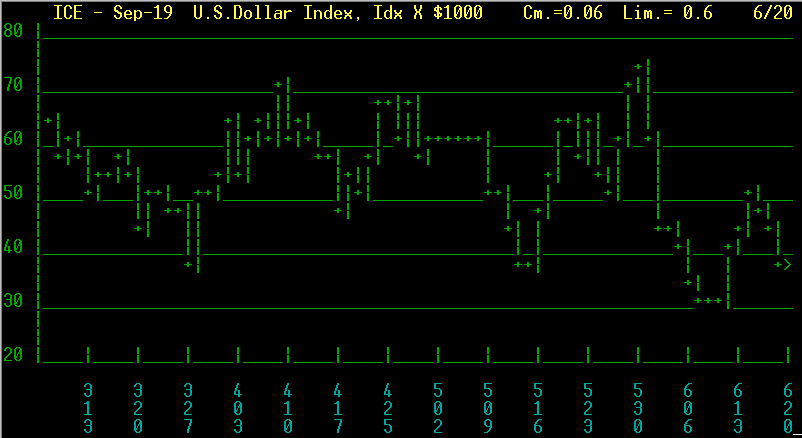
Introduction Nirvana Internal Progrm Historic Range06-23-2019: September U.S. Dollar Index: Potential Interest Rate Cuts Loom
(Click on links below. Whole page needs to load before links work.)
Intermarket
Parabolic
News
Point & Figure
Cyclic/Seasonal
Third System
Margin
Commitment
Volatility
We fed the U.S. Dollar, Canadian Dollar, and Mexican Peso into a neural network to get the following result:
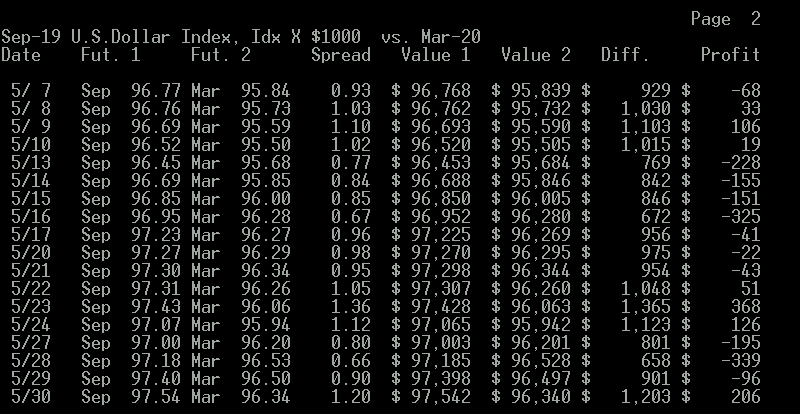
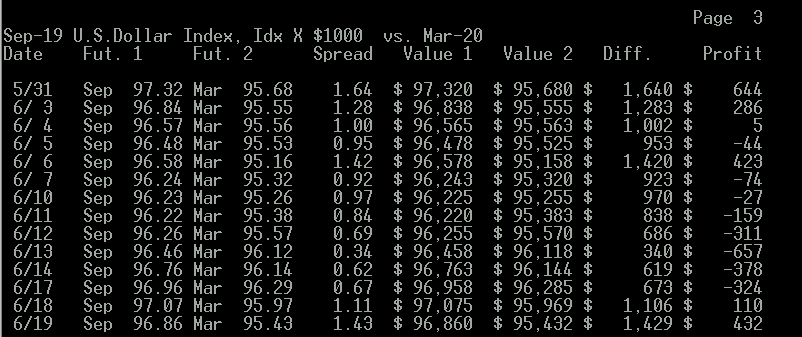
September U.S. Dollar Index:
September U.S. Dollar Index:
A return to broad-based global optimism has caused a shift away from the Dollar being a currency supported by expansion of economic uncertainty and safe-haven. Insrtead, lack of support is stoked by the potential market projections of an aggressive rate cut action. Good news on the labor front would be insufficient to cushion the Dollar against these other considerations.
China most likely is considering expanding the role of the yuan globally to challenge the U.S. Dollar's dominance in international transactions. The U.S. Dollar is currently considered the reserve currency of the world, but a genuine long-term alternative to the U.S. currency could change that. China would have to avoid devaluing the yuan in order to achieve this. As Chinese assets are increasingly traded in global markets, more foreigners will need to trade in the yuan, which is the intent of the internationalization drive.
China's ultimate weapon would be to sell U.S. bonds, but that would hurt Chinese investments more than it would help them. China is the largest holder of U.S. debt, roughly $1.12 trillion in U.S. Treasury bonds.
The current U.S. Administration short-sightedly has accused Beijing of deliberately weakening the yuan to encourage foreign exports, but a weak yuan reduces investor confidence in it. China has an advantage in that presently domestic consumption there makes up only 40% of the country's GDP, leaving it room to expand. In the U.S., domestic consumption makes up 70% of the GDP, leaving less room to expand.
Dovish Federal Reserve meetings have led toi significant gains in the Swiss Franc against the U.S. Dollar. Lower U.S. Dollar yields plus MIddle East tensions are both very favorable to the Swiss Franc exchange rate. The Mexican Peso has also benefitted from the dovish meetings. The Bank of Mexico's governing board has a policy stance that is relative to the U.S. in a way that is closely followed by the Mexican board. The Mexican Board has a more hawkish stance.
A U.S. interest rate cut rumor is also pushing equities higher in the U.S. That market is an option other than trading in currencies.
Looser monetary policies from major central banks around the world help relieve pressures on emerging markets, but the U.S. trade war risks with China far outweigh these considerations. Turkey, Russia, and South Africa are among those to benefit from a stampede to higher-yielding assets in recent days as the U.S. and Europe boith hint of ionterest rate cuts. Russian and South African exchange rates hit their highest levels since August, 2018.
As the head of the European Central Bank, Mario Draghi, introiduces more stimulus measures, the euro has begun to drop against other currencies. Speaking in Portugal, Mr. Draghi said if the eurozone inflation did not return to its target of close to but below 2%, additional stimulus would be required. They would include more asset purchases by the bank or a cut in interest rates.
Latest job figures in the U.S. have encouraged traders to expect a rate cut.
The Pound continues to slip against the U.S. Dollar ahead of continuing votes by members of parilament on Brexit options. There is some focus on New Zealand in international currencies as its central bank signalled it may cut interest rates again.
Some ask given our status as the world's greatest debtor nation thanks to the Republicans, what is holding up the value of the U.S. Dollar at all? Why are people still pricing oil in dollars rather than moving to a currency issued by a more solvent country including the yien, yuan, or euro? The answer is that the U.S. economy is still the largest and most resilient in the woirld. The GDP's for the U.S. and Europe are roughly the same. China's GDP is about two thirds of this. But it is growing more rapidly than either the U.S. or Europe. Rapid growth in China may not be sustainable.
It has become harder to walk away from a mortgage in the U.S., and an end to the housing boom could set off another drop in U.S. housing prices. Lenders continue to be fairly easy with terms in order to entice people into loans. We may be seeing the beginning oif leveling off or falling housing prices now.
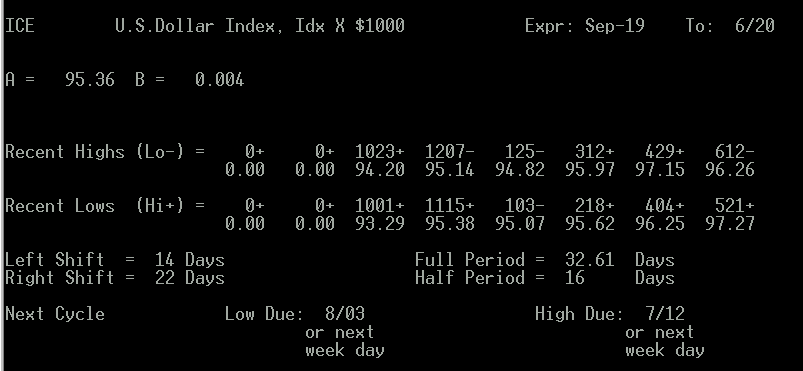
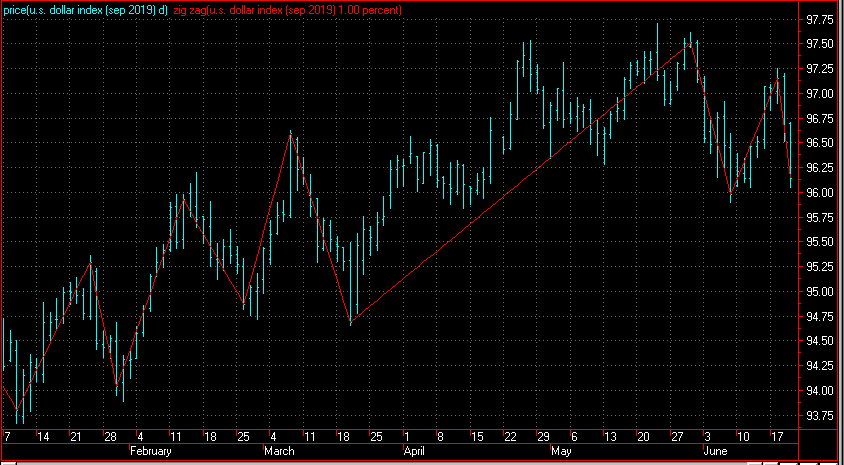
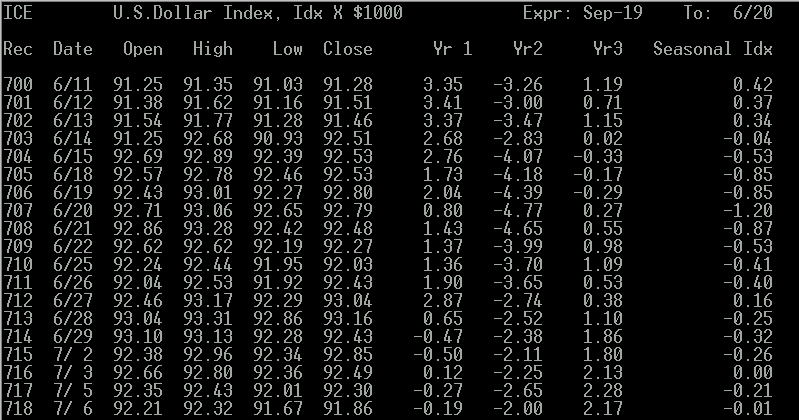
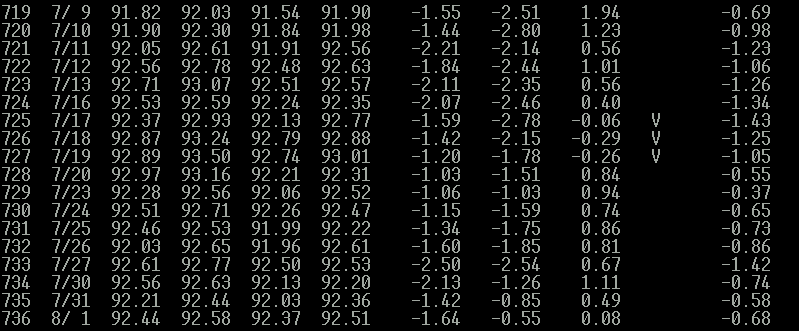
We are headed toward a cyclical high and a weak seasonal down period.
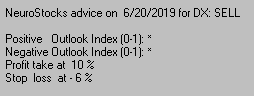
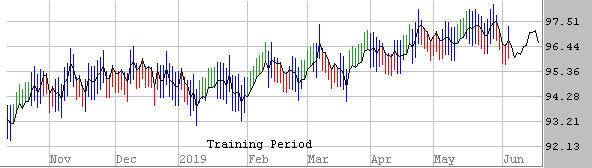
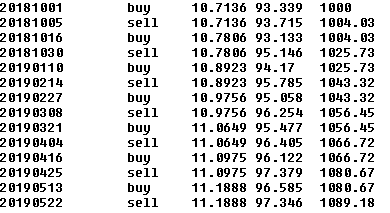
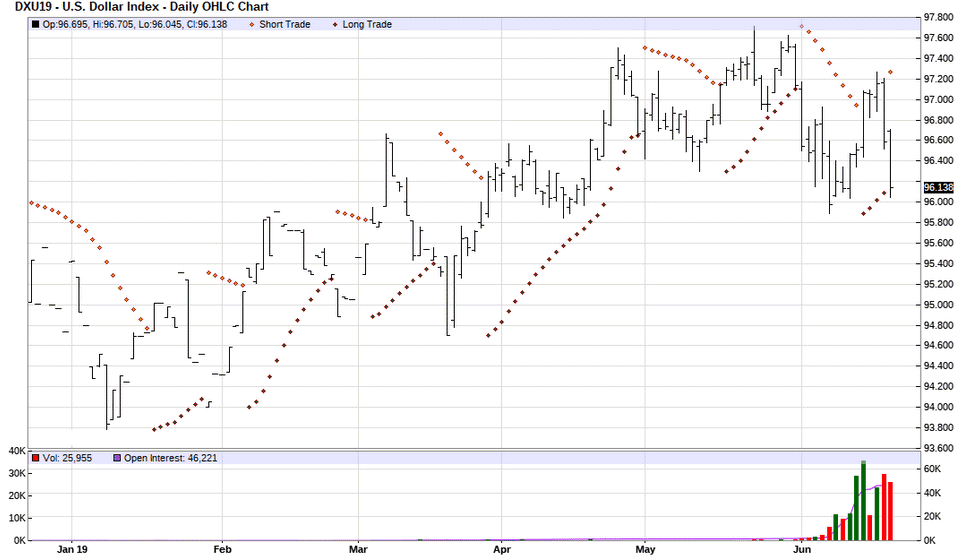
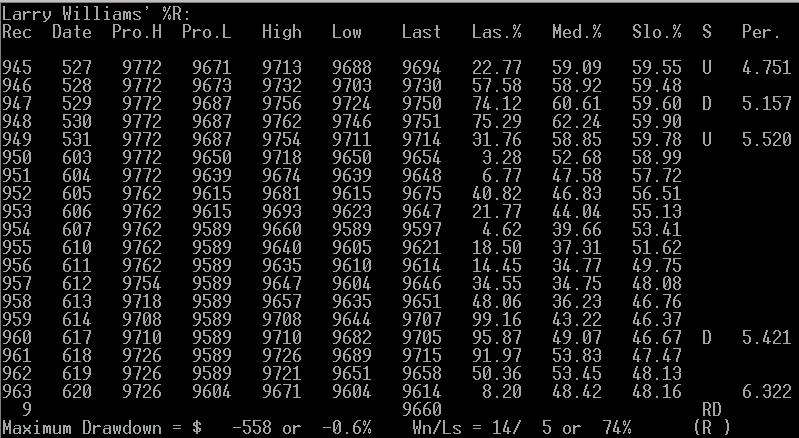
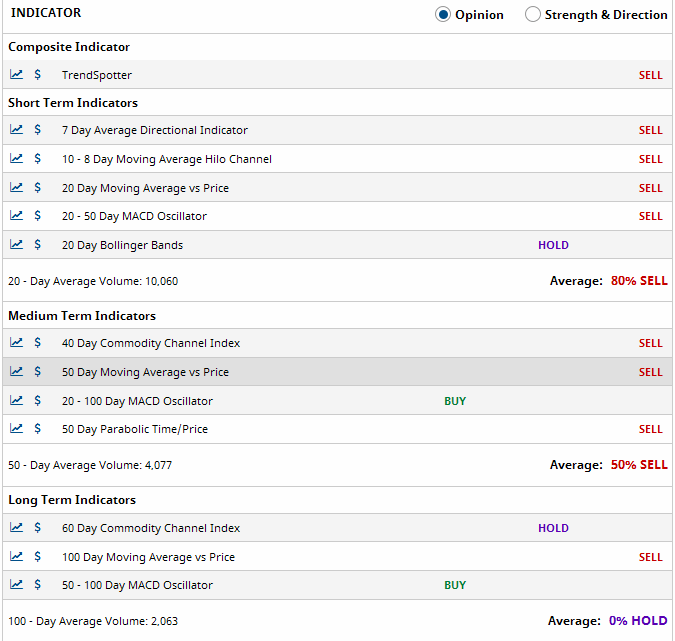
Our best-performing internal program is "%R". It is giving a sell signal.
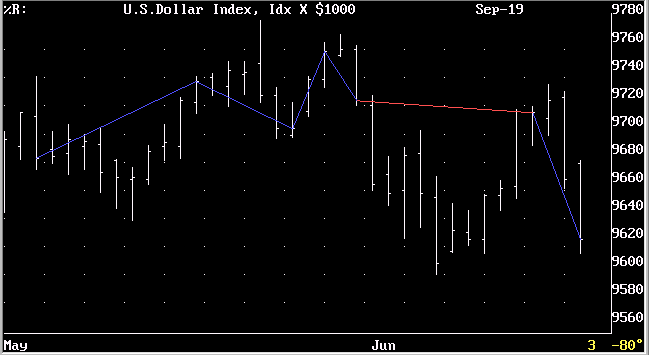
Results of "%R" for U.S. Dollar Index (blue lines = successful trades, red, unsuccessful):
(Always in the market.)
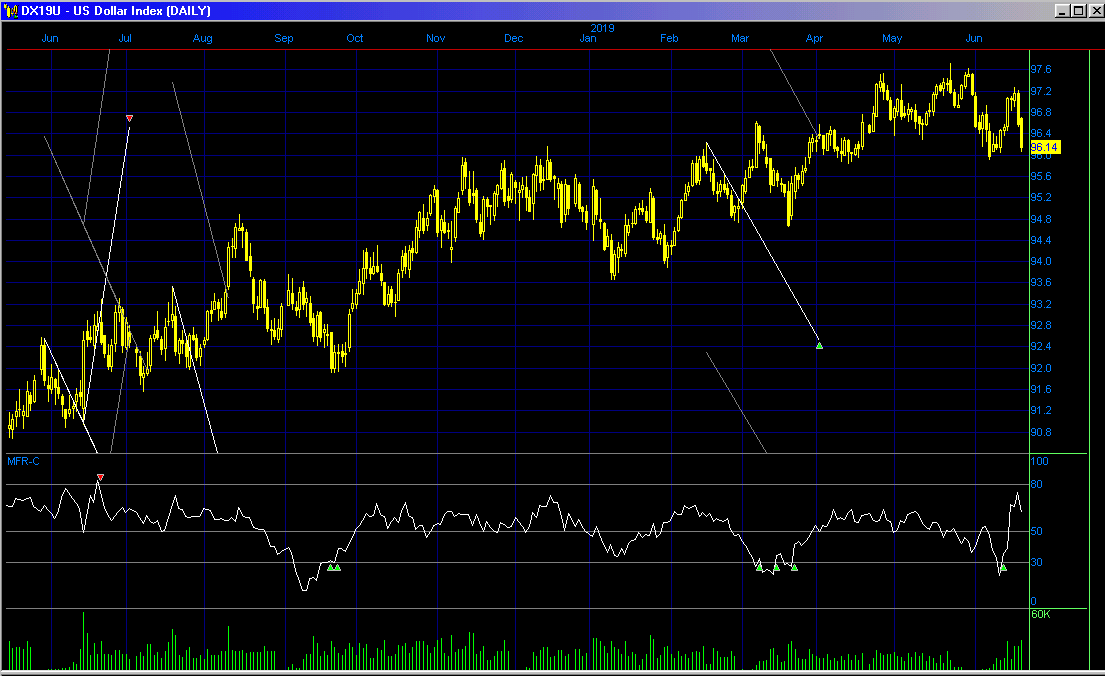
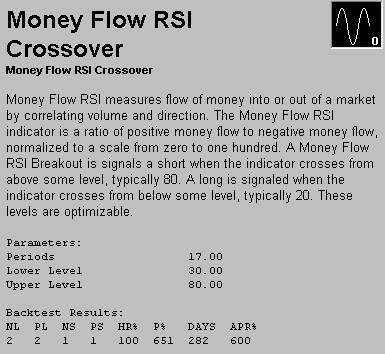
Our third system has triggered a buy signal. (Note, disregard the year on the chart. Our regular readers know this is not a Y2K-compliant system, but it still works.)
The point value is $1,000. Initial margin on a single contract is $1,815. Use of options is advised.
Scale trade sellers are entering the market for the long term in this price range.
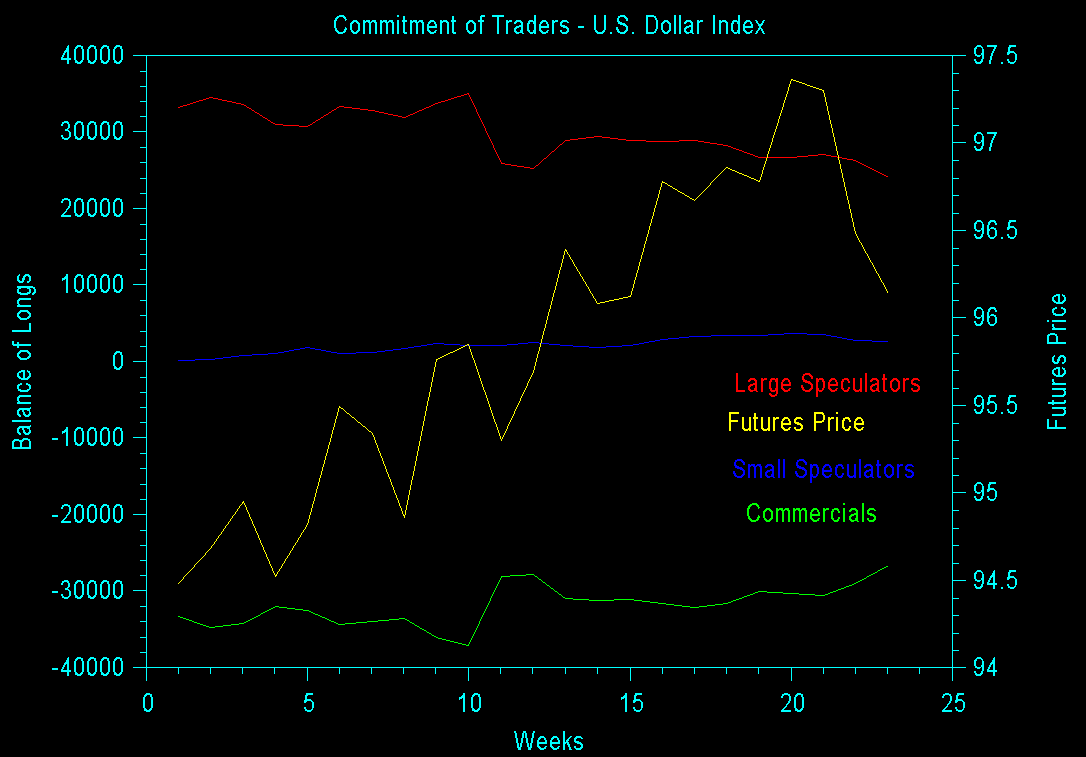
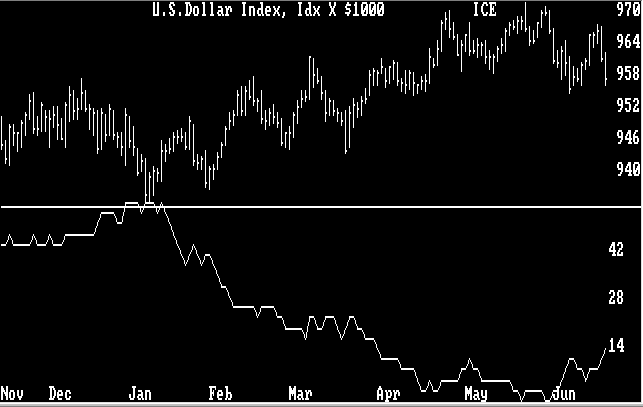
In the chart below, the yellow line is the futures price, read on the right axis. All other colors are read on the left axis. Blue is small speculators. Red is large speculators. Green is commercials. Large speculators with the best track record are getting increasingly-short.
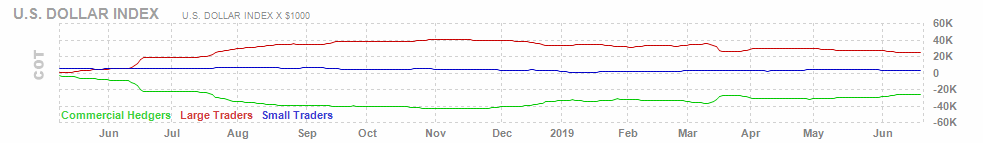
Interpretation of a Different Site Below (Their trader categories vary from ours):
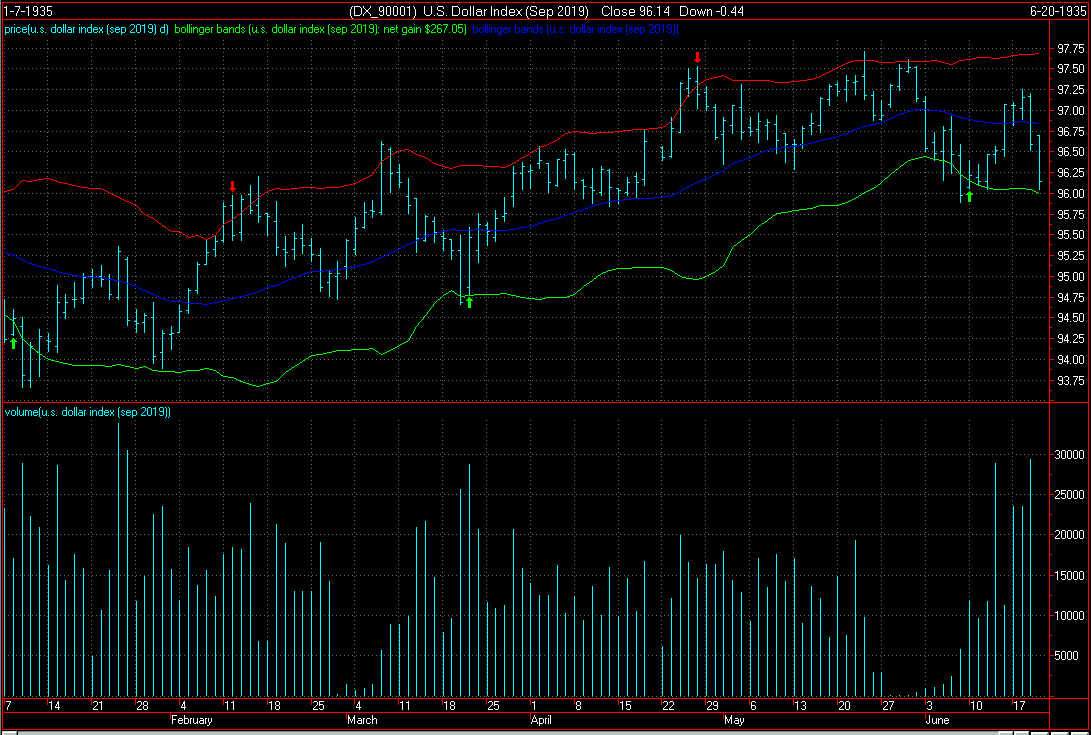
The average volatility shown below suggests that a change in major trend to down is imminent near a volatility low point.
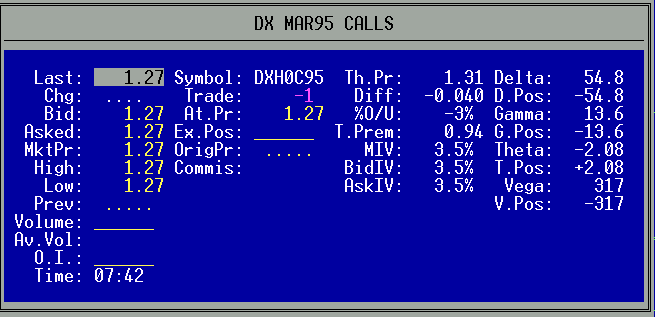
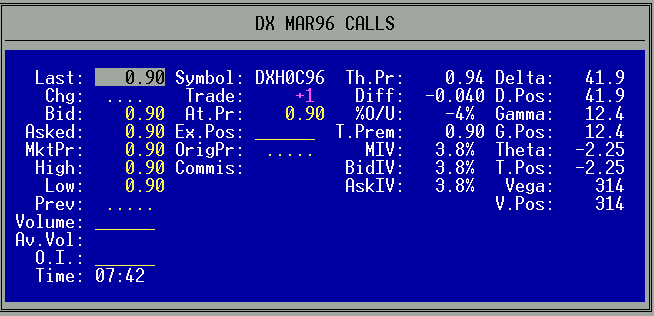
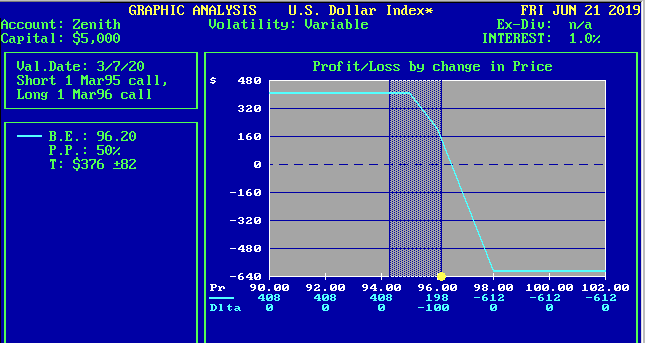
Our option trade recommendation is to Buy (1) U.S. Dollar Index March 96 Call and Sell (1) U.S. Dollar Index March 95 Call @ 0.37 to the sell side or greater.
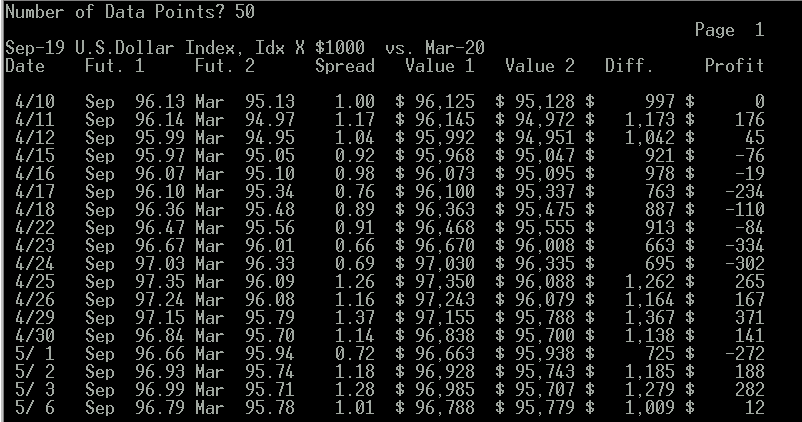
What the Jan. - Jul. calendar spread suggests to us is that buying the near contract and selling the far one is at most times profitable, which we think is a sign that these futures may go flat in the long run. The best time to enter or leave the above spread is when it is at 0.27 or narrower selling the far as prices are falling and then buying the near, and exiting or entering when it is at 1.37 or wider buying the far as prices are rising and then selling the near. At this time, we appear to be headed toward the buy the far, sell the near point.
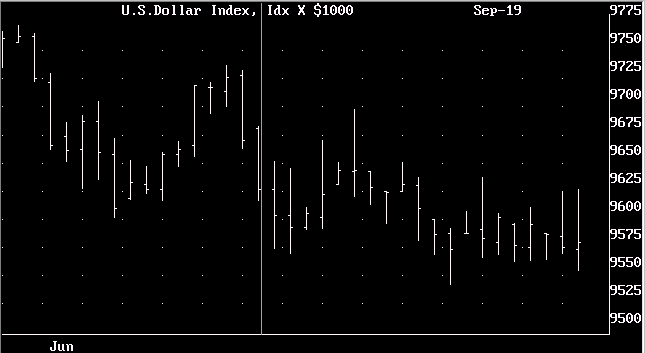
Here's an intraday chart for a previous day ( 7/11 ).
Introduction
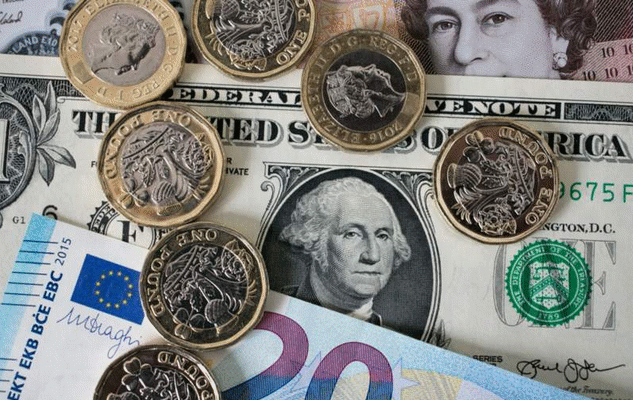
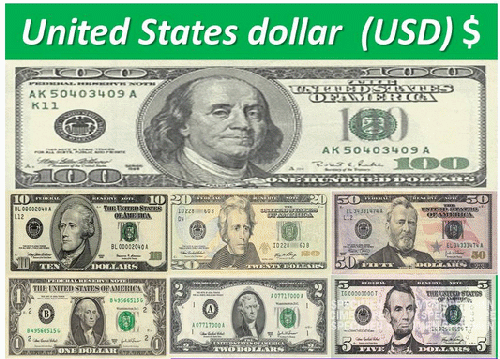
The key to current U.S. Dollar weakness appears to be continual chat and rumors encouraged by the Federal Reserve that it is about to reverse the longstanding policy of letting interest rate tightening and loosening cycles spread out over years. Instead, a brief series of increases may be followed by rate cuts prompted by political concerns rather than what is good for the economy and preventing further inflation rise. Republicans are so polarized and obstructive that even though it was approved long ago by the previous administration, they and Mnuchin don't want Harriet Tubman to replace Andrew Jackson onthe $20 bill. Maybe in 10 more years?
Intermarket Analysis

Parabolic Chart
Nirvana Chart
News Analysis
Point & Figure Chart
107.5|                                                                  T  6/20
     | ICE - Sep-19 U.S.Dollar Index, Idx X $1000  Cm.=0.06  Lim.= 0.6
     |
     |
     |
105.0|_________________________________________________________________________
     |                  X
     |                  XO
     |                  XO
     |                  XOX
102.5|________________X_XOXO___________________________________________________
     |                XOXOXOX
     |    X           XOXOXOXO
     |    XO          XO O OXO
     |    XOX         X    O O
100.0|____XOXO______X_X______O_________________________________________________
     |    XOXOX     XOX      O
     |    XO OXO    XOX      O
     |    X  OXO  X XOX      O
     |X   X  OXO  XOXOX      O
 97.5|XOX_X__OXO__XOXO_______O_________________________________________________
     |XOXOX  O O  XOX        O        X
     |XOXOX    OX XOX        O        X
     |XO OX    OXOXOX        OX       X
     |X  O     OXOXO         OXO    X X
 95.0|X________OXOX__________OXO____XOX________________________________________
     |         OXO           OXO    XOX
     |         OX            OXO  X XO
     |         O             OXO  XOX
     |                       O O  XOX
 92.5|_________________________O__XOX__________________________________________
     |                         OX XO
     |                         OX X
     |                         OX X
     |                         O  X
 90.0|____________________________X____________________________________________
     |                            X
     |                            X
     |                            X
     |                            X
 87.5|____________________________X____________________________________________
     |                            X
     |                            X
     |                           O
     |
 85.0|----|----|----|----|----|----|----|----|----|----|----|----|----|----|---
         111         1111      1    1
      899002122356678112212344912238012
      212120002100223000001102220102001
      572423532098491398955754748518394
The above chart is giving a conventional buy signal.
Cyclical and Seasonal Factors
Internal Program
Third System Confirmation
Margin
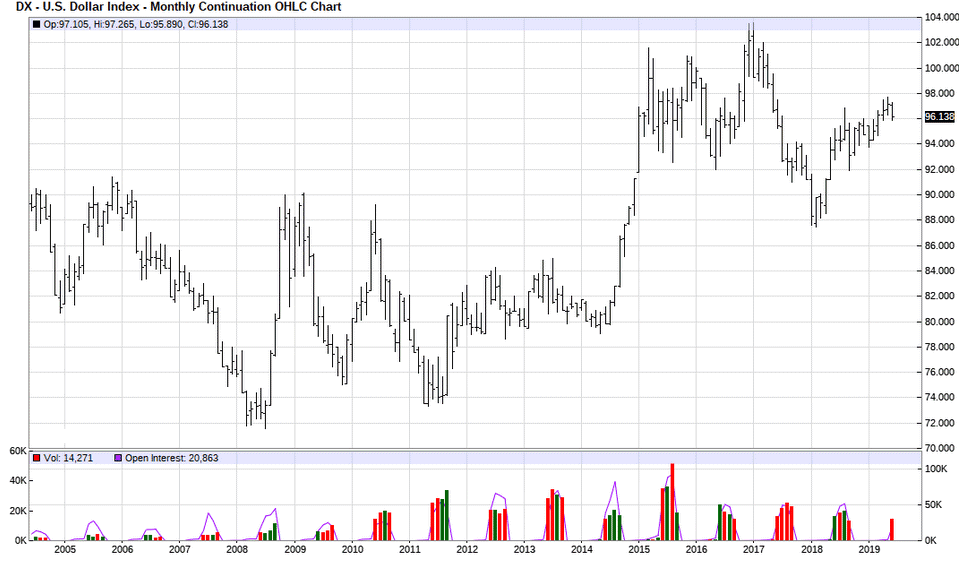
Historic Range
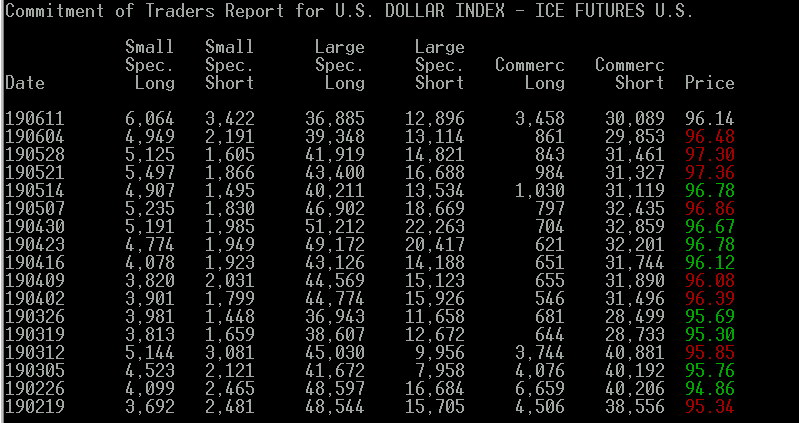
Commitment of Traders
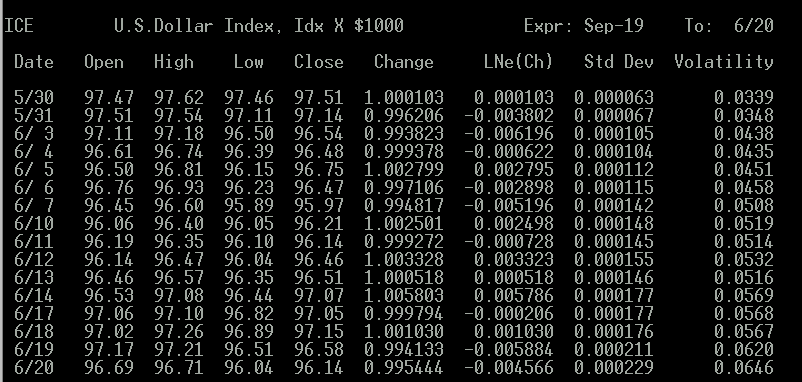
Volatility / Probable Range
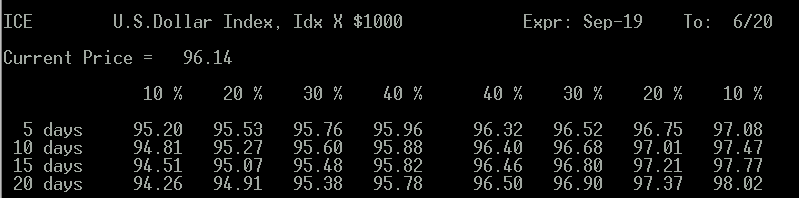
Possible Future Prices
Option Recommendation
Calendar Spread
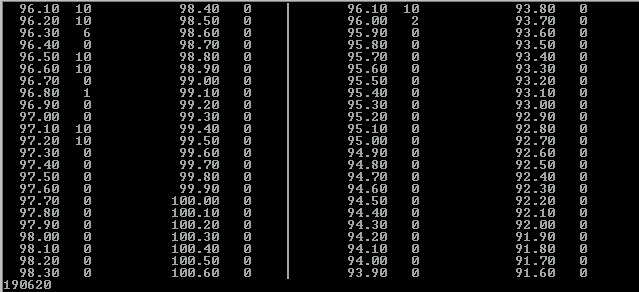
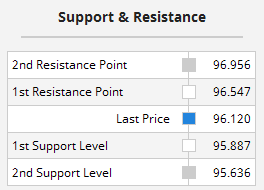
Level Table:
 98.0|                                                                  R  6/20
 ICE - Sep-19 U.S.Dollar Index, Idx X $1000  Cm.=0.06  Lim.= 0.6
     |
     |YY
     |WWXYYYY
 97.0|WWWWWXXXYYYYYZ[__________________________________________________________
     |WWWWWXYYYZZZ[
     |VWWWWWWWXXXXXYZZZ[
     |SVVWXXXXYYZZZZ[[
     |SSUUUUVVWXXYZZZZZZ[
 96.0|RSSSUUUUUUUVVVVVVZZZZZ[__________________________________________________
     |NRRSTUUVVVVVVVZ   <<<
     |KKLLMMNNQRRRRRSSSTTUU
     |KKKKLLMMMMMMNNNNQRRRRRSSTTTTTU
     |JKKKKLLLMMMMMMMMMNNNNNNNOQQQRRRRRSSTTTTTTTT
 95.0|JJJKKKLLLLLLLMMMMMMMNNNNNNNOOPPQRRRSSTTTT________________________________
     |JJJKKLLLLLLMMMMNNNNNNOOOOPPPPPPQSSSSTT
     |DJJJJKKKLLLLLMMNNNOOOOPPPPPPQQSSTT
     |DDDDJJJJJKKKKKLLOOOOPPPPQQQ
     |DDDDJKKKLOOOOPPPQQQQ
 94.0|DDDDDGGHHJJJJKOOOOOPQQQ__________________________________________________
     |DDGGHHHHJJKOOOQQ
     |DDGGGHHHHHHJJOOO
     |DDEEEEFGGHHH
     |BCDDEEEEFFFGGGGHHHH
 93.0|ABBCCCCDDDEEEEEEEFFFFGGHHHH______________________________________________
     |AABBBBCCCCDDEEEEFFFFFFGH
     |AAABBBBBCEEEEEFFFFFFG
     |AAAABBBBBCCCCEEEEFFFFFFG
     |AAAAABBBBBBCCCCFFFGGGGG
 92.0|AAAABBBCCCFGGGG__________________________________________________________
     |AAAABCFGG
     |AA
     |A
     |
 91.0|-A-B-C-D-E-F-G-H-J-K-L-M-N-O-P-Q-R-S-T-U-V-W-X-Y-Z----|----|-- TPO= 0.349
                     1 1 1 1 1 1 1
       6 7 7 8 8 9 9 0 0 1 1 1 2 2 1 1 2 2 3 3 4 4 5 5 6 6           6
       2 1 2 0 2 0 2 0 1 0 1 3 1 3 1 2 1 2 1 2 0 2 0 2 0 1           2
       8 2 6 9 3 7 1 5 9 2 6 0 4 1 5 9 2 6 2 6 9 4 8 2 5 9           0
Other Factors
                 Risk Versus Opportunity Report
                ________________________________

               DXU9    September U.S. Dollar Index

                      High Price:  97.08
                   Current Price:  96.14
                       Low Price:  94.26

                            Risk: -0.020
                     Opportunity: -0.039

                    (O/R) Ratio =  2.000