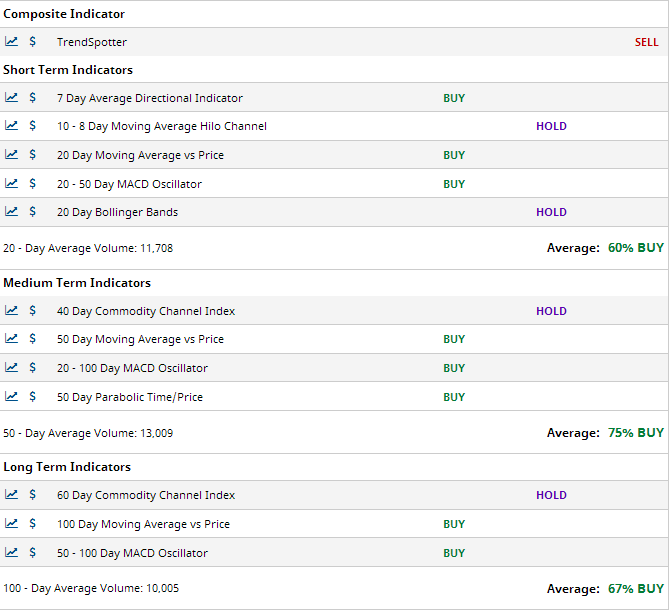
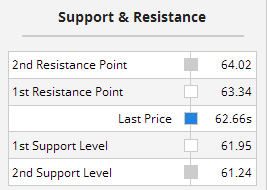
![]()
Introduction Nirvana Internal Progrm
The current state of cotton price movement seems dominated by somthing called a "weather premium" as violent or extreme weather prospects seem to be increasing affecting production.
We fed Cotton, Soybeans, and the U.S. Dollar Index into a neural network to get the following result:
December Cotton:
08-07-2020: December Cotton: Farmers May Suffer from Pandemic and Weather Events, but Exports and Prices are Rising
(Click on links below. Whole page needs to load before links work.)
Intermarket
Parabolic
News
Point & Figure
Cyclic/Seasonal
Third System
Margin
 ;
;
Introduction
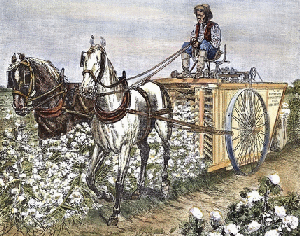 The pandemic can't keep consumers out of department stores forever. People need to buy clothes, and demand has been pent up by lack of easy access to some stores. Import/exports of cotton are increasing globally, demand still seems a little soft due to merchandising, weather related events favor higher cotton prices. The news is very mixed, and so cotton prices may remain very "flat" right around where they are now. But that translates to relatively low risk trading, and the edge seems recently to favor the bull camp. Cotton may soon see additional uses beside clothing.
Intermarket Analysis


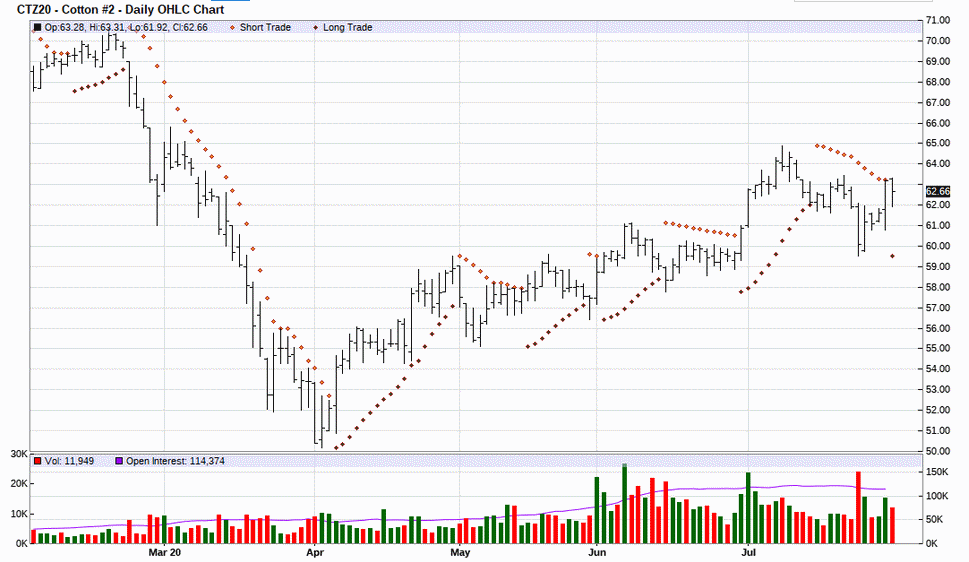
Parabolic Chart
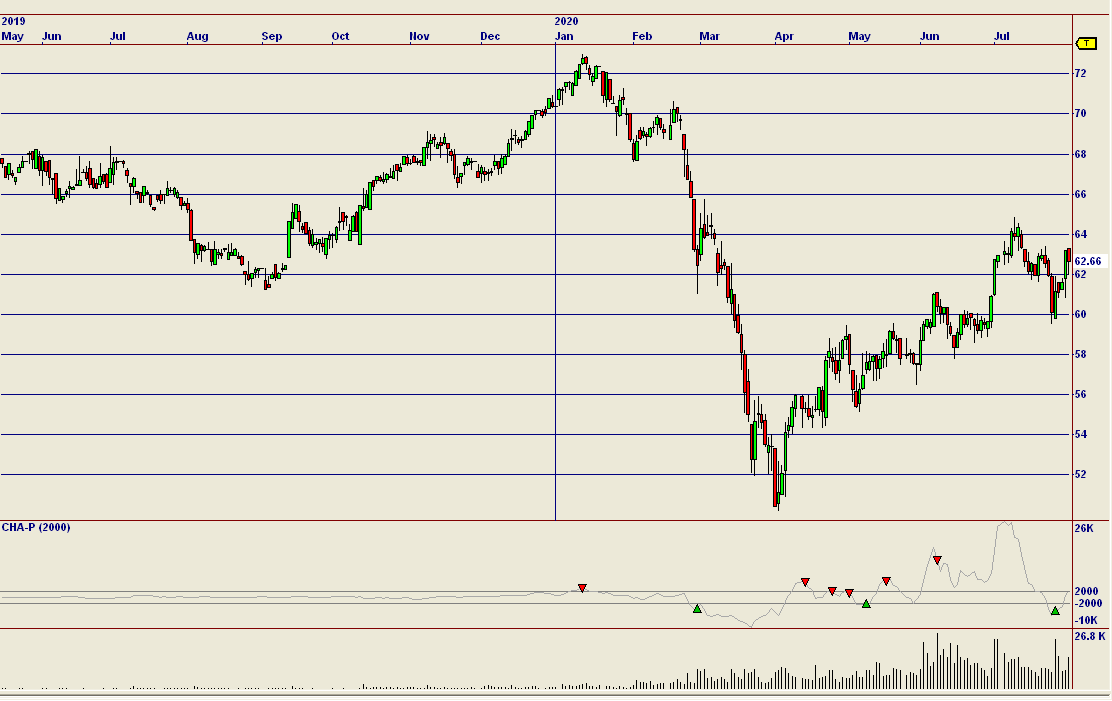
December Cotton:
Nirvana Chart
Unfavorable weather in Texas and a weaker U.S. Dollar are supportive for cotton prices. An earlier rise in cotton prices was interrupted by the dawn of coronavirus implications. U.S. crop conditions reported in Texas and Oklahoma, the largest and third-largest producing states respectively, are declining. Above normal rainfall and above normal temperatures for those two states are impacting by reducing projected crop sizes.
Cotton prices appear to be getting ready to take out July highs. Hurricane Hanna has hurt south Texas cotton producers. In fact, they took what is described as a "devastating hit" from the hurricane. In Virginia, cotton harvesting was helped by recent rain from a tropical storm.
Recent research on cotton uses has led to the development of a cottonseed without dangerous chemistry, opening up a large alternate use of cotton as a source of cattle feed. Increased use of cottonseed to feed humans is also being projected. It would be a high source of protein, but must overcome barriers currently present in standard uses.
Cotton Corporation of India is seeking to boost cotton exorts to Bangladesh and Vietnam. Several million bales may be involved. CCI sold a record 700,000 bales of cotton in one day recently. In general, cotton exports from India have been increasing due to Rupee weakness and an overseas price rise. They have hit a four-year high.
U.S. Senators Thom Tillis (Republican) and Mark Warner (Democrat) wrote a letter to McConnell and Scnumer requesting the next round of coronavirus assistance should address losses felt throughout the cotton supply chain by farmers, textile mills, and merchandisers. Billions of dollars in orders have been cancelled as a result of the virus. Cotton demand in the U.S. has collpased.
A decline of 30 cents in cotton futures prices translates to a loss of $!60 per acre of cotton.
Both the pademic and a recession have cut demand for cotton products. Family farmers face an uncertain future.
Most of a recent rise in cotton prices has been due to a USDA cutting of output forecast and cotton stocks estimates beginning in July. Export sales data has been gaining for all countries. China has amassed a $1 billion glut of U.S. cotton it doesn't need according to Bloomberg. In shorter-term vision, the weather in Texas has been a main prop for recent prices.
The USDA's "World Agricultural Supply and Demand Estimates" report (WASDE) saw few changes to old and new crop balances. It added 200,000 bales of U.S. cotton exports to old crop numbers. Ending stocks for cotton were projected at 7.1 million bales. These changes were helpful to otherwise bearish ending stocks data. Of 12.2 million acres planted in the U.S. for cotton, 16% were abandoned and an average 820 pounds per acre was for the test which would translate to a 17.5 million bale crop in that particular report. One analyst suggest that with a weather premum peak, ICE futures will trade in the upper 50's to mid/upper 60's. This suggests a flat trade, but taken with other news, we think overall news is positive for prices.
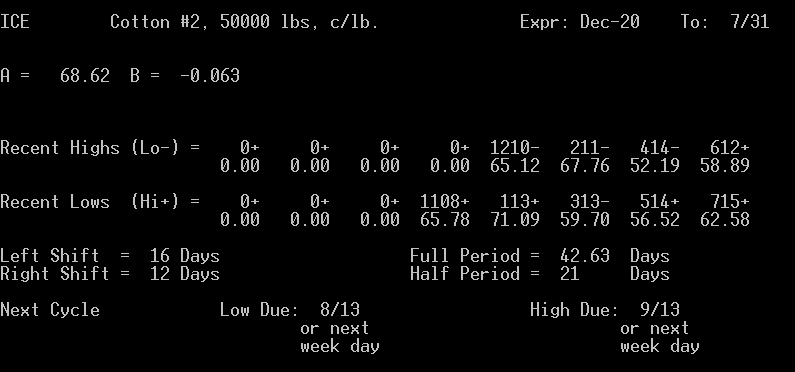
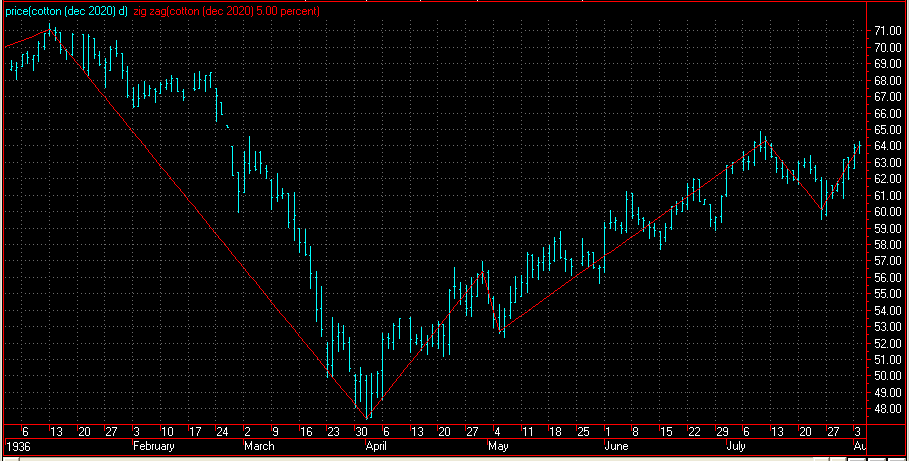
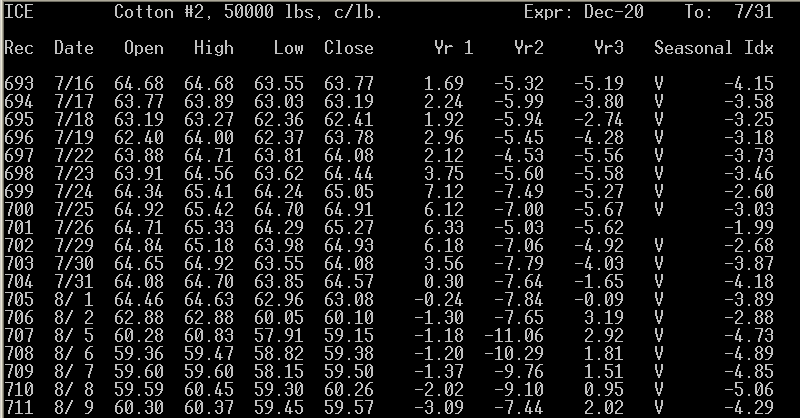
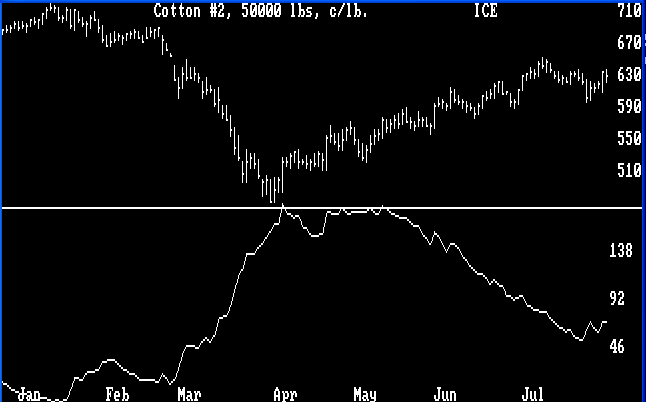
We are headed toward a cyclical low and a seasonal down period.
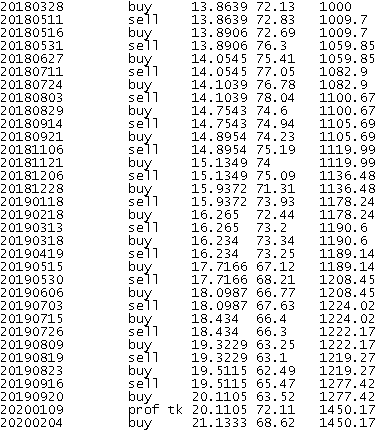
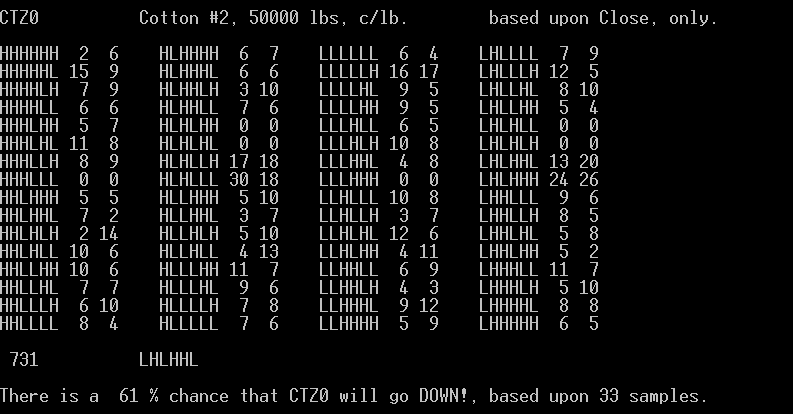
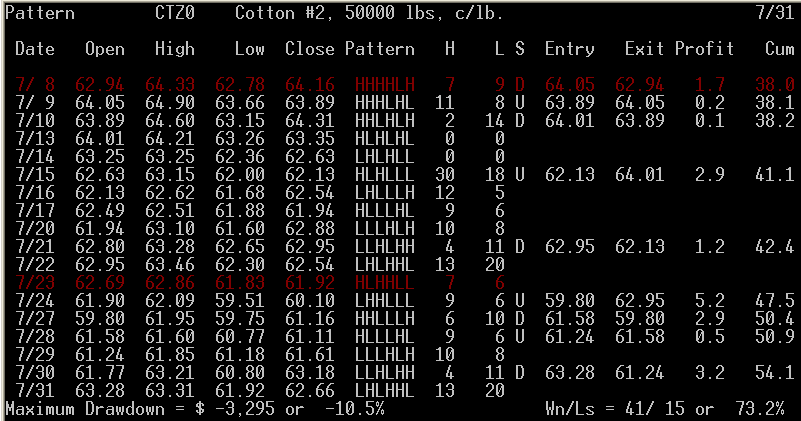
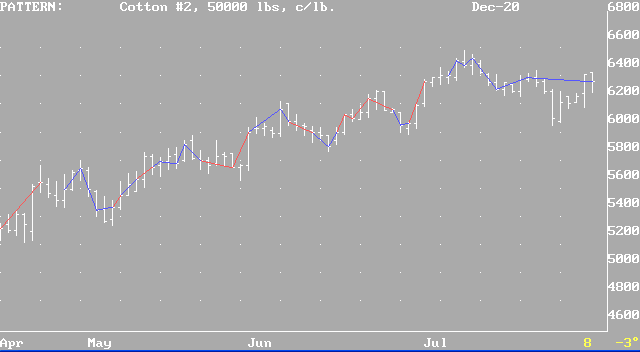
Our best-performing internal program is "Pattern". It is giving a sell signal.
Results of "Pattern" for Cotton (blue lines = successful trades, red, unsuccessful):
(Always in the market.)
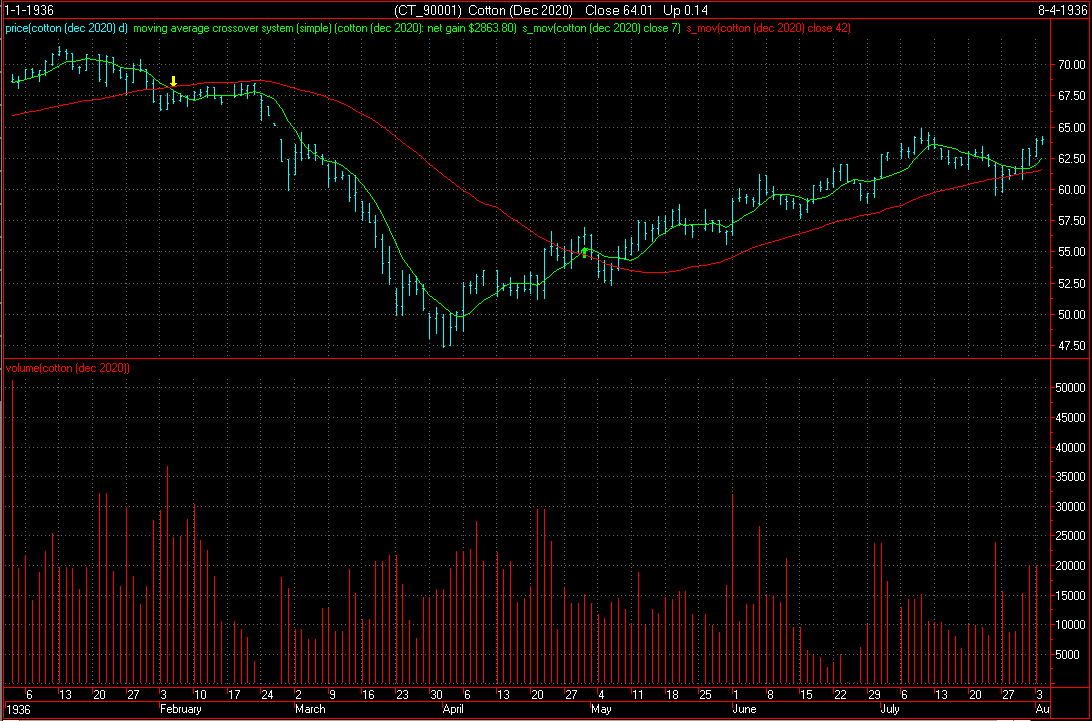
Our third system has triggered a longer-term buy signal. (Note, disregard the year on the chart. Our regular readers know this is not a Y2K-compliant system, but it still works.)
The point value is $500. Initial margin on a single contract is $2,915. Use of options is advised.
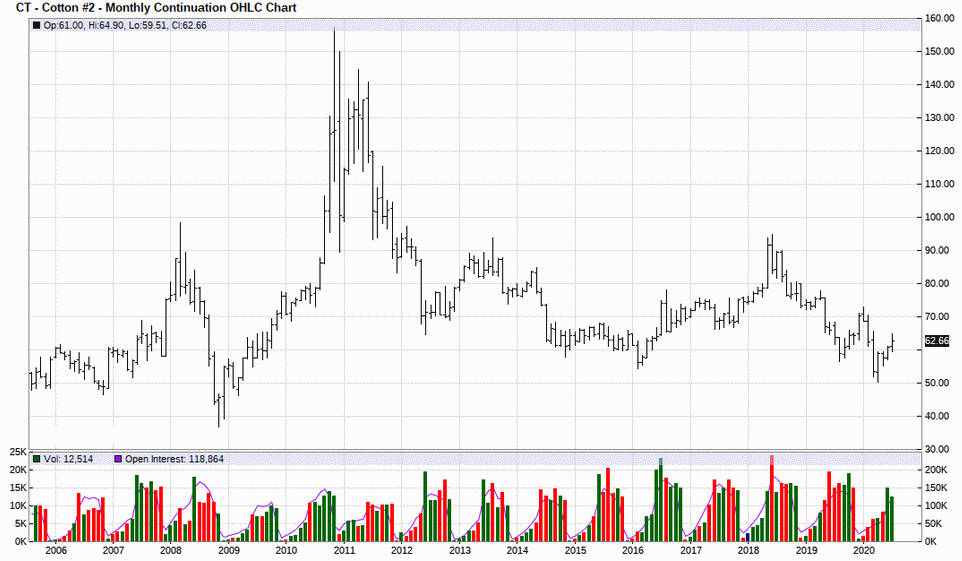
If we discount the blip in 2011, scale traders are not a factor in this price range.
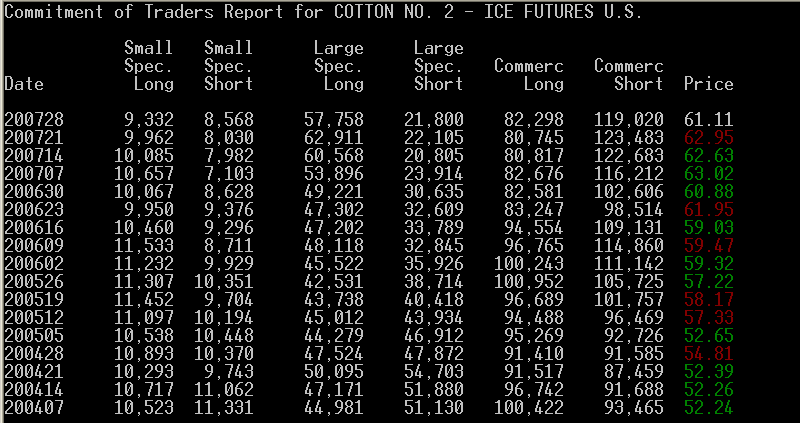
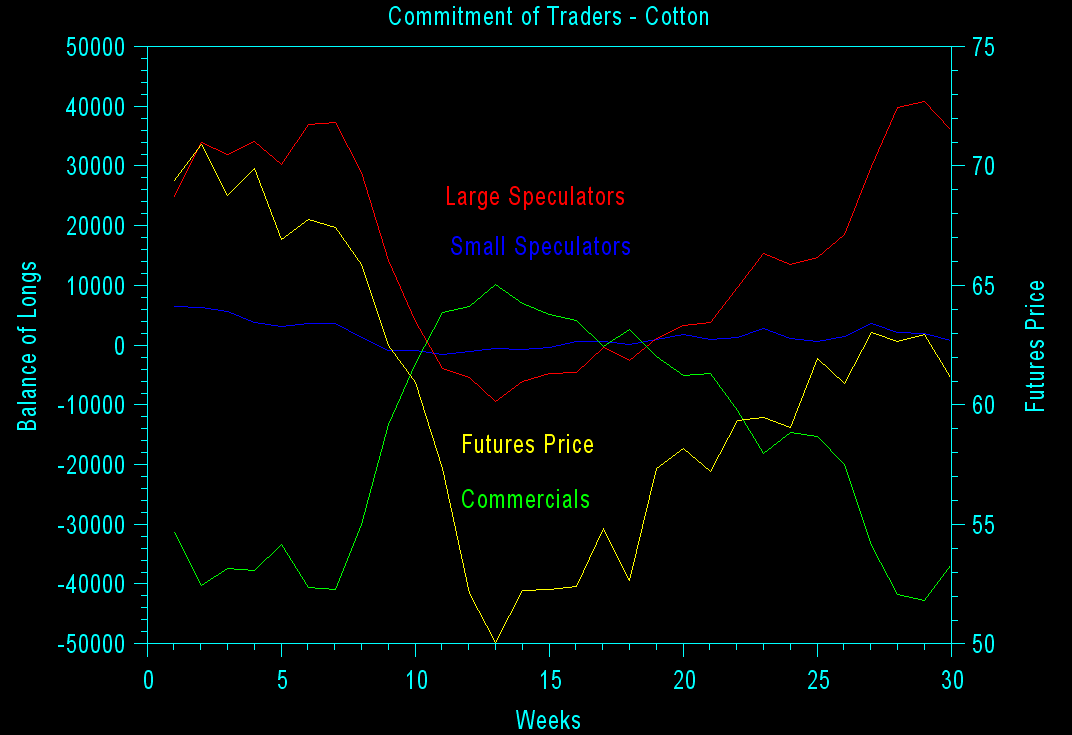
In the chart below, the yellow line is the futures price, read on the right axis. All other colors are read on the left axis. Blue is small speculators. Red is large speculators. Green is commercials. Large speculators with the best track record are getting increasingly-short.
Interpretation of a Different Site Below (Their trader categories may vary from ours):
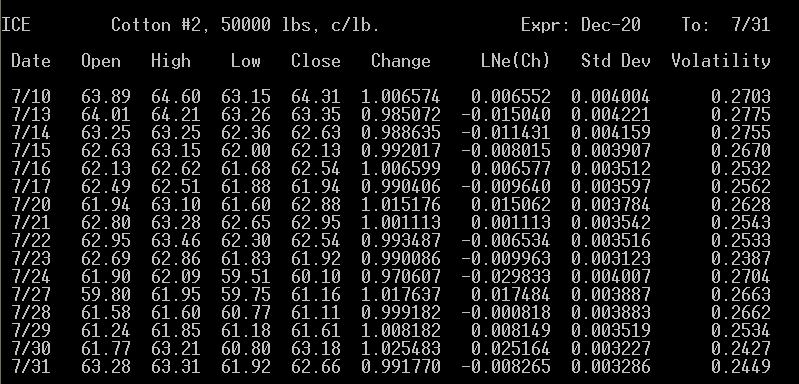
The average volatility shown below suggests that a change in major trend to down is imminent near a volatility low point.
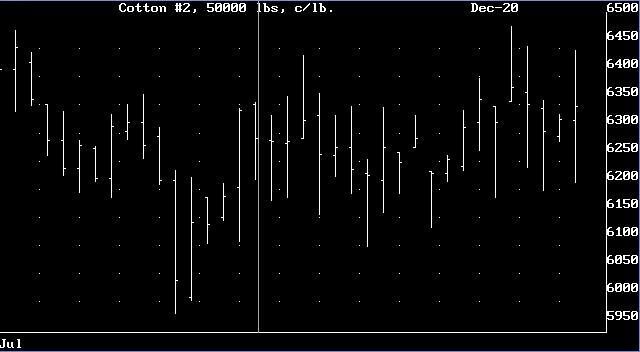
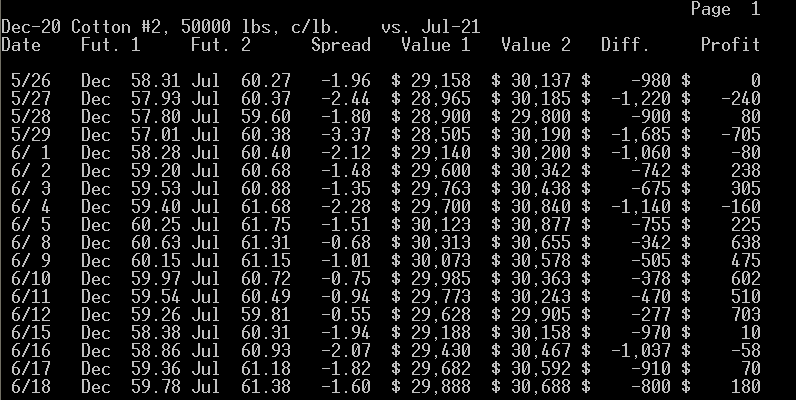
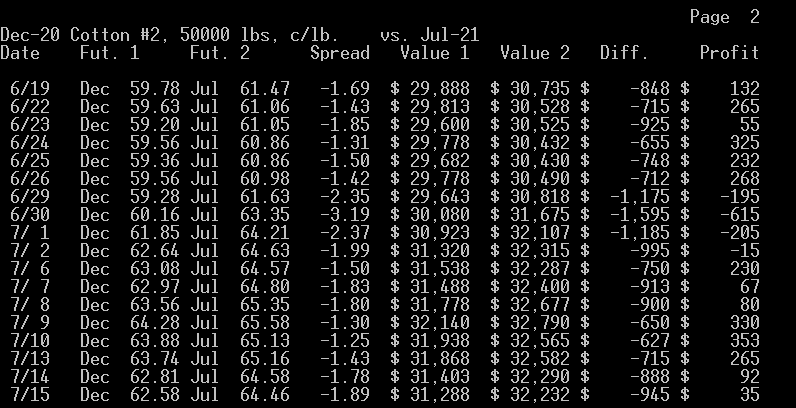
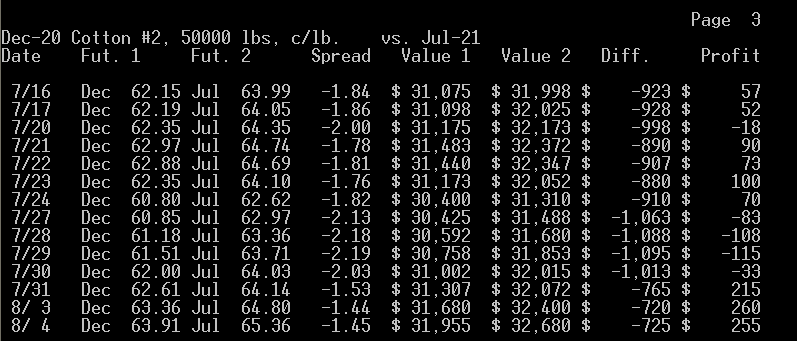
What the Dec. - Jul. calendar spread suggests to us is that buying the near contract and selling the far one is at most times profitable, which we think is a sign that these futures may up in the long run. The best time to enter or leave the above spread is when it is at -2.37 or wider selling the far as prices are falling and then selling the near, and exiting or entering when it is at -0.78 or narrower buying the far as prices are rising and then selling the near. At this time, we appear to be midway headed toward the buy the far, sell the near point.
To view the chart below correctly use Microsoft Internet Explorer.
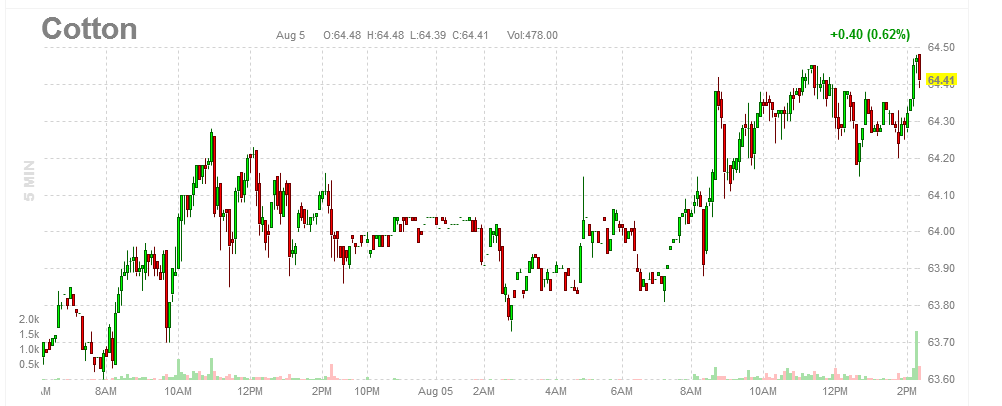
Here's an intraday chart for a previous day ( 7/31 ).
News Analysis
Point & Figure Chart
 74.5|                                                                  R  7/31
     | ICE - Dec-20 Cotton #2, 50000 lbs, c/lb.    Cm.=0.06  Lim.= 3.3
     |
     |
     |
 72.0|_________________________________________________________________________
     |
     |
     |                X
     |                XOX
 69.5|________________XOXOX____________________________________________________
     |                XOXOXO
     |X               XO OXO
     |XOX             X  O OX
     |XOXO            X    OXO
 67.0|XOXO____________X____OXO_________________________________________________
     |XO O            X    O OX
     |X  O        X X X      OX
     |X  O        XOXOX      O
     |   O        XOXOX
 64.5|___OX_______XOXOX________________________________________________________
     |   OXO      XOXOX         X                 X
     |   OXO  X   XOXO          XO                XO
     |   OXO  XOX XOX          OXO                XO
     |   O O  XOXOXO           OXO                XOX
 62.0|_____O__XOXOX____________OXO________________XOX__________________________
     |     O  XOXO             OXO              X XOX
     |     O  XOX              OXO              XOXOX
     |     O  XO               OXO            X XOXOX
     |     OX X                O O            XOXOXO
 59.5|_____OXOX__________________O____________XOXOX____________________________
     |     OXOX                  O            XOXO
     |     OXOX                  O            XOX
     |     O OX                  O          X XO
     |       O                   O          XOX
 57.0|___________________________O__________XOX________________________________
     |                           O          XOX
     |                           O      X X XO
     |                           O      XOXOX
     |                           O      XOXOX
 54.5|___________________________O______XOXOX__________________________________
     |                           O      XO OX
     |                           O      X  OX
     |                           OX   X X  OX
     |                           OXO  XOX  O
 52.0|___________________________OXO__XOX______________________________________
     |                           OXO  XO
     |                           OXO  X
     |                           OXO  X
     |                           O OX X
 49.5|_____________________________OXOX________________________________________
     |                             OXOX
     |                             OXOX
     |                             O OX
     |                               O
 47.0|_________________________________________________________________________
     |
     |
     |
     |
 44.5|----|----|----|----|----|----|----|----|----|----|----|----|----|----|---
                1111111
      67777888890000011111112222333334444445556666677
      20002002210011122222231222002230012220020112313
      42382186773814606127819447234511332491711076040
Our computer tells us a non-conventional reactive approach works best for Cotton on p&f charts. Therefore the above chart is taken as giving a sell signal.
Cyclical and Seasonal Factors

Internal Program
Third System Confirmation
Margin
Historic Range
Commitment of Traders

Volatility / Probable Range

Possible Future Prices
Calendar Spread
Level Table:
 73.5|                                                                  R  7/31
 ICE - Dec-20 Cotton #2, 50000 lbs, c/lb.    Cm.=0.06  Lim.= 3.3
     |
     |
     |
 71.0|_________________________________________________________________________
     |MM
     |MMMMMMM
     |MMMMMMMNN
     |LLLMMMMMMNNNN
 68.5|LLLLLLLMMNNNN____________________________________________________________
     |LLLLLMNNNOO
     |KLLNNOOOOOOO
     |KKNNNNNOOOOOOOO
     |KKKNNNNOOP
 66.0|FGGKKKKKKNNPP____________________________________________________________
     |FFFFFGGGGGHHHHHHKKKKKPP
     |FFFFFFFGGGGGGGGHHHHHJJJJJKKKPP
     |FFFFGGGGGHHHJJJJJJJKK
     |EFFHJJJJJJKPYY
 63.5|DEFFFHHHJJJPYYYY_________________________________________________________
     |DEEFFHPPPPPYYYY
     |CDDDEEEEFFPPPPPYYYYYZZZ[[
     |ACDEEEEEEFPPPPPPYYYYYZZZZZ[[   <<<
     |ACDDDEEEEEPPPQQXYYZZZZZ[[
 61.0|ACDDDDDDDEEEEEPPQQXXXYZZZZ[______________________________________________
     |ACDDDDDDEEEPQQQQQWWXXXXYZZZ[
     |AAAABBBBBCCDDEPQQQWWXXXXXZZ
     |AAAAABBBBBBBCCCPQQVWWWXXXXXZZ
     |AAAAAABBBBCCCCCQQVWWWWXXXX
 58.5|AAAAABBBCCCCCCQQQVVWWWWWWWXX_____________________________________________
     |AAABBBCCQQQVVWWWW
     |ABQQVVVVW
     |BQQQUUUVVVVVVV
     |QUUUUUVVVVVVV
 56.0|QTTUUUUUVVVV_____________________________________________________________
     |QQTTTTTUUUUUV
     |QQTTTTTTUUU
     |QQTTTTTTTUUU
     |QQTTTTTTUU
 53.5|QQTTTTUUU________________________________________________________________
     |QQRSSTTUUU
     |QRRRSSSSSTTTUU
     |QRRRSSSSSSSSSTTU
     |RRRRRSSSSSSSSSTT
 51.0|RRRRSSSSTT_______________________________________________________________
     |RRRS
     |RRRRS
     |RRRRRRRS
     |RRRRRS
 48.5|RRRRRS___________________________________________________________________
     |RRRR
     |RRR
     |RR
     |
 46.0|-A-B-C-D-E-F-G-H-J-K-L-M-N-O-P-Q-R-S-T-U-V-W-X-Y-Z----|----|-- TPO=-0.933
                 1 1 1 1 1 1
       8 8 8 9 9 0 0 1 1 2 2 1 1 2 2 3 3 4 4 5 5 6 6 7 7 7           7
       0 1 2 1 2 1 2 1 2 1 2 0 2 0 2 0 2 0 2 0 1 0 1 0 1 3           3
       2 5 9 3 7 4 8 1 5 0 4 9 4 7 4 9 3 6 1 5 9 3 7 1 6 0           1
Other Factors
