![]()
Introduction Nirvana Internal Progrm06-20-2020: July Cocoa: Major Producers Organize to Hold Base Price
(Click on links below. Whole page needs to load before links work.)
Intermarket
Parabolic
News
Point & Figure
Cyclic/Seasonal
Third System
Margin



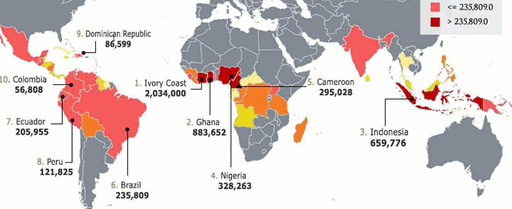
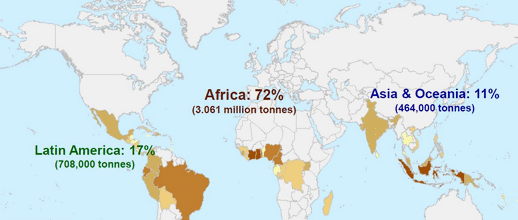
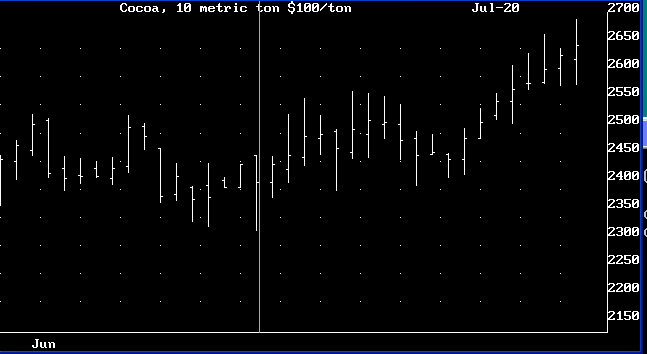
Most of the news consists of West African governments attempting to cooperate to regulate a base price for cocoa below which they will not sell. That price is $2,600/ton, whereas the current futures price is $2,387, It would take some time for agreements to take effect, and details on enforcement and cooperation from areas outside of West Africa which also are producing more and more cocoa, especially in the light of diseases attacking coffee trees, so the move would not be instantaneous but holds promise as markets evaluate the situation.
Weather is not entirely cooperating with cocoa production and transportation of beans to market. Climate change is causing shifts in production areas.
We fed Cocoa, Coffee, and Sugar into a neural network to get the following result:
September Cocoa:
July Cocoa:
Some analysts say "global risk sentiment" is holding back cocoa from further gains. European stock markets have been weak is negative for cocoa. Demand is weak in Europe which accounts for 1/3 of all cocoa processing. West Africa has been having cocoa supply problems. A landslide outside of the major Ivory Coast city of Abidjan killed more than a dozen people and was caused by rainfall over a 4-day period. Rain there is more than three times the normal amount. Heavy rainfall causes supply bottlenecks for moving cocoa beans toward Ivory Coast ports, difficu.ty in drying cocoa beans, and also kncking flowers and small pods off cocoa trees. In other areas like Nigeria, a lack of rainfall could result in a sharp decline in Nigeria's mid-crop output.
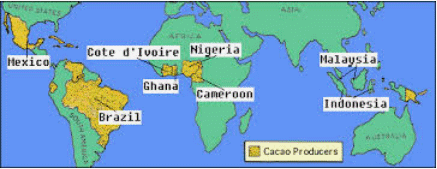
Cocoa buyers and processors meeting in Accra this week agreed to a floor price oif $2,600 per ton proposed by top producers Ivory Coast and Ghana. The agreement followed two days of meetings in the Ghanian capital, representing a step forward toward cooperation efforts by Ivory Coast and Ghana. The countries are seeking to exert more influence over the market to ensure their farmers and economies derive more benefit from the industry. It is not clear how the process will work, and a technical meeting will be held in July to nail down the practicalities. Ghana will only sell cocoa for the 2020-21 season at the minimum price of $2,600./ton. The countries will manage production and are working to boost cocoa demand to offset any "marginal" increase in output as a result of floor price. Ivory Coast and Ghana account for about 60% of global cocoa supply. Rabobank said earlier that a $2,600 minimum price would probably result in overproduction.
Meanwhile, top cocoa growers have haltee 2020 sales amid minimum price talks. African coicoa growers are having an "OPEC moment." The minimum price would produce a "live income differential " of $400/ton. The base price represents a 5.2% increase over farmgate prices in the previous year. Periods of low inflation help farmers reduce their costs while maintaining their selling prices.
Market reaction fo the talks allowed cocoa to extend gains in New York to the highest close in about a year.
Climate change has been hurting coffee production in Central America, causing farmers there to shift crops to cocoa. In Honduras the government is requiring growers to substitute 8% of coffee land to cocoa. But Central America will not supplant West Africa as the primary supplier of cocoa any time soon.
There has been a serious outbreak of locusts in East Africa, spurred by favorable weather conditions for the desert locusts, despite concerted use of pesticides. The pests can migrate 150 km/day.
"Farm gate price" is defined as the net price of a product when it leaves the farm, after marketing costs have been subtracted (which many farms do not have). Delivery and transportation costs are not included.
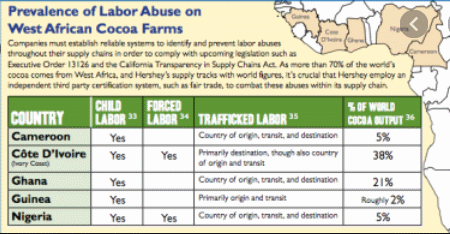
Sustainability problems have hurt cocoa farmers as governments strive to protect remaining forest lands. $400/ton is not enough to sustain adequate living conditions for farmers who need to make at least 20% above their cost of production when admitting cocoa beans into the supply chain. There are great variations in qua.lity of product.
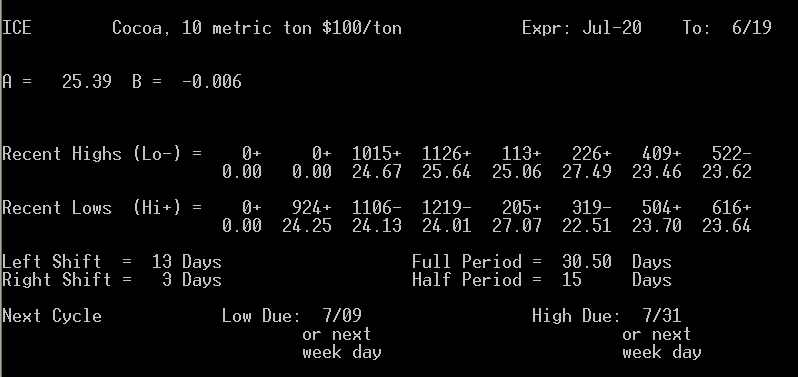
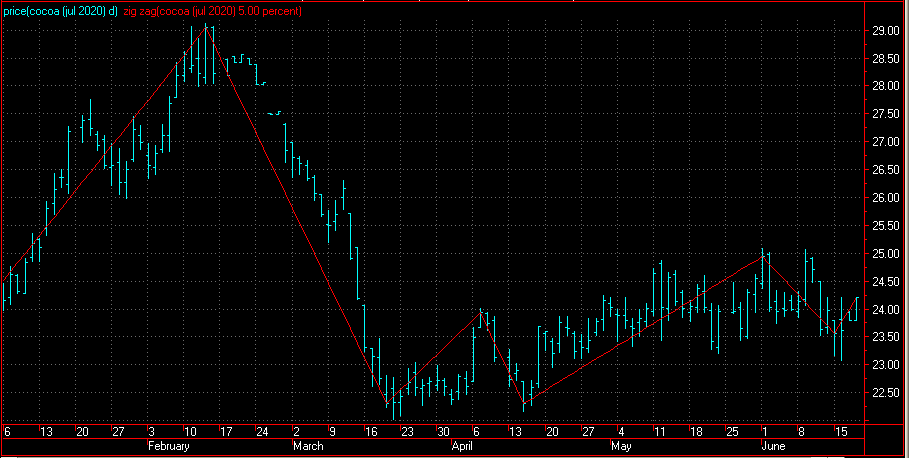
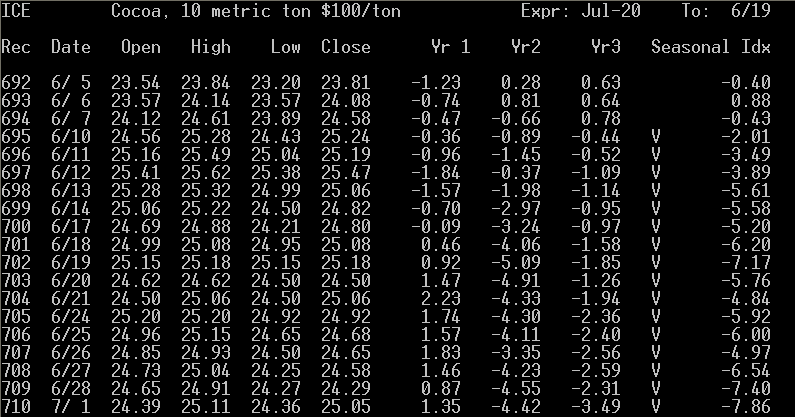
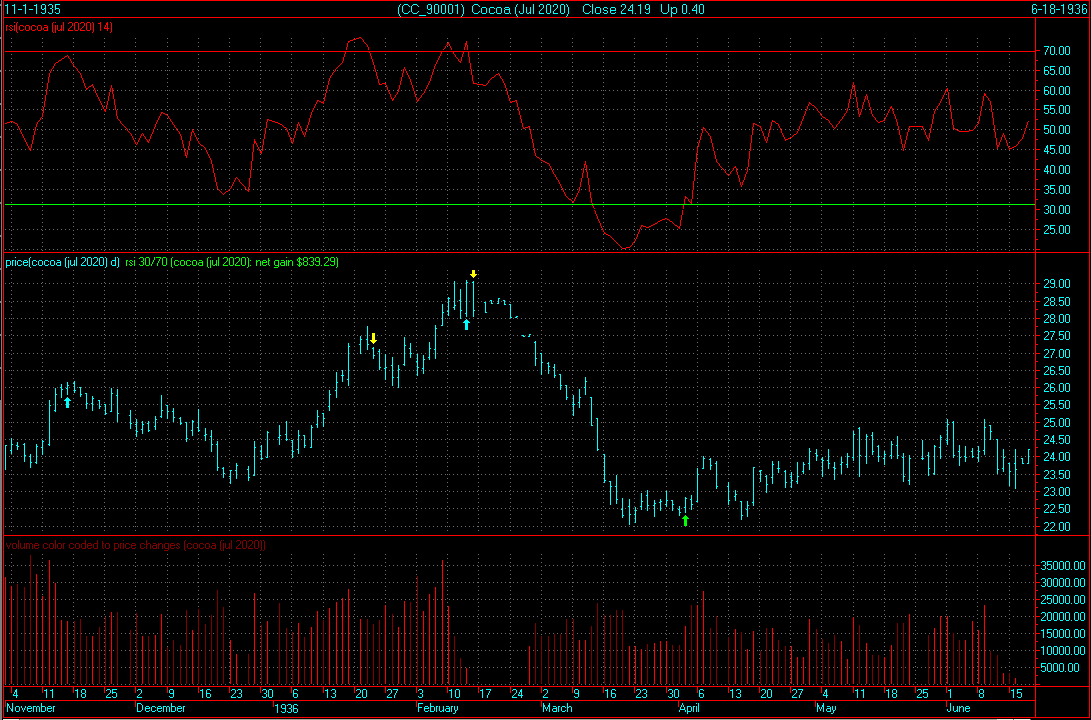
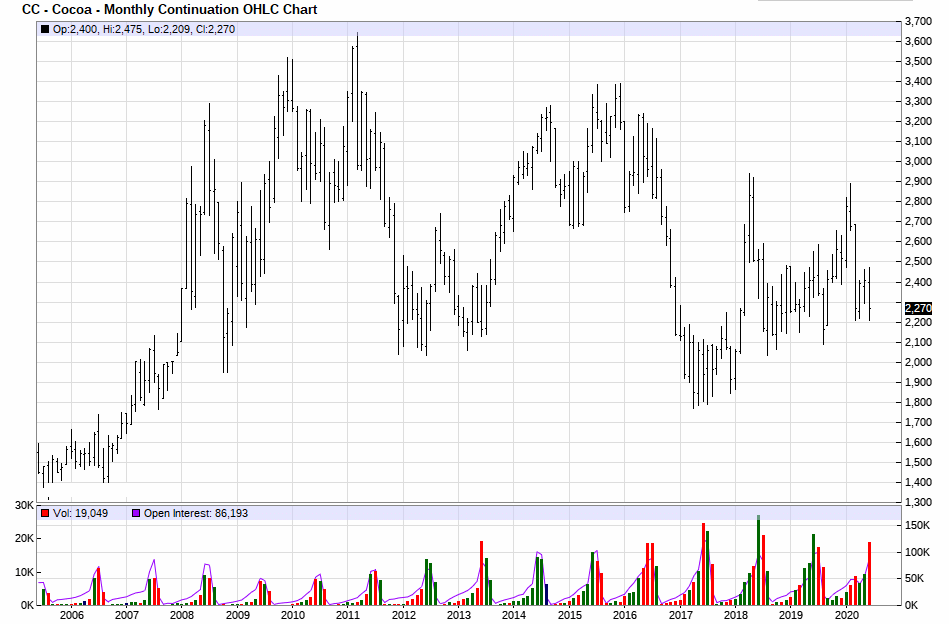
We are headed toward a cyclical low and a seasonal down period.
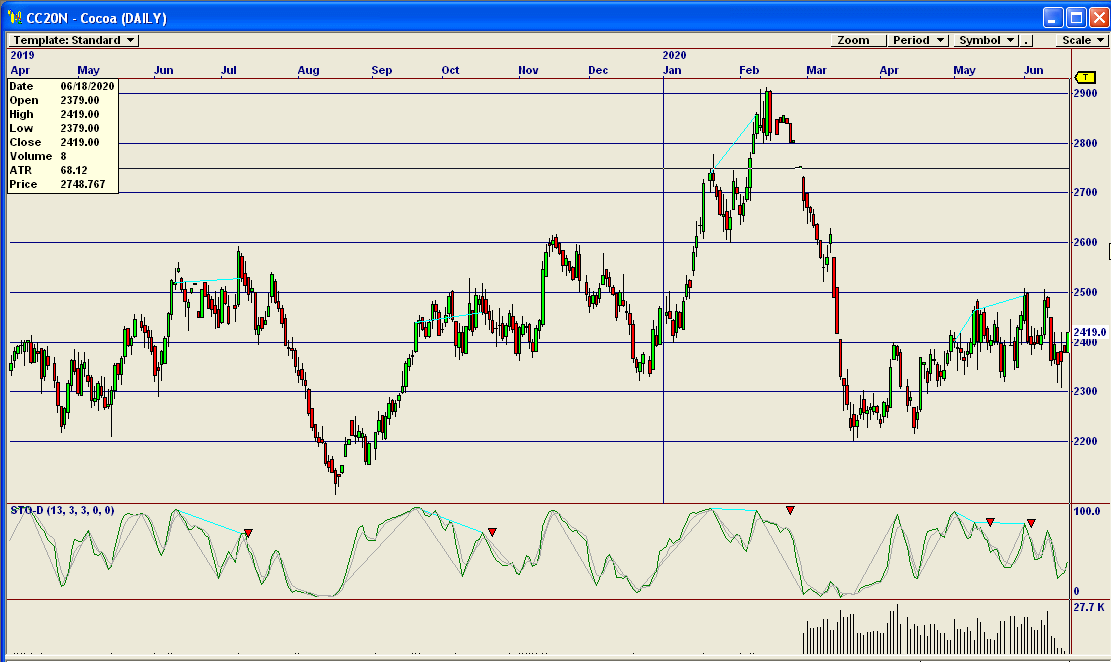
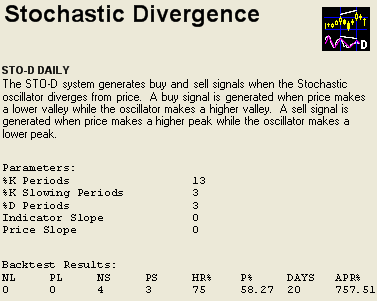
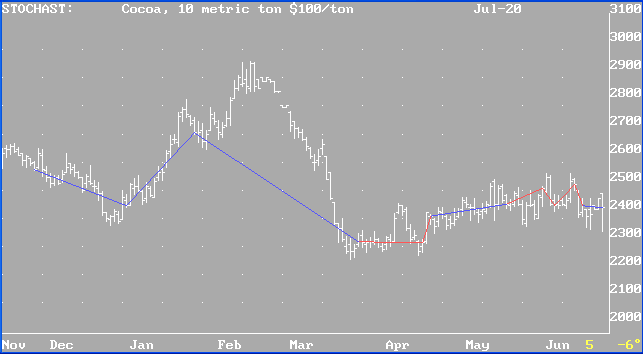
Our best-performing internal program is "Stocahst". It is giving a sell signal.
Results of "Stochast" for Cocoa (blue lines = successful trades, red, unsuccessful):
(Always in the market.)
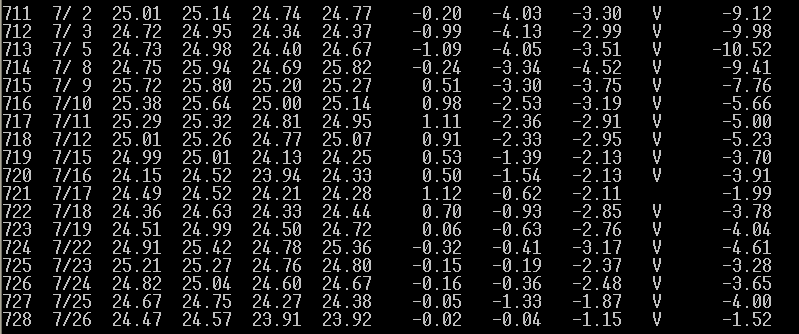
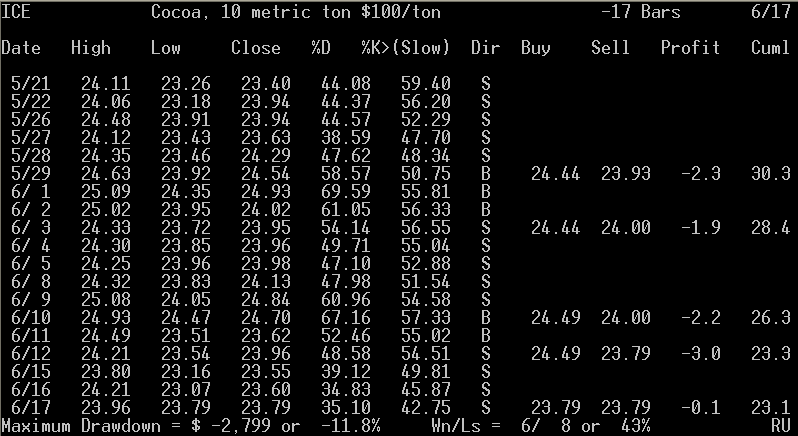
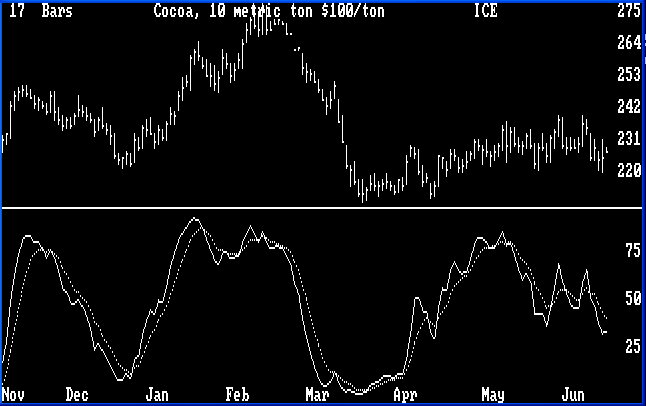
Our third system has triggered a buy signal. (Note, disregard the year on the chart. Our regular readers know this is not a Y2K-compliant system, but it still works.)
The point value is $1,000. Initial margin on a single contract is $2,090. Use of options is advised.
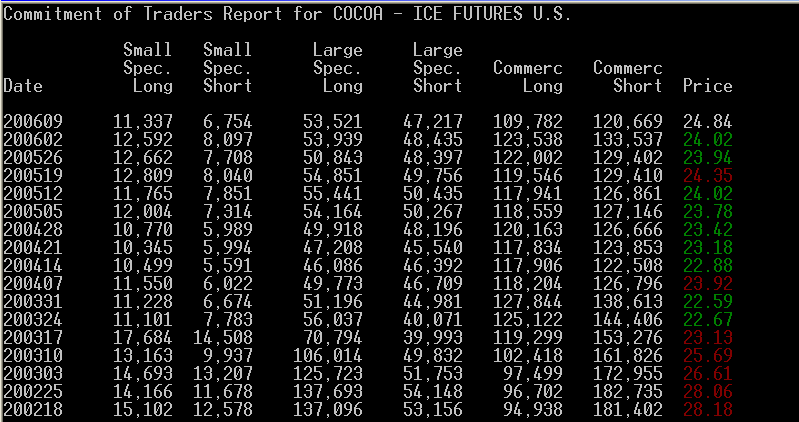
Scale traders are not a factor in this price range.
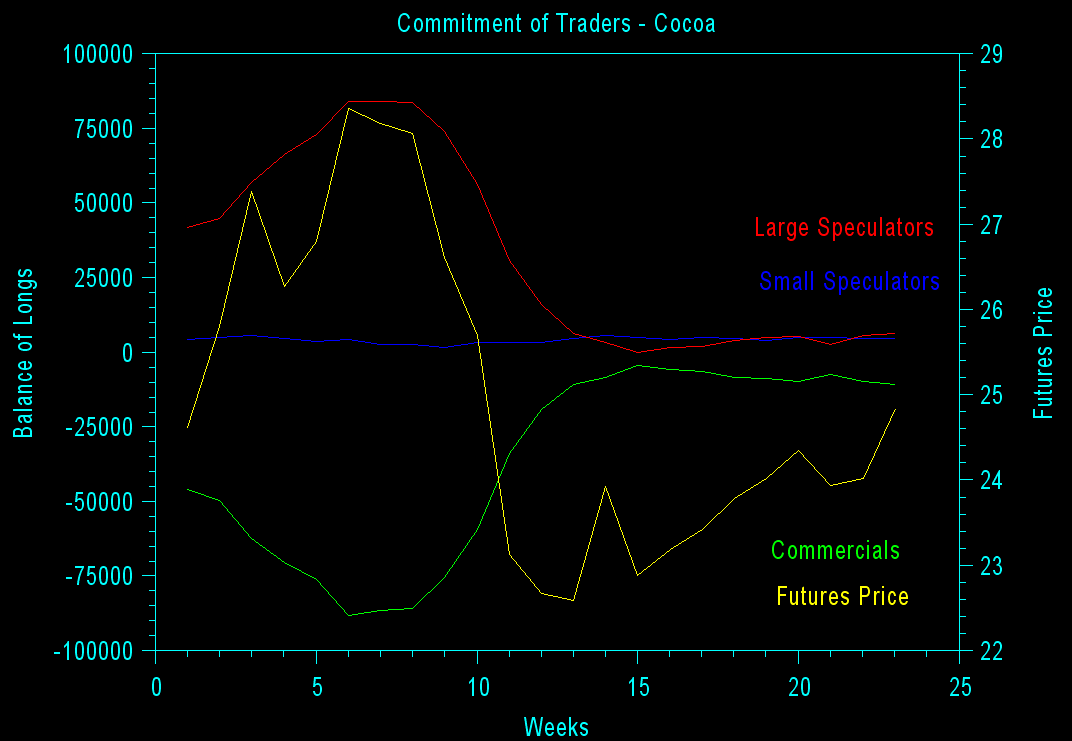
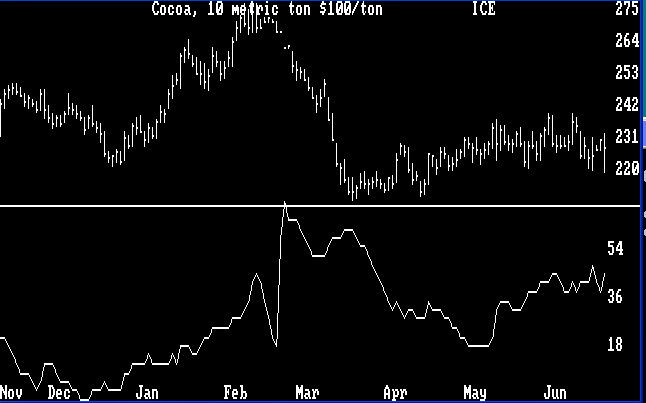
In the chart below, the yellow line is the futures price, read on the right axis. All other colors are read on the left axis. Blue is small speculators. Red is large speculators. Green is commercials. Large speculators with the best track record are getting increasingly-long.
Interpretation of a Different Site Below (Their trader categories may vary from ours):
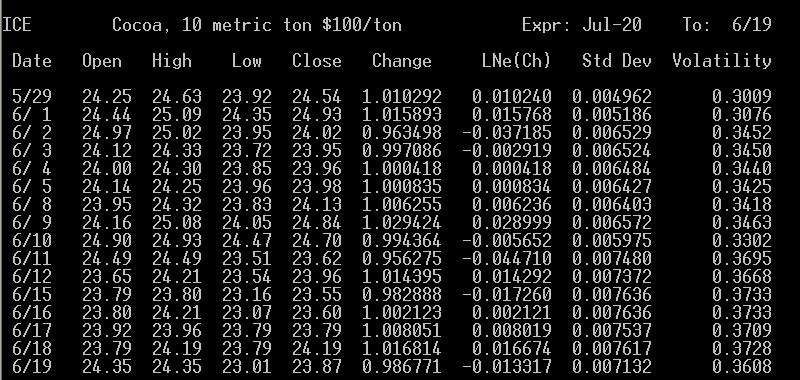
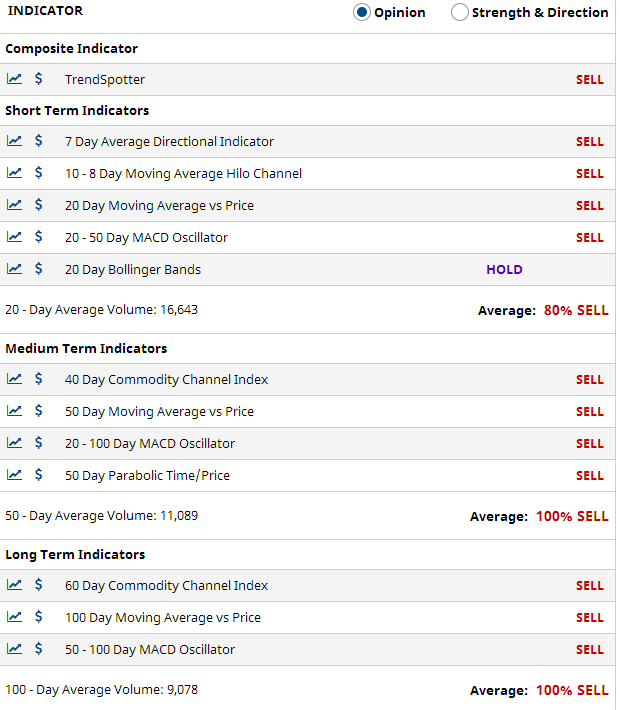
The average volatility shown below suggests that an uptrend remtains intact from the last volatility low point.
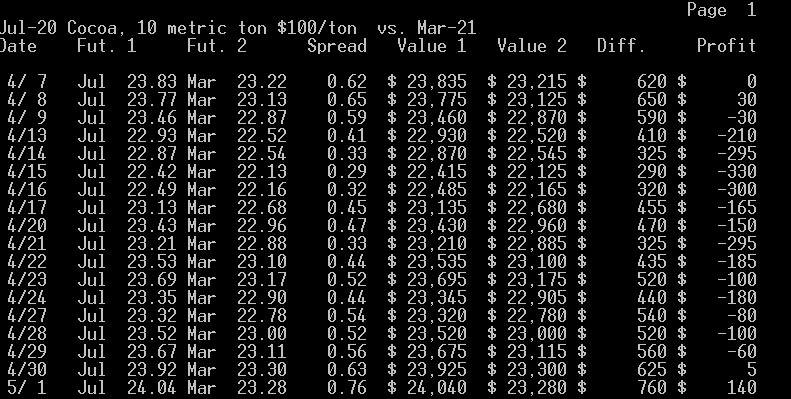
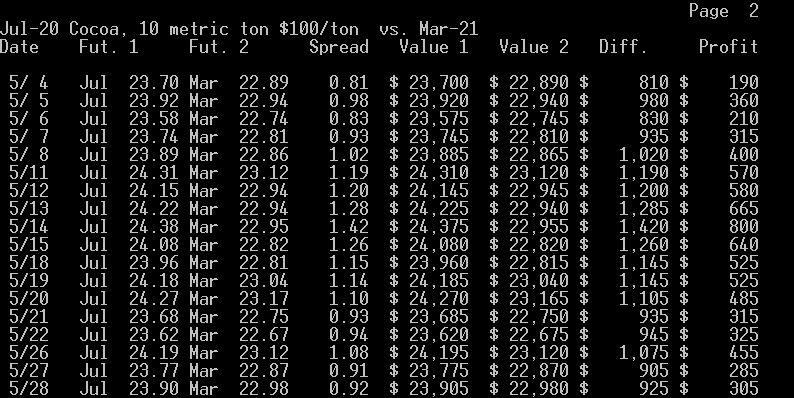
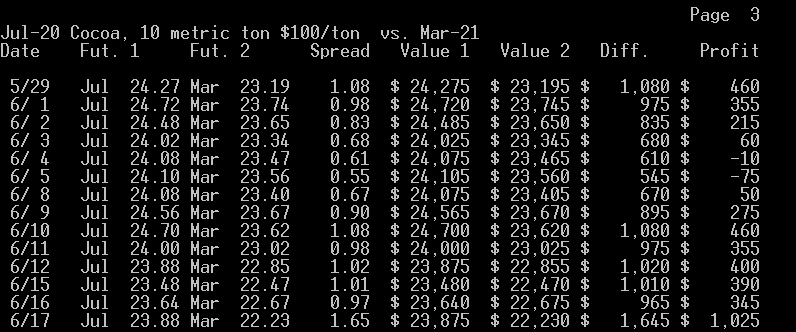
What the Jul. - Mar. calendar spread suggests to us is that buying the near contract and selling the far one is at most times profitable, which we think is a sign that these futures may go up in the long run. The best time to enter or leave the above spread is when it is at 0.30 or narrower sellilng the far as prices are falling and then buying the near, and exiting or entering when it is at 1.26 or wider buying the far as prices are rising and then selling the near. At this time, we appear to be at the buy the far, sell the near point..
To view the chart below correctly use Microsoft Internet Explorer.
Here's an intraday chart for a previous day ( 6/17 ).
Introduction
We should be looking at this time at September Cocoa, but our staff has been overwhelmed and slow to update. Traders should be thinking September as volume in July near expiration is exceptionally low for cocoa.
Intermarket Analysis


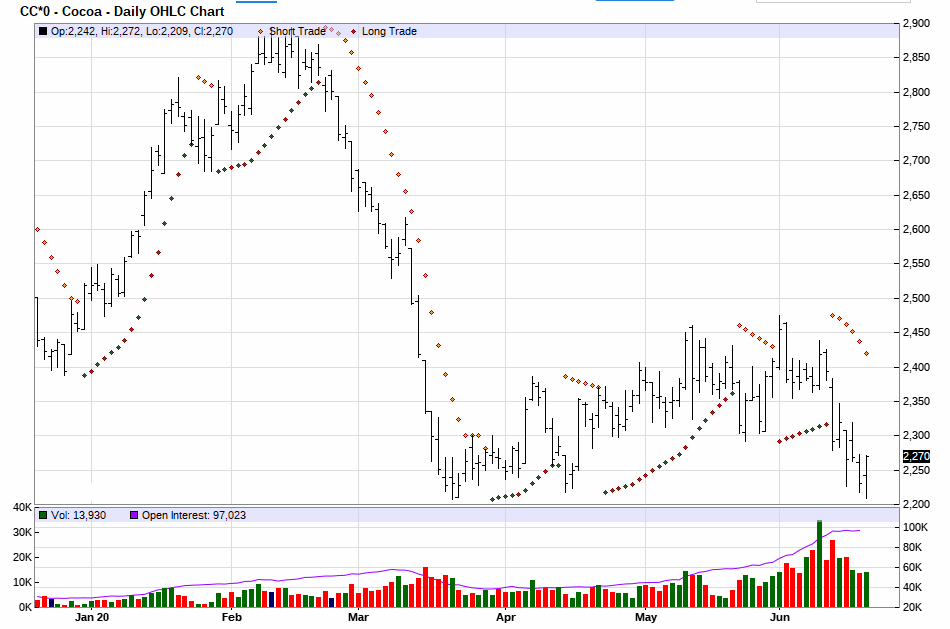
Parabolic Chart
Nirvana Chart
News Analysis
Point & Figure Chart
 31.5I                                                                  T  6/18
     I ICE - Jul-20 Cocoa, 10 metric ton $100/ton  Cm.=0.03  Lim.= 1.5
     I
     I
     I                   X
 30.0I___________________XOX___________________________________________________
     I                   XOXO
     I                   XOXOX
     I                   XOXOXO
     I                   XOXOXO                                        X
 28.5I___________________XO_OXOX_______________________________________X_______
     I                   X  O OXOX                                     X
     I                   X    OXOXO                                    X
     I                   X    O OXO                                    XO
     I                   X      O O                                  X XO
 27.0I_______________X_X_X________O__________________________________XOXO______
     I               XOXOX        OX                                 XOXO
     I             X XOXOX        OXOX                               XOXO
     I             XOXO OX        OXOXO                              XO O
     I             XOX  OX        OXOXO                          X   X  O
 25.5I_____________XOX__OX________OXOXO__________________X_______XOX_X__O______
     I             XO   O         OXOXO                X XO      XOXOX  O
     I             X              OXO O                XOXOX   X XOXOX  O
     I             X              OX  O                XOXOXOX XOXO OX  O    X
     I             X              OX  O                XO OXOXOXOX  OX  O  X XO
 24.0I_____________X______________OX__OX_X___X_______X_X__O_OXOXOX__OX__O__XOXO
     I             X              O   OXOXO  XO  X   XOX    OXO O   OX  OX XOXO
     I             X                  OXOXO  XO  XOX XOX    OX      O   OXOXO O
     I           X X                  OXOXO  XOX XOXOXO     OX          OXOX  O
     I           XOX                  OXOXO  XOXOXOXOX      OX          OXOX
 22.5I___________XOX__________________OXOXO__XOXOXOXOX______OX__________OXOX___
     I           XOX                  OXOXO  XOXOXO O       OX          O O
     I   X       XOX                  OXOXOX XOXOX          OX
     IOX XO  X   XOX                  O OXOXOXO OX          OX
     IOXOXO  XO  XOX                    OXOXOX  O           OX
 21.0IOXOXO__XOX_XOX____________________OXO_O_______________O__________________
     IOXO O  XOXOXOX                    OX
     IOX  OX XO OXOX                    O
     IO   OXOXO O OX
     I    OXOXO   OX
 19.5I____OXOXO___OX___________________________________________________________
     I    O OX    O
     I      O
     I
     I
 18.0I----I----I----I----I----I----I----I----I----I----I----I----I----I----I---
                  1                      11111                11111111
       566667788991133344445555555566678901222123344556667777800011222112444556
       300131112011012200120011111202202000011010222110010122201212013232011221
      0058900408685292823161315778186960799713451839564778526371329621706637191
The above chart is giving a conventional sell signal.
Cyclical and Seasonal Factors
Internal Program
Third System Confirmation
Margin
Historic Range
Commitment of Traders

Volatility / Probable Range

Possible Future Prices
Calendar Spread
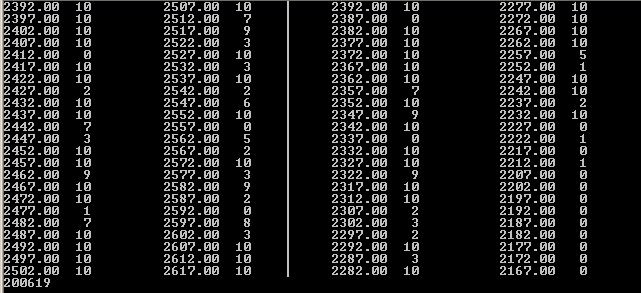
Level Table:
 30.0|                                                                  T  6/19
 ICE - Jul-20 Cocoa, 10 metric ton $100/ton  Cm.=0.03  Lim.= 1.5
     |
     |
     |
 29.0|_________________________________________________________________________
     |RRR
     |RRRR
     |RRRRRRR
     |QRRRRRRR
 28.0|QRRRRRRS_________________________________________________________________
     |QR
     |QQ
     |PQSS
     |PPQQ
 27.0|PPPQQQQS_________________________________________________________________
     |PPPPQQQQS
     |PPQQQQQQSS
     |PPQQQQQSSS
     |PPPQQQQQSSSS
 26.0|PPPQQST__________________________________________________________________
     |LLLLPQSST
     |BBLLLLLMMMPPSTT
     |BBBLLLLLMMMPSTT
     |BBBCLLLLLLMMMMMPSTT
 25.0|ABBBBBCCHLMMMMMNPPST_____________________________________________________
     |AAAAABBBBBCCCHHJJJLMMMMMMMNNNOPPTTYYZ
     |AAAAAAAABBBBCCCGGHHHJJJJLMMMMNNNNOOOTXYYZZ
     |AAAAAABBBCCGGGHHHHHJJJJJJJKKLMNNNNOOOOOOTXXXXYYYYZZ
     |AAAAABBBBCCGGGGGGGHHHHHHJJJJJJJJKKKKKKKLNNOOOOOOOTXXXXXYYYYYZZ
 24.0|BBCGGGGGHHHHHHJJJJJKKKKKKKKNNOOOOOTWWWXXXXXXYYYYYYZZZZZZZ[_______________
     |BCCCGHHHHJJKKKKKNOOOOTVWWWXXXXXXXXYYYYYYYYYZZZZZZ[[
     |CCCGGHHHHKKKKNNOTVVVWWWWWWWXXXXXXYYYYYZZZZZ[[   <<<
     |CCFGGNNNOOTUVVVVWWWWWWWXXXYYYYZZZZ[
     |CCCDFFNNNOTTUVVVVWWWWXYYZZ[
 23.0|CCDFFTTUVVVVWWWYZZ[______________________________________________________
     |DDFFTTUUVVVV
     |DFFFFTTTUUUUUUVVV
     |DDFFFFFTTTUUUUUUUUVVVV
     |DEEFFFFTTTUUUVV
 22.0|DDDDEEEEFFFFTTV__________________________________________________________
     |DDDDEEEEEEEF
     |DEEEF
     |DDDEE
     |DDDE
 21.0|DE_______________________________________________________________________
     |D
     |
     |
     |
 20.0|-A-B-C-D-E-F-G-H-J-K-L-M-N-O-P-Q-R-S-T-U-V-W-X-Y-Z----|----|-- TPO=-0.726
                     1 1 1 1 1 1 1
       6 7 7 8 8 9 9 0 0 0 1 1 2 2 1 1 2 2 3 3 4 4 5 5 6 6           6
       2 0 2 0 1 0 1 0 1 2 1 2 1 2 1 2 1 2 1 2 0 2 0 2 0 1           1
       4 8 2 5 9 3 7 1 5 9 2 6 1 6 0 7 0 5 0 4 7 2 6 0 4 8           9
Other Factors

                 Risk Versus Opportunity Report
                ________________________________

                     CCN0    July Cocoa

                      High Price:  2520
                   Current Price:  2387
                       Low Price:  2124

                            Risk: -0.115
                     Opportunity: -0.227

                    (O/R) Ratio =  1.977