![]()
Introduction Nirvana Internal Progrm Historic Range05-03-2020: June Australian Dollar: Virus Pushes Lower Interest Rates as Asian Trade Recovers
(Click on links below. Whole page needs to load before links work.)
Intermarket
Parabolic
News
Point & Figure
Cyclic/Seasonal
Third System
Margin
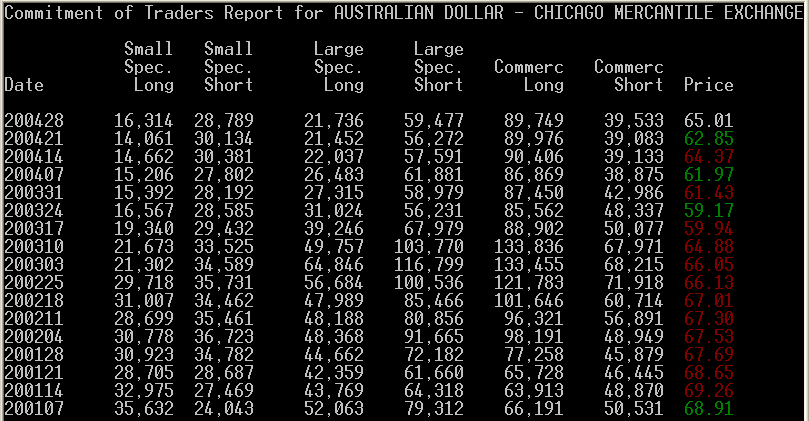
Commitment
Volatility






Global trade benefits everyone, but unfortunately our President is incapable of seeing this. As he now scratches around for support to "punish" China for its handling of the pandemic, he will end up once again punishing American consumers and the American economy, amid high unemployment when the whole idea of the thing was to keep jobs in America. Meanwhile, Australia seems to use a bit more common sense, and may recover faster than here benefitting the Australian Dollar Latest investigations show the virus was already in America long before it was detected as a worldwide threat. Until America stops whining and starts really doing something about the problem, its exchange rate will be punished by trailing behind more proactive countries.
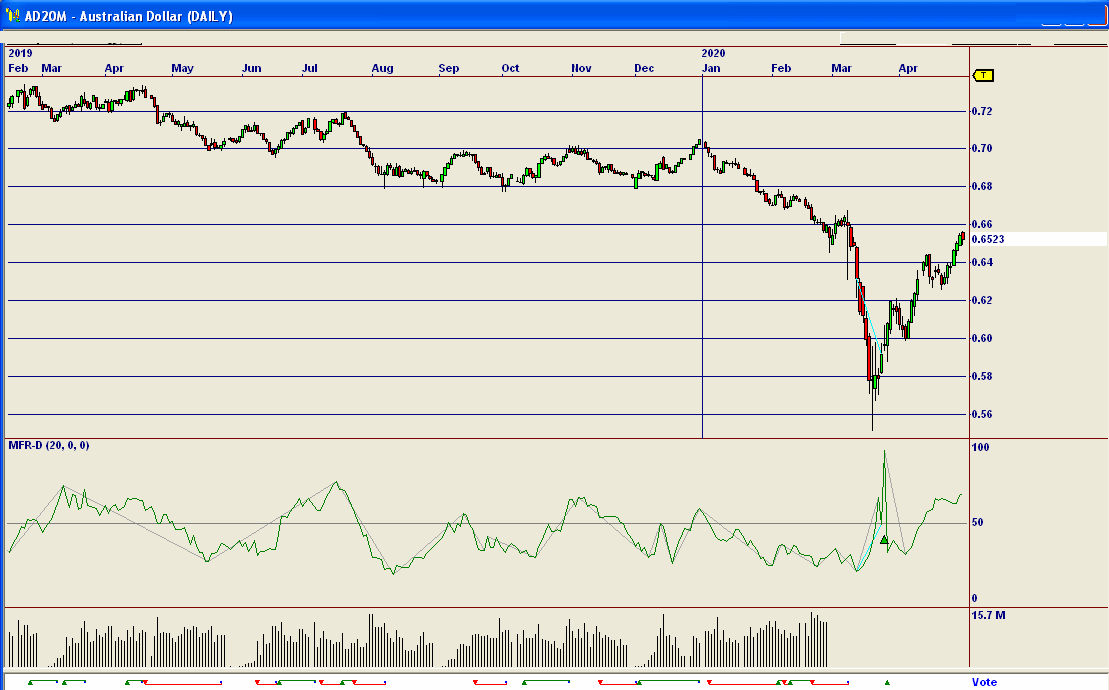
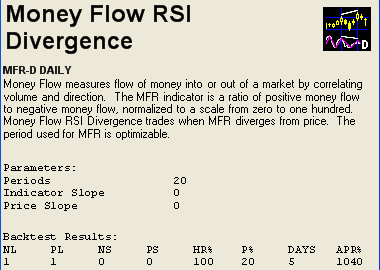
We fed the Australian Dollar, Japanese Yen, and British Pound into a neural network to get the following result:
June Australian Dollar:
June Australian Dollar:
The Australian Dollar is the 5th most actively-traded currency. It is often paired with Asian currencies such as the Yen in a "carry trade" where investors buy the currency with the higher interest rate and sell another currency with a lower rate. Recently, the Australian Dollar made a breakout from previous lows. Chinese purchasters manufacturing index data showed the Chinese economy continued to revoer well from the ravages of coronavirus, even if not quite as well as expected on all counts. The Australian Dollar's slide was arrested by the good Chinese PMI data. China is a major trading partner with Australia. The Chinese April PMI was at 50.8, below the 52 seen in March and the 51.0 expected. But it was above 50, which satisfied the market. Anything above 50 signifies expansion. Trump's comments about punishing China for the pandemic made little sense but did a lot of harm by placing presure on the Yuan. China has fueled Australia's mining and energy expansion.
As many countries tiptoe out of coronavirus restrictions, this is favorable for the Aussie. U.S. Federal Reserve rates will remain at 0 to 0.25 until the economy is clear of pandemic impacts according to a FOMC statement. There was pressure from some sources including the Administration to go to negative interest rates which the Fed will not do. The Fed balance sheet shows taking on a lot of quantitative easing buying of securities. This is not necessarily good for the U.S. Dollar in the exchange rate.
Economic activity in the U.S. declined 4.8% in the First Quarter and is expected to decline worse in the 2nd, impacting the exchange rate.
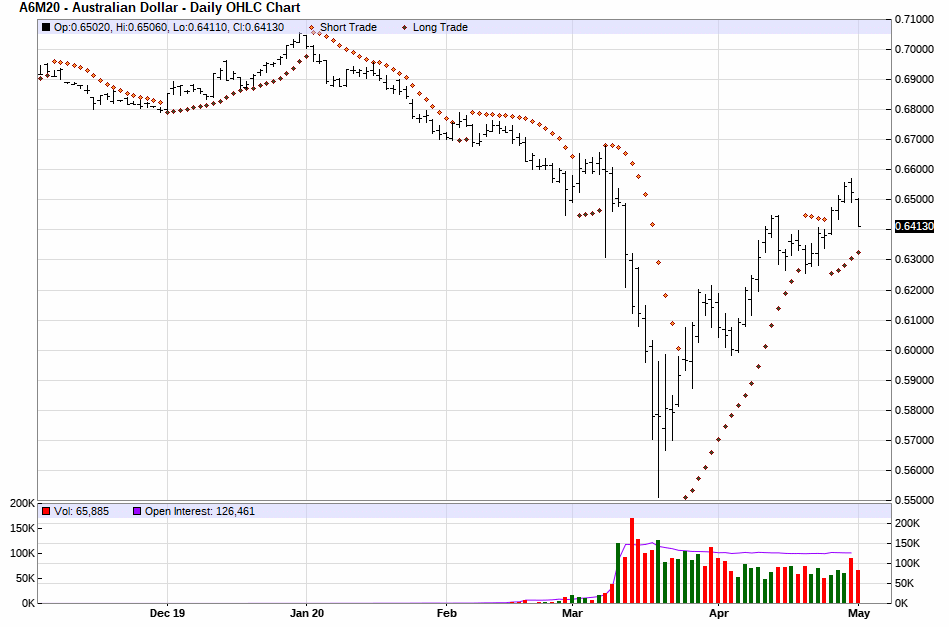
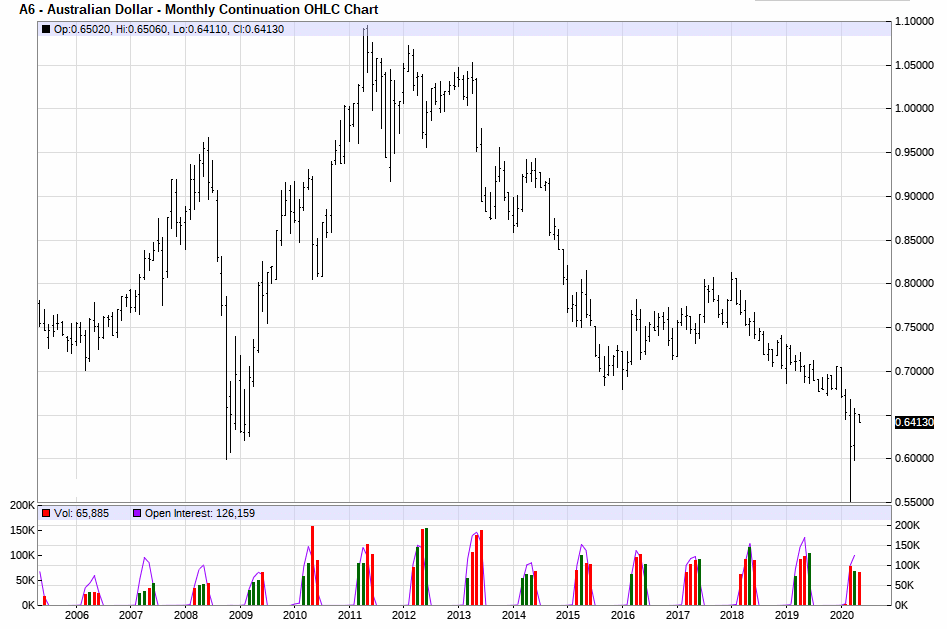
The Australian Dollar has advanced more than 18.6% over yearly lows. It appears to be approaching resistance.
The coronavirus is not the only cause of a weakened Australian Dollar. The Reserve Bank of Australia cut interest rates to a historic low of 0.75% for the Australian Dollar. RBA Chairman Philip Lowe suggested even more interest rate cuts may be needed.
Many "expertes" expect the AUD to USD forecast rate will reach 0/ 700 by the end of 2020.
Inflation rose above expectations in Australia recently helping the Aussie even though prospects of higher interest rates remains a distant one. The Consu9mer Price Index there rose 0.3% on the quarter and 2.2% on the year. This was well ahead of expectations which had looked for a 1.9% rise. Core inlfation came in at 1.8% on the year ahead of 1.6% expected. The coronavirus has cut a direct link between inflation data and interest rate policyi across the world including Australia. It seems unlikely that interest rates will rise anywhere soon with the RBA seen as possibly taking theirs toi zero.
Australian Prime Minister Scott Morrison gave the Aussie a little boost by saying that the easing oif lockdown restrictions may not be too far away. Recent Aussie lows were of course inspired by the coronavirus. The Austraian Dollar found support in the massive global stimulus preograms designed to ameliorate the worst economic effects of the contagion. Gradual emergence from lockdown in other nations as well as its own have helped the AUD/USD.
National Australia Bank's Alan Oster said Australia faces a recession unlike anything it has seen since World War II. Still, both the Australian and New Zealand Dollars have extended a remarkable comeback, with New Zealand lagging Australia. The moves occurred despite a flood of bond offerings, with the Australian Government selling A$3billion in notes in one recent day alone. All auctions drew solid bids. Three year yields on RBA bonds drew 0.28% interest. Yields on the 10-year drew 0.97%. New Zealand plans to issue NX%90 billion in bonds by 2024. Central banks are keeping the market liquid by buying some of the bonds.
Recently, another pledge of unlimited easing has caused the U.S. Dollar to falter.
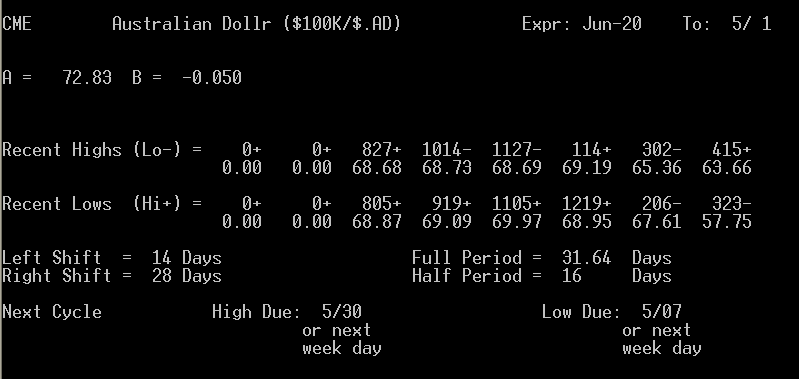
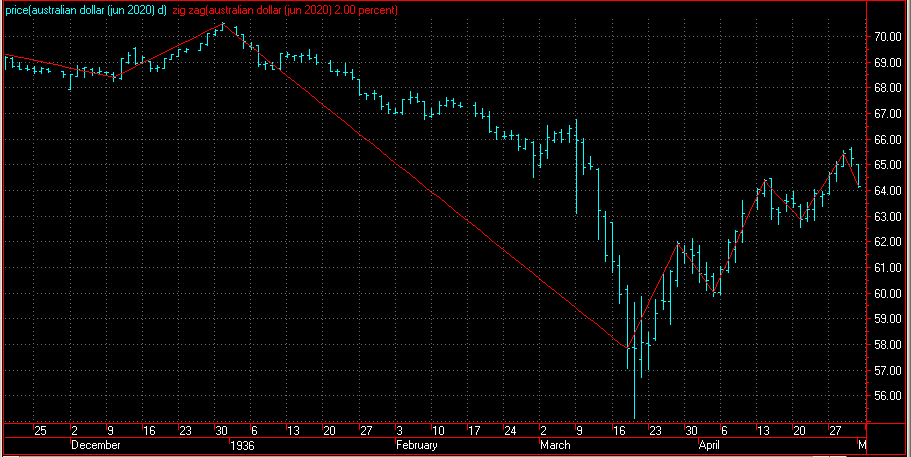
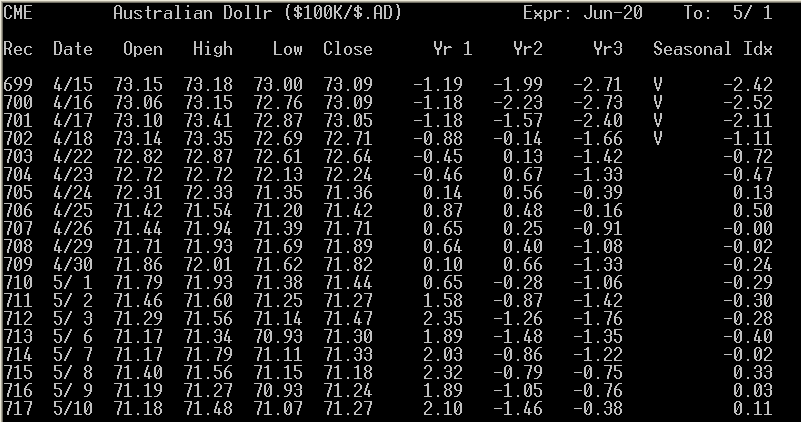
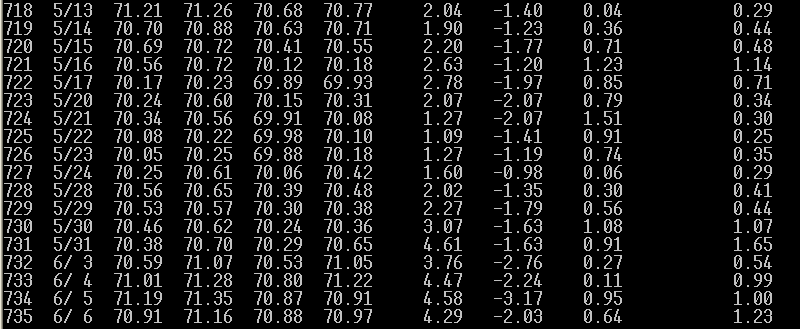
We are headed toward a cyclical low with no seasonal trend detected.
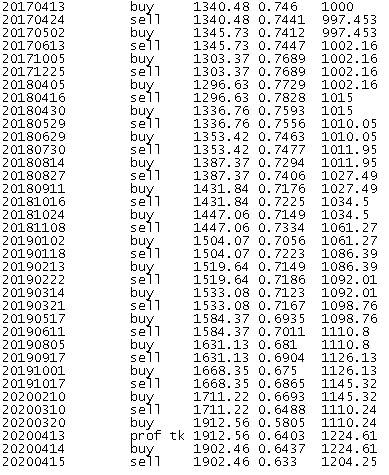
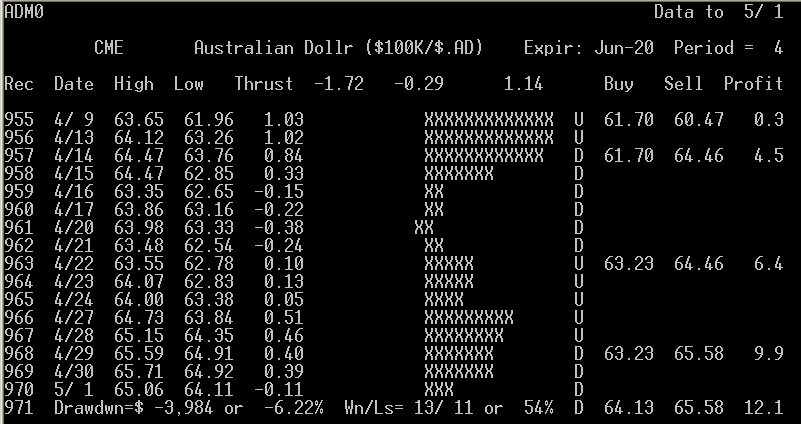
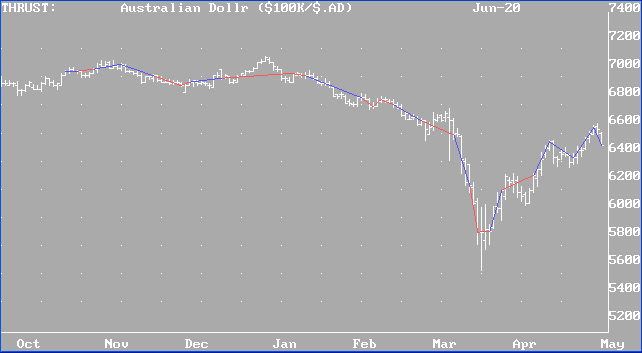
Our best-performing internal program is "Thrust". It is giving a sell signal.
Results of "Thrust" for Australian Dollar (blue lines = successful trades, red, unsuccessful):
(Always in the market.)
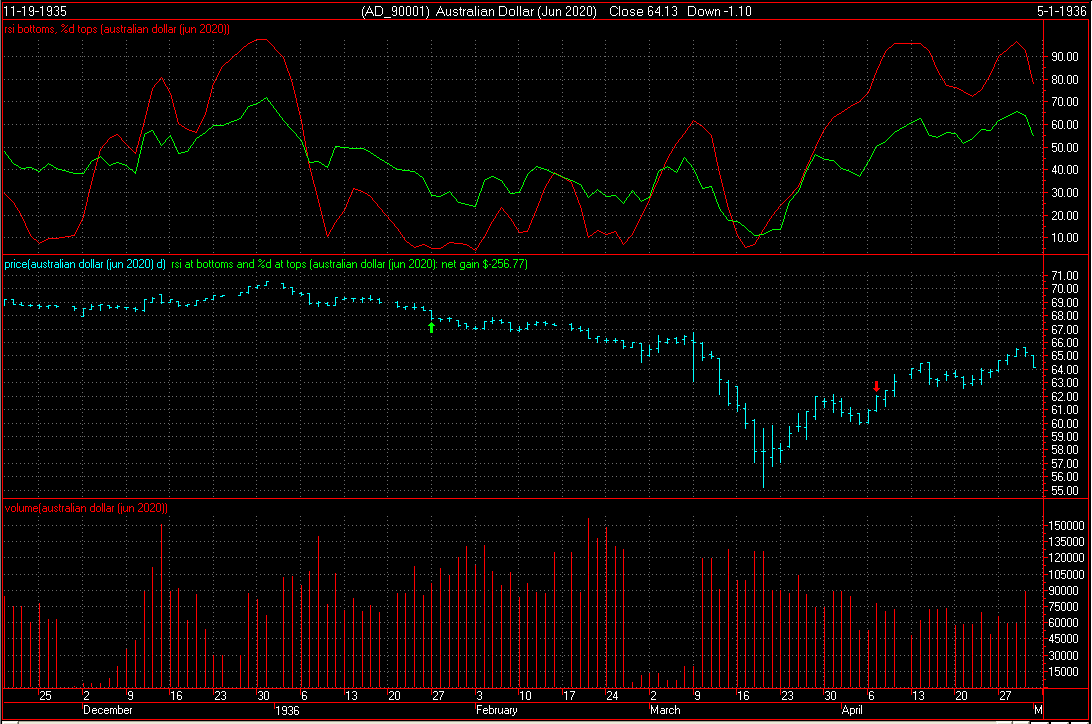
Our third system has triggered a sell signal. (Note, disregard the year on the chart. Our regular readers know this is not a Y2K-compliant system, but it still works.)
The point value is $1,000. Initial margin on a single contract is $1,980. Use of options is advised.
Scale trade buyers are entering the market for the long term in this price range.
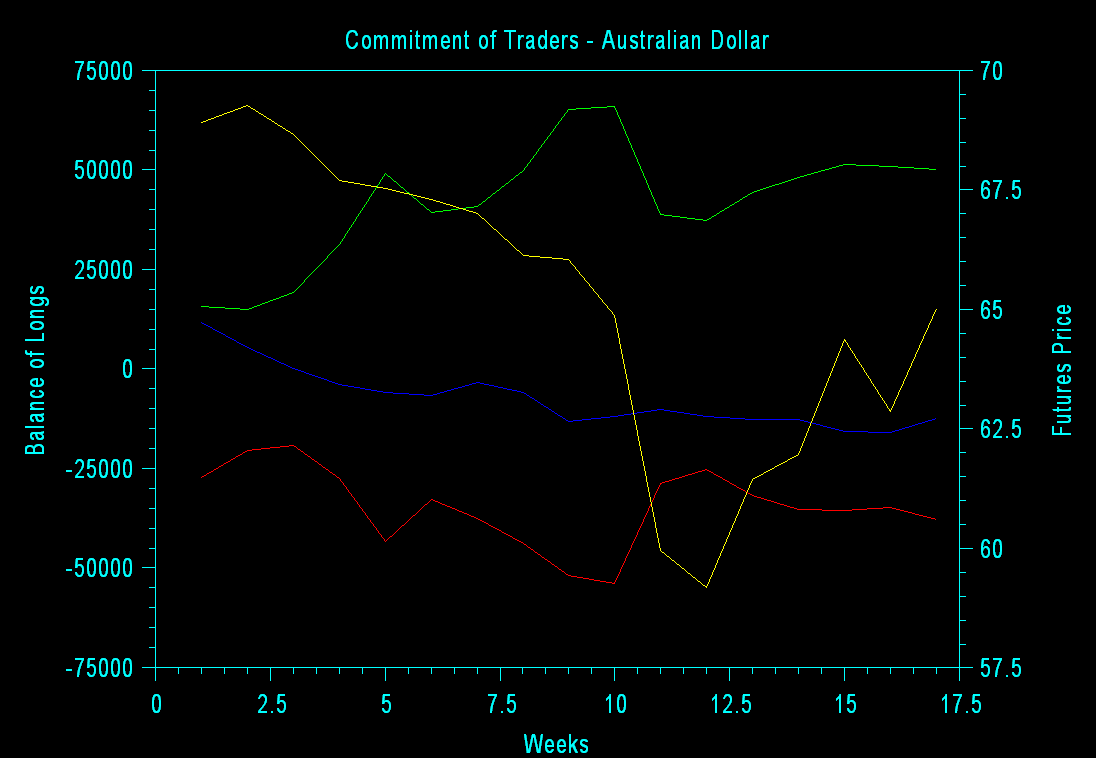
In the chart below, the yellow line is the futures price, read on the right axis. All other colors are read on the left axis. Blue is small speculators. Red is large speculators. Green is commercials. Commercials with the best track record are remaining long with the exception of a slight blip in the latest data.
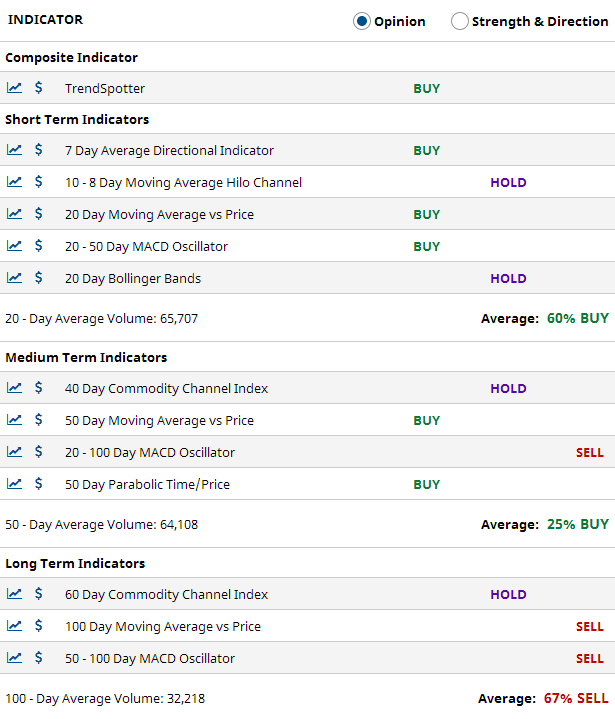
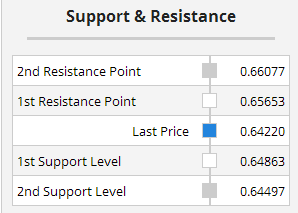
Interpretation of a Different Site Below (Their trader categories may vary from ours):
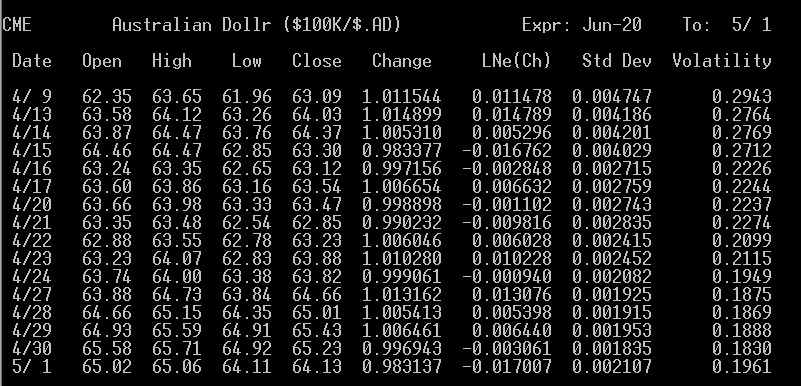
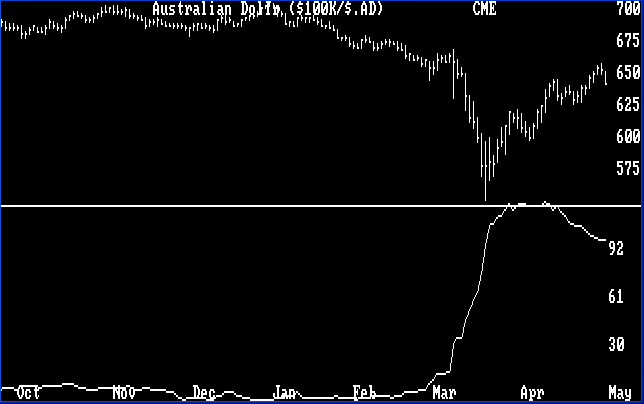
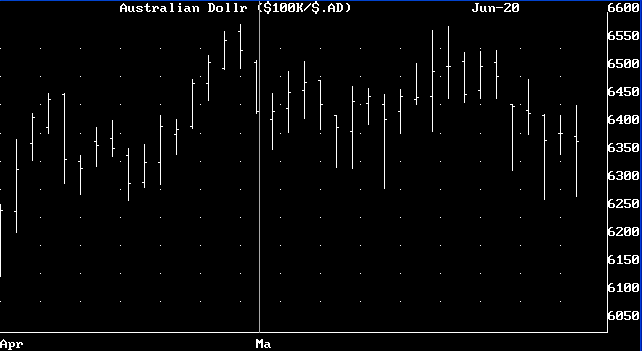
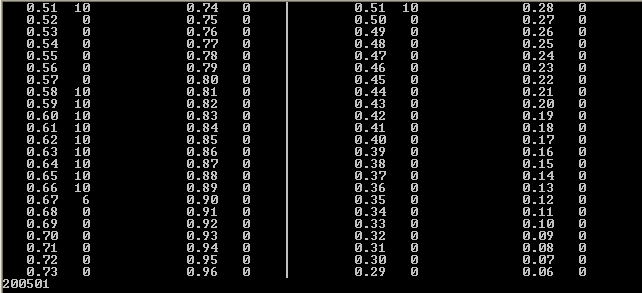
The average volatility shown below suggests that an uptrend remains intact from the last volatility low point.
An optrion trade recommendation may appear later in this spot.
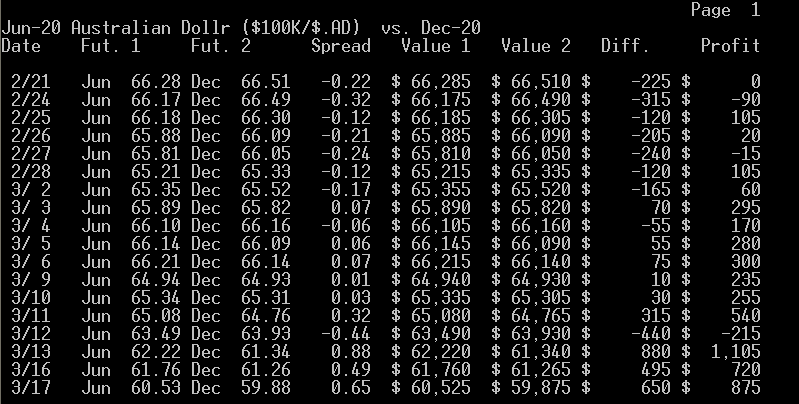
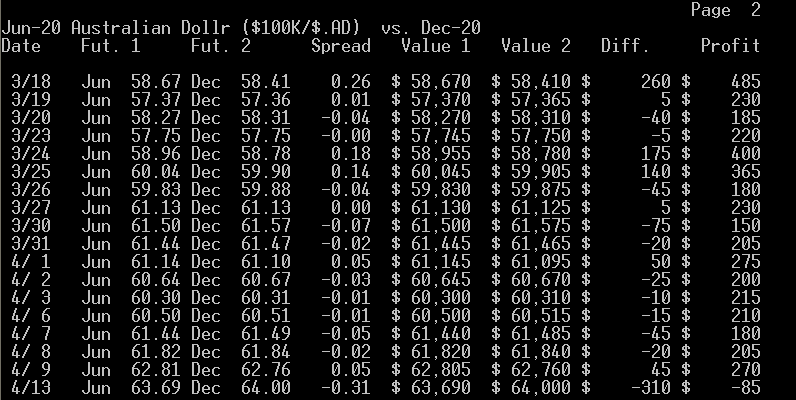
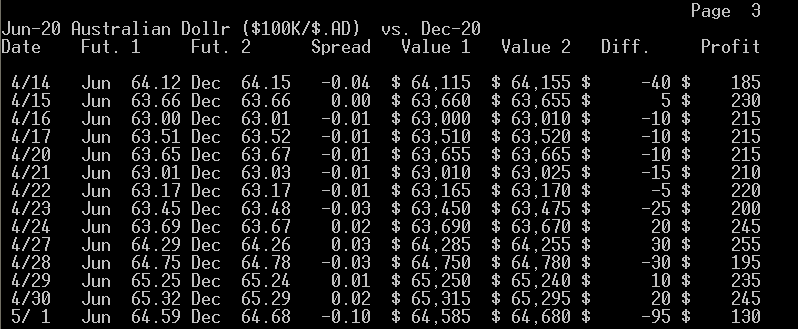
What the Jun. - Dec. calendar spread suggests to us is that buying the near contract and selling the far one is at most times profitable, which we think is a sign that these futures may go up in the long run. The best time to enter or leave the above spread is when it is at -0.03 or narrower selling the far as prices are falling and then buying the near, and exiting or entering when it is at +0.60 or wider buying the far as prices are rising and then selling the near. At this time, we appear to be midway, possibly heading toward the sell the far, buy the near point.
To view the chart below correctly use Microsoft Internet Explorer.
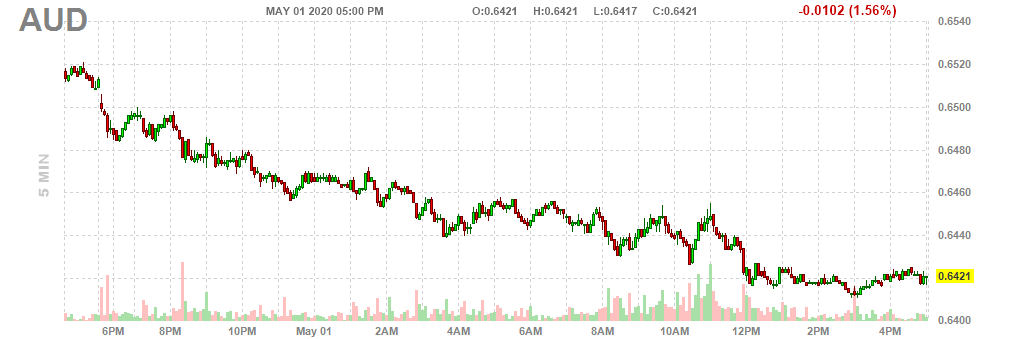
Here's an intraday chart for a previous day ( 5/01 ).
Introduction
Is China pulling out of the pandemic faster than the U.S.? It is beginning to look that way. As China's economy recovers perhaps faster than ours, this also looks good for Australia as China is one of its main Southeast Asia trading partners, especially for oil and metals mined in Australia. Australia's economy is struggling, but so is the rest of the world. Interest rates play less of a role as they are so near zero everywhere, but Australia's still remain a bit higher. Analysts are starting to project a rosy recovery picture for the Aussie exchange rate, perhaps makling it to 70 cents to the U.S. Dollar by the end of the year.
Intermarket Analysis


Parabolic Chart
Nirvana Chart
News Analysis
Point & Figure Chart
 85.0|                                                                  T  4/30
     | CME - Jun-20 Australian Dollr ($100K/$.AD)  Cm.=0.03  Lim.= 2.6
     |
     |
     |
 82.5|______________________X__________________________________________________
     |                    X XO
     |                  X X XO
     |                  XOX XOX
     |                  XOXOXOXO
 80.0|__________________XO_OXOXO_______________________________________________
     |                  X  OXO O
     |                  X  OX  O
     |                  X  OX  O
     |            X X X X  OX  O
 77.5|________X_X_XOXOXOX__OX__OX______________________________________________
     |      X XOXOXOXOXOX  O   OXO
     |    X XOXOXOXOXO OX      OXO
     |  X XOXOXO OXOX  OX      O O
     |  XOXOXOX  O OX  OX        O
 75.0|X_XOXOXO_____OX__O_________O_____________________________________________
     |XOXOXOX      OX            O  X
     | OXO O       OX            OX XO
     | O           OX            OXOXOX
     |             O             OXOXOXO
     |             O             OXOXOXO
 72.5|___________________________O_OXOXO_______________________________________
     |                             O OXO
     |                               OXOX
     |                               OXOXO
     |                               OXOXO
 70.0|_______________________________O_O_O__X__________________________________
     |                                   OX XO
     |                                   OXOXO
     |                                   OXOXO
     |                                   O O O
 67.5|_______________________________________O_________________________________
     |                                       O
     |                                       O
     |                                       OX X
     |                                       OXOXO
 65.0|_______________________________________OXOXO____X________________________
     |                                       O OXO    X
     |                                         OXO    X
     |                                         O O    X
     |                                           O    X
 62.5|___________________________________________O____X________________________
     |                                           O    X
     |                                           O  X X
     |                                           O  XOX
     |                                           O  XOX
 60.0|___________________________________________O__XO_________________________
     |                                           O  X
     |                                           OX X
     |                                           OXOX
     |                                           OXOX
 57.5|___________________________________________OXOX__________________________
     |                                           OXO
     |                                           OX
     |                                           OX
     |                                           O
 55.0|----|----|----|----|----|----|----|----|----|----|----|----|----|----|---
                   1        1      111    111
      6666667788999113346899222266901212770221333333344
      0122220203012110100102201201200100133022000112200
      8604475020832119577176726845142448900272399290437
The above chart is giving a conventional buy signal.
Cyclical and Seasonal Factors
Internal Program
Third System Confirmation
Margin
Historic Range
Commitment of Traders

Volatility / Probable Range

Possible Future Prices
Option Recommendation
Calendar Spread
Level Table:
 74.0|                                                                  R  5/ 1
 CME - Jun-20 Australian Dollr ($100K/$.AD)  Cm.=0.03  Lim.= 2.6
     |
     |
     |
 71.5|F________________________________________________________________________
     |AAAADEEEEFFFFFF
     |AAAACCCCCCCDDDEEEEEEFF
     |ABBBBBBBCCCDDEEFGRRR
     |BBBBDDDDDGGKKKKKNNNNNOOORR
 69.0|GGJJKKMMMNNNNNNOOOOQRRRRSSSSS____________________________________________
     |GGGGGHHHHHHHHHJJJKKKLLMMOOOOPPPPPPQQQQQQQRSSSSSST
     |GHHJJJJJLLLLLLLLMMMMMMMPPPPQQQQTTT
     |GJJLLPTTT
     |TUUUUUUUU
 66.5|TTUUUUUVV________________________________________________________________
     |VVVVWW
     |VVVVVWWWWW
     |VVVWWZ[
     |VVWWWZZ[[
 64.0|VWWZZ[___________________________________________________________________
     |WWYYYZZZ   <<<
     |WWYYYZZZZZ
     |WWYYZZZZ
     |WWWY
 61.5|WWXXYYY__________________________________________________________________
     |WWXXXYYY
     |WWXXYYYY
     |WXXXYYYY
     |WXXXYY
 59.0|XXXXXX___________________________________________________________________
     |XXXXX
     |XXXX
     |XXXX
     |XXXX
 56.5|XX_______________________________________________________________________
     |X
     |X
     |X
     |
 54.0|_________________________________________________________________________
     |
     |
     |
     |
 51.5|-A-B-C-D-E-F-G-H-J-K-L-M-N-O-P-Q-R-S-T-U-V-W-X-Y-Z----|----|-- TPO=-0.163
                             1 1 1 1 1 1
       5 5 5 6 6 7 7 8 8 9 9 0 0 1 1 2 2 1 1 2 2 3 3 4 4 4           5
       0 1 3 1 2 1 2 1 2 1 2 0 2 0 2 0 1 0 2 0 1 0 1 0 1 3           0
       3 6 1 4 8 5 9 2 6 0 4 9 3 6 0 5 9 6 1 4 9 4 8 1 6 0           1
Other Factors
                 Risk Versus Opportunity Report
                ________________________________

                 ADM0    June Australian Dollar

                      High Price:  68.02
                   Current Price:  64.13
                       Low Price:  62.22

                            Risk:  0.059
                     Opportunity:  0.119

                    (O/R) Ratio =  2.037