![]()
Introduction Nirvana Internal Progrm6-29-2020: September Mexican Peso: Mexican Interest Rates Crumble
(Click on links below. Whole page needs to load before links work.)
Intermarket
Parabolic
News
Point & Figure
Cyclic/Seasonal
Third System
Margin
 : : : : :


We fed the Mexican Peso, Canadian Dollar, and British Pound into a neural network to get the following result:
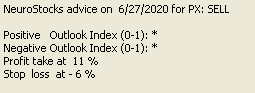
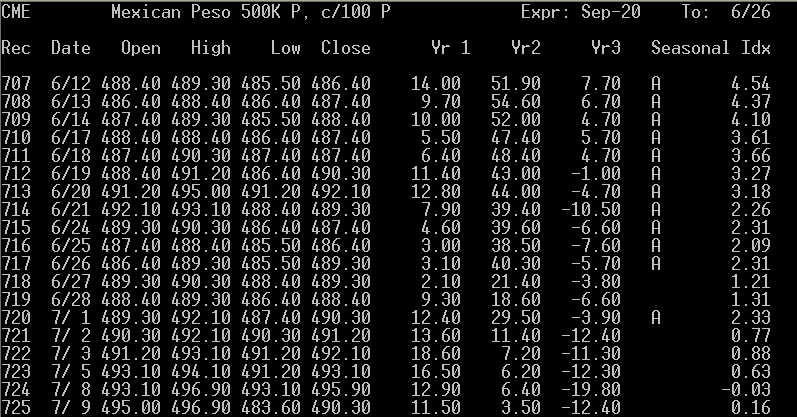
September Mexican Peso:
September Mexican Peso:
The Bank of Mexico continued its rate cut cycle amid the pandemic, which prompted monetary and fiscal responses around the globe. The Mexican Central Bank cut its overnight rate to 5.00% from 5.50% as expected. That drove the U.S. Dollar/ Mexican Peso exchange rate higher as the news crossed the wires. In line with other central banks, the Bank of Mexico cited virus-induced worries in easing the bank's monetary stance. Inflation risks were cited as overall uncertain in the monetary policy statement, including to the downside "a greater than expected impact of widening the negative output gap" and to the upside, "additional episodes of foreign exchange depreciation." Annual headline inflation was noted rising to 3.17% from 2.15% during the second three months of the year. Still, Mexico's interest rate remains higher thank the majority of its emerging market peers.
The Bank of Mexico's statement also cited downgraded economic growth forecasts from multilateral organizations, including that from the International Monetary Fund. Despite the upside improvements seen as some economies reopen, the consiensus conveyed by the bank's statement is one of uncertainty and the bote to lower the overight rate was unanimous. Language of the statement leaves the door open to further rate cuts.
TD Ameritrade said it expected two more rate cuts in Mexico of 50 basis points followed by two more rate cuts of 25 basis points, which would leave Mexico's interest rate at 3.50%. The outlook in Brazil is also for a contracting economy, recentlyi forecast by thier central bank at 6.4%. Argentina is struggling with its debt restructuring.
According to Reuters, both the Mexican Peso and the Brazilian Real have rebounded recently, but said the Real has "more legs" than the Peso. The Peso is "running out of steam" while the Real is gaining momentum. Both Latin American "heavywights" have had their currencies pressured this year as central banks slashed interest rates. Historically-deep recession lies on the horizon. Both currencies' banks have used monetary stimulus in hopes of a quick post-pandemic recovery.
Trump's actions and statements regarding further wall-building have been a factor in weakening the Peso.
Economic activity in Mexico shrank at a record 19.9% year over year in April.
The Bank of Mexico intervened in March to offer $2 billion of foreign exdhange hedges, its first intervension since 2017. The Bank sold U.S. Dollars on the FX market. This is considered not the most ideal form of intervention for Mexico because it reduces the country's international reserves. As recently as March, Mexico's interest rates were hovering around the 7% level.
Mexico's president, commonly known as "AMLO" because of his long name, said he will not step in to aid the corporate sector, making him almost unique among the world's leaders. This has not gone down well with investors. AMLO's reluctance to boost spending has drawn parallels with Brazil, where President Jair Bolsonaro has downplayed the pandemioc and failed to lead a nationwide response, triggering a negative market reaction.
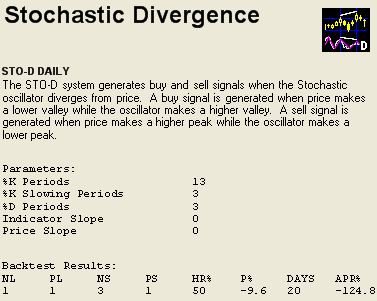
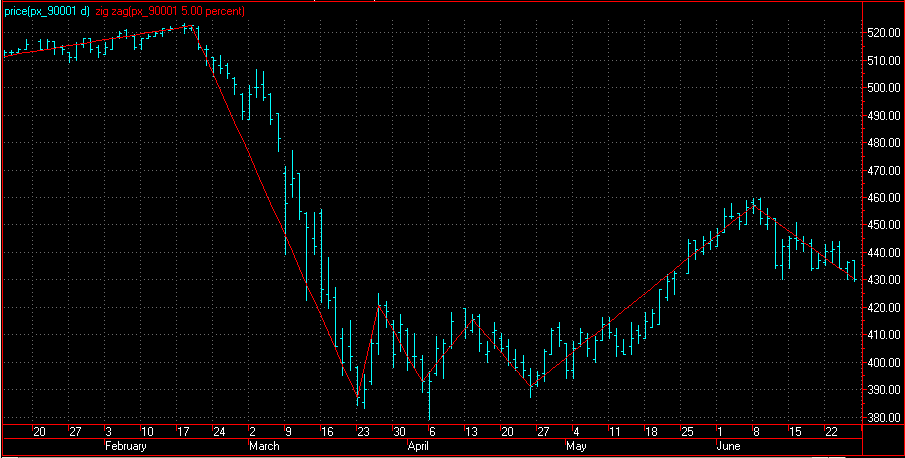
We are headed toward a cyclical low and a seasonal down period.
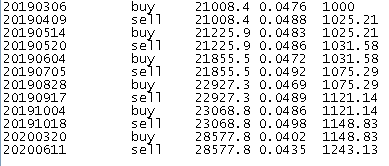
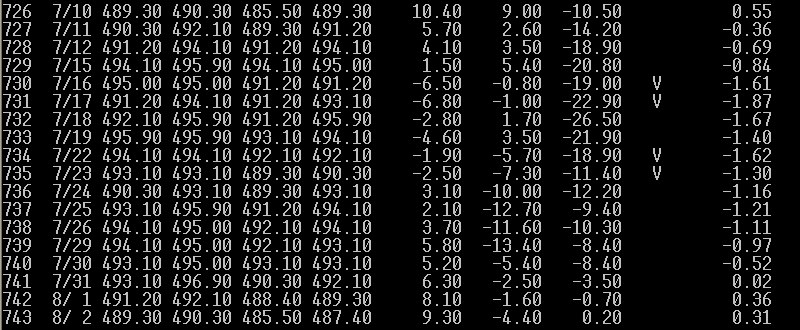
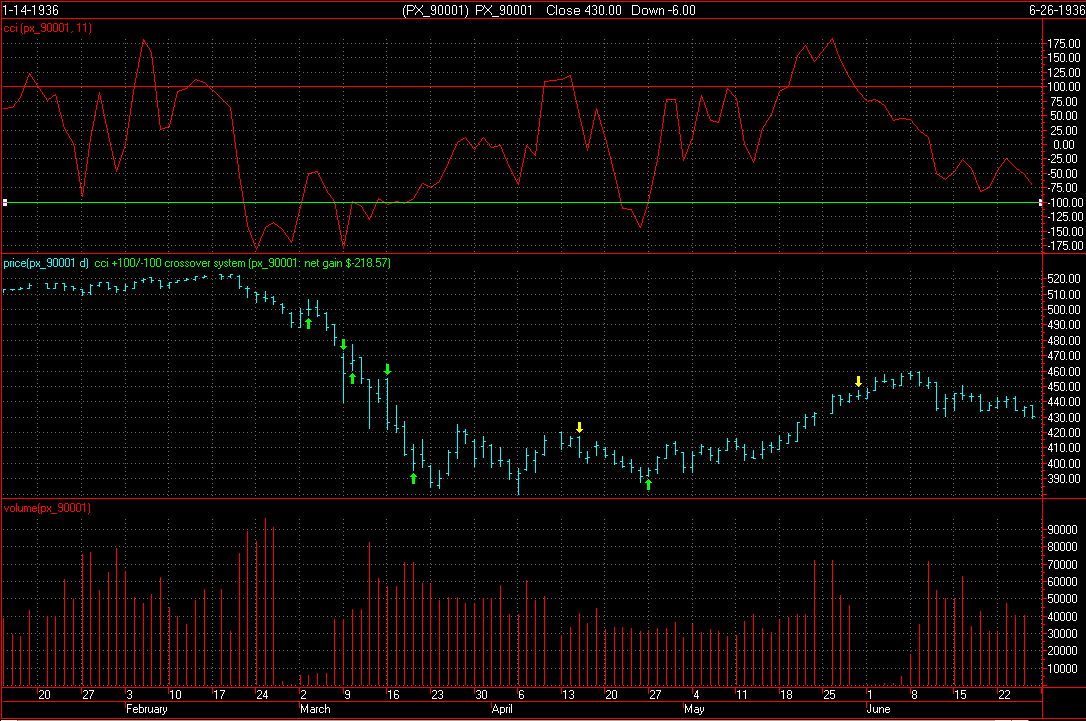
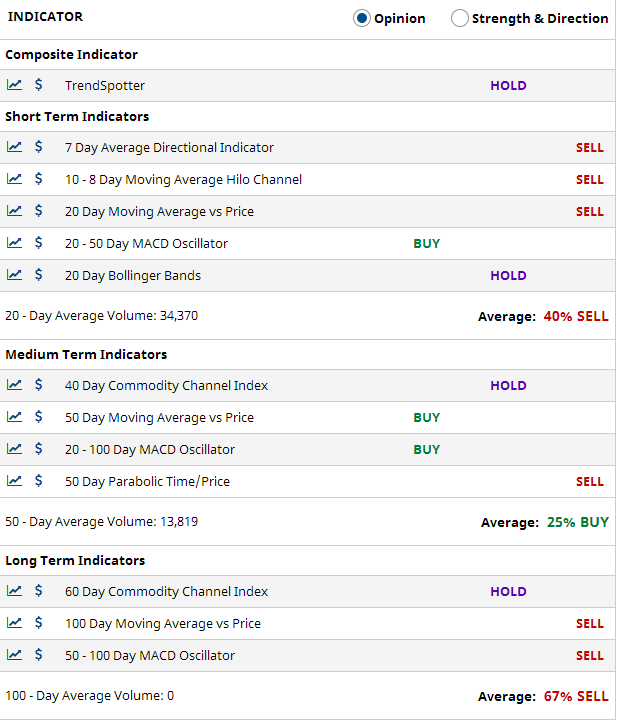
Our best-performing internal program is "Thrust". It is giving a sell signal.
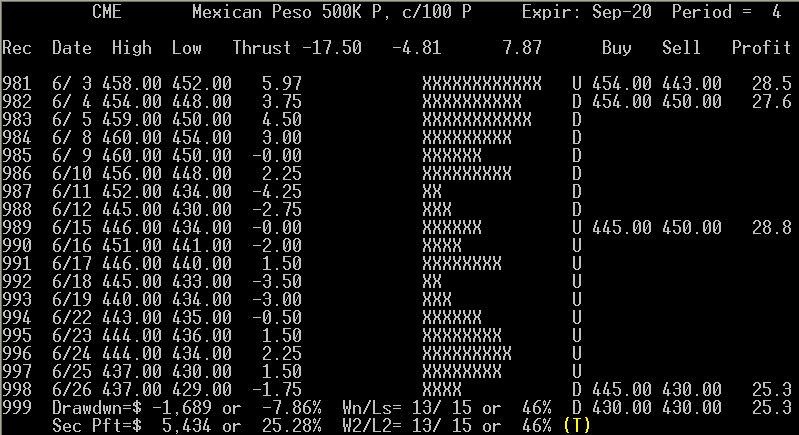
Results of "Thrust" for Mexican Peso (blue lines = successful trades, red, unsuccessful):
(Always in the market.)
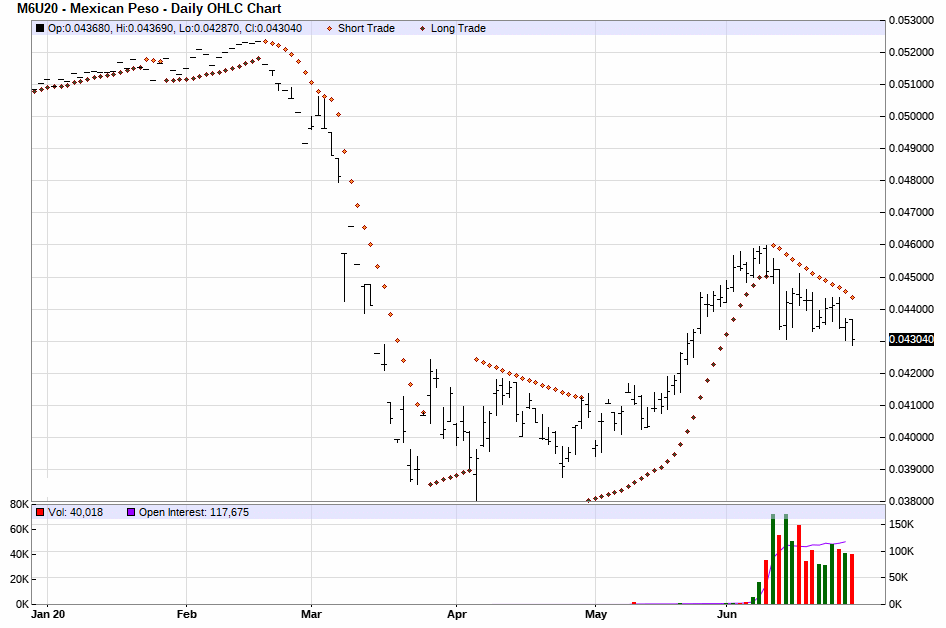
Our third system has triggered a sell signal. (Note, disregard the year on the chart. Our regular readers know this is not a Y2K-compliant system, but it still works.)
The point value is $50. Initial margin on a single contract is $ 2,090. Use of options is advised where available..
Scale trade buyerss are entering the market for the long term in this price range. Beware though, this indicator works best for commodities with a cost of production which currencies do not have.
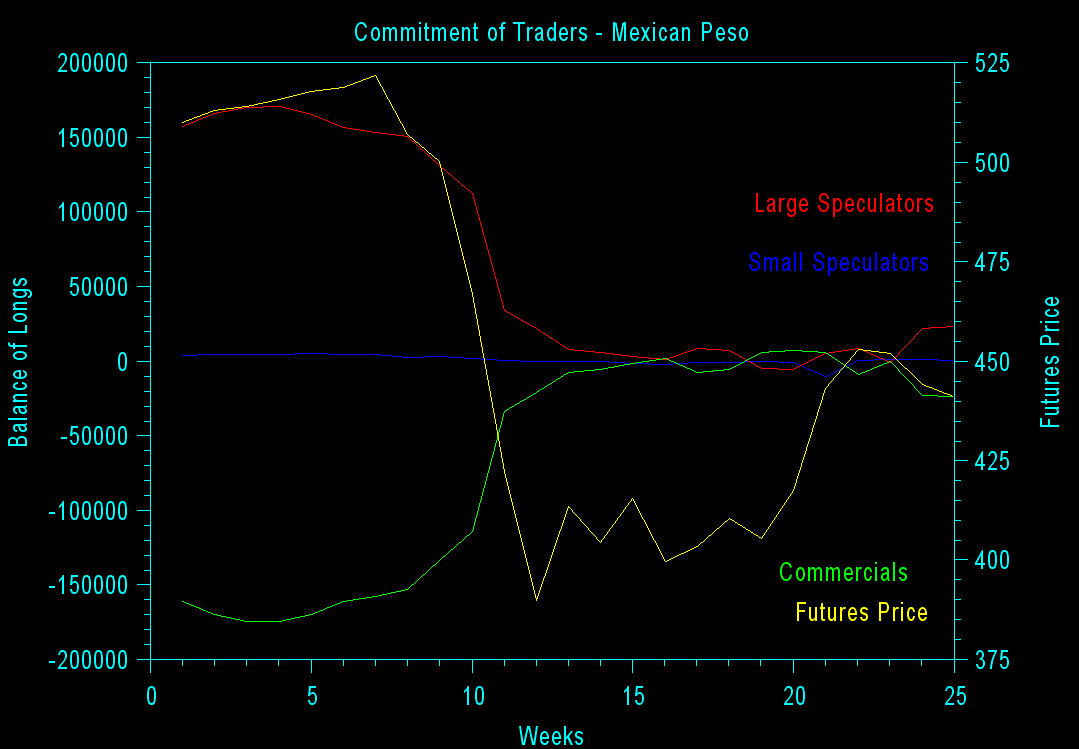
In the chart below, the yellow line is the futures price, read on the right axis. All other colors are read on the left axis. Blue is small speculators. Red is large speculators. Green is commercials. Large speculators with the best track record are getting increasingly-long.
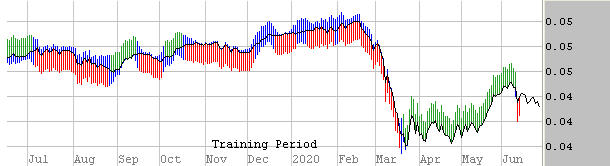
The average volatility shown below suggests that a downtrend remains intact from the last volatility low point.
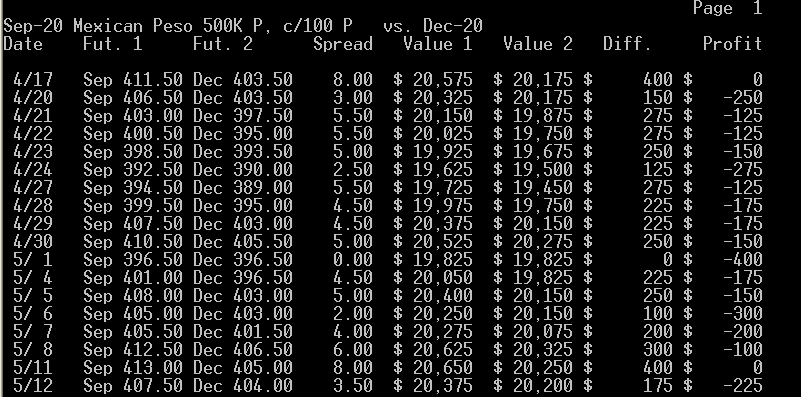
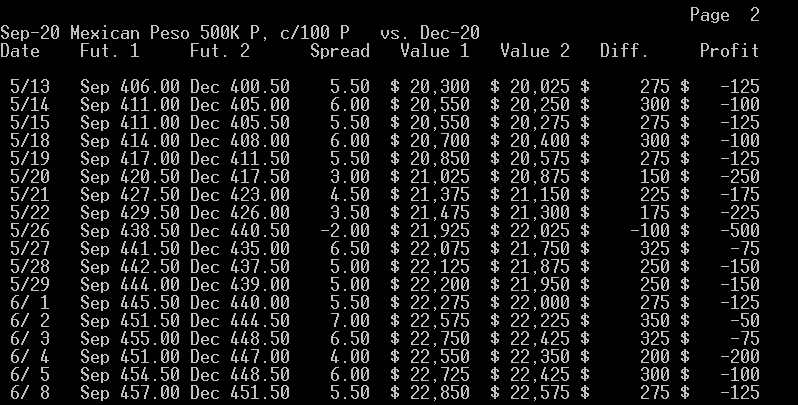
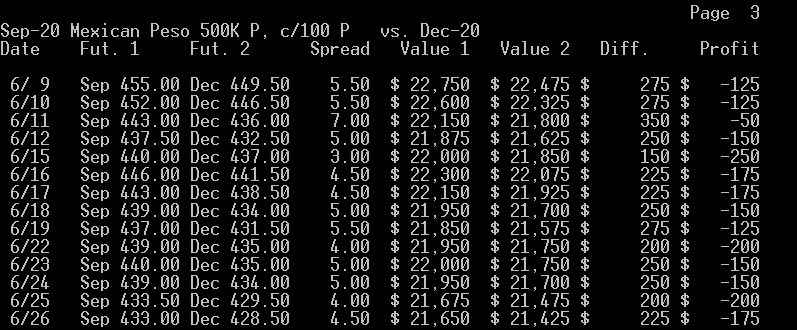
What the Sep. - Dec.. calendar spread suggests to us is that buying the near contract and selling the far one is at most times not profitable, which we think is a sign that these futures may go down in the long run. The best time to enter or leave the above spread is when it is at 0.00 or narrower selling the far as prices are falling and then buying the near, and exiting or entering when it is at +5.00 or wider buying the far as prices are rising and then selling the near. At this time, we appear to be close to the sell the near, buy the far point.
To view the chart below correctly use Microsoft Internet Explorer.
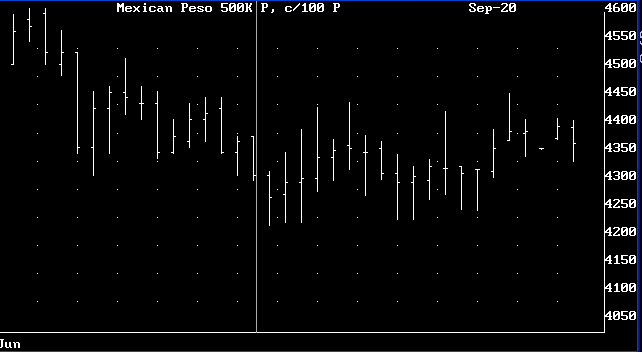
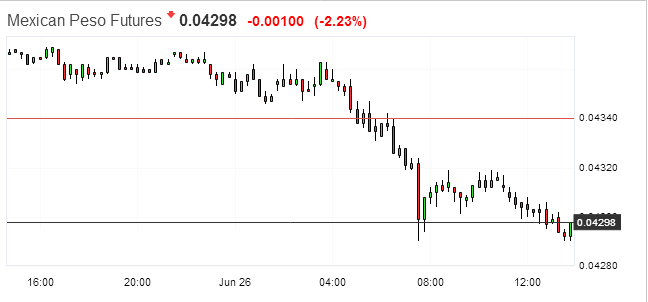
Here's an intraday chart for a previous day (6/29).
Introduction
 It appears to us as the "perfect storm" for the Mexican Peso, after years of being one of the currencies paying the highest interest rate. Trouble in Mexico with everything from the pandemic to corruption, public violence, and Trump's wall and tariffs, was topped by the Bank of Mexico finally conceding Mexico's fragile economy needed stimulus and a drastic interest rate cut. The interest rate cut seems to be the main element that could send the Peso's exchange rate spiraling downward as investors turn to other currencies.
Intermarket Analysis

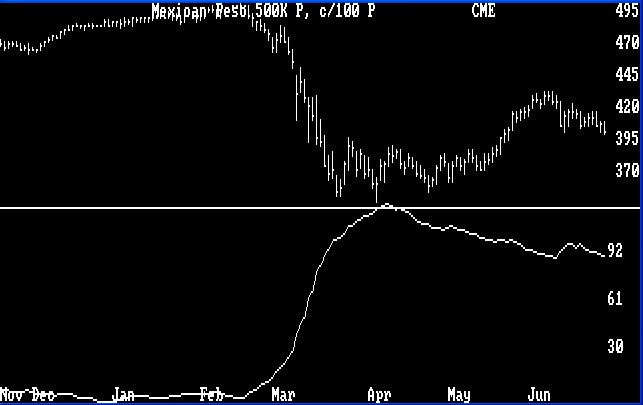
Parabolic Chart
Nirvana Chart
News Analysis
Point & Figure Chart
525.0|                                                                  T  6/26
     | CME - Sep-20 Mexican Peso 500K P, c/100 P   Cm.=0.01  Lim.= 0.6
     |                           X
     |                           XO
     |                           XO
505.0|___________________________XO____________________________________________
     |                           XOX
     |                           XOXO
     |                           XOXO
     |                       X X XO O
485.0|_______________________XOXOX__O__________________________________________
     |             X     X   XOXOX  O
     |             XOX   XO  XOXOX  O
     |         X   XOXOX XO  XOXOX   X
     |         XO  XOXOXOXO  XO O    XO
     |         XO  XOXOXOXO  XO O    XO
465.0|_________XO__XOXOXOXO__X_______XO________________________________________
     |         XO  XOXO OXO  X      OXO
     |         XOX XOX  O OX X      OXO
     |         XOXOXOX    OXOX      OXO          X
     |         XOXOXOX    OXOX      OXOX         XO
445.0|_________XOXOXOX____OXOX______OXOXO________XOX___________________________
     |   X   X XO OXOX    O O       O OXO        XOXO
     |O  XO  XOX  OXOX                OXO        XOXO
     |OX XO  XOX  O OX                OXO        XO O
     |OXOXO  XO     OX                OXO        X  O
425.0|OXOXO__X______OX________________O_O________X_____________________________
     |OXOXO  X      O                   OX       X
     |OXO O  X                          OXO      X
     |OX  O  X                          OXOX X   X
     |O   O  X                          OXOXOXOX X
405.0|____O__X__________________________OXOXOXOXOX_____________________________
     |    O  X                          OXO OXOXOX
     |    OX X                          OX  OXOXO
     |    OXOX                          OX  OXOX
     |    OXOX                          OX  OXO
385.0|____OXOX__________________________O___OX_________________________________
     |    O OX                              O
     |      OX
     |      O
     |
365.0|----|----|----|----|----|----|----|----|----|----|----|----|----|----|---
       11111    111       1111
      80111111450121468899011256892333333333444455666
      21000102210221221201000231002000111233001200111
      20279545655210013743469010694359126501176918168
The above chart is giving a conventional sell signal.
Cyclical and Seasonal Factors
Internal Program
Third System Confirmation
Margin
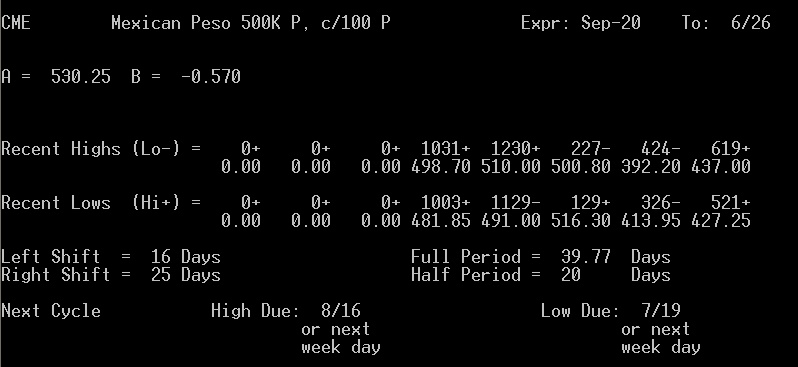
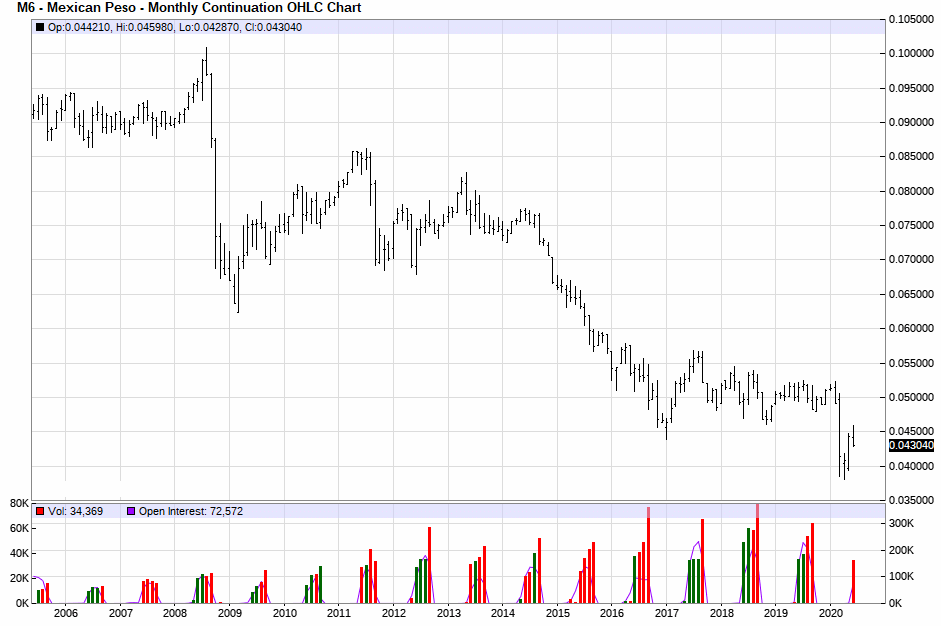
Historic Range
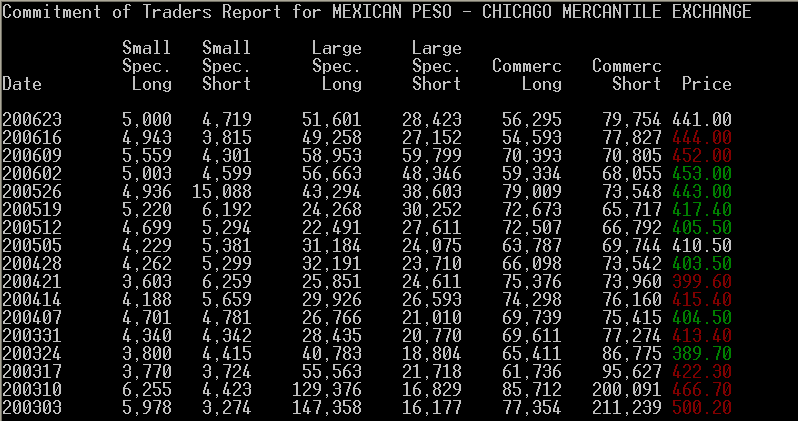
Commitment of Traders
Volatility / Probable Range
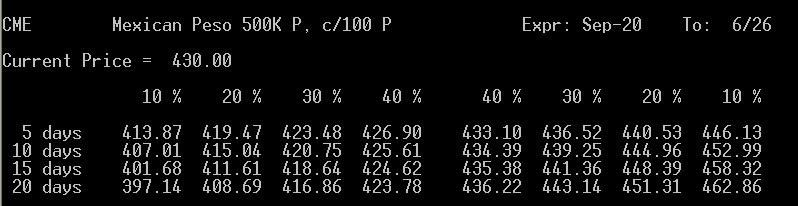
Possible Future Prices
Calendar Spread
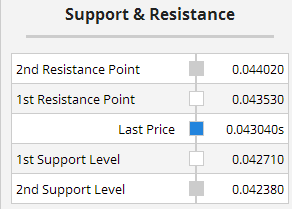
Level Table:
535.0|                                                                  T  6/26
 CME - Sep-20 Mexican Peso 500K P, c/100 P   Cm.=0.01  Lim.= 0.6
     |
     |
     |QRR
515.0|QQQQQQR__________________________________________________________________
     |OOPPPPPPPPPQQQQRR
     |NNNNOOOOOOOOPPPRRR
     |MMMNNNNNNOORRRS
     |JKMMRSS
495.0|HHHJJJJJJJJJKKKKKKKMMMMRRSS______________________________________________
     |AAAAABBBBBBBBCCCHHHKKKLLLLLMRRS
     |AAAABBCCFFFHKLLLLLLMRRS
     |AACCCDFFFFFFGGGGHHHSS
     |CCDDDDEEFGGGGS
475.0|CCCCDDDDDDDEEGGS_________________________________________________________
     |DDDEEES
     |EEEEEESS
     |ESSS
     |SSS
455.0|SSYYY____________________________________________________________________
     |SSSYYYYYY
     |SSSSYYYYYZZ
     |SSSSYYYZZ
     |SSSSXXYYYZZZZZZZZZ
435.0|SSXXZZZZZZZZ_____________________________________________________________
     |SSTXZZZZZZZ[[
     |SSTXXZ[[
     |SSTTXX   <<<
     |SSTTTXX
415.0|TTTUXX___________________________________________________________________
     |TTTTTUUUUVWWXXX
     |TTTTTUUUUUVVWWWWWWXXX
     |TTTTTTUUUUUUVVVVVWWWWWWWXXX
     |TTTTTUUUUVVVVWWWWWWXX
395.0|TTTTUUUUUVVVVWW__________________________________________________________
     |TTTTUUUUVVVVWW
     |TTUUVV
     |TTUV
     |TU
375.0|U________________________________________________________________________
     |
     |
     |
     |
355.0|-A-B-C-D-E-F-G-H-J-K-L-M-N-O-P-Q-R-S-T-U-V-W-X-Y-Z----|----|-- TPO=-0.194
                     1 1 1 1 1 1
       7 7 7 8 8 9 9 0 0 1 1 2 2 1 1 2 2 3 3 3 4 4 5 5 6 6           6
       0 1 2 1 2 1 2 0 2 0 1 0 1 0 1 0 1 0 1 3 1 2 1 2 1 2           2
       1 5 9 2 6 0 4 8 2 5 9 4 8 3 7 3 8 3 7 1 5 9 3 8 1 5           6
Other Factors
                 Risk Versus Opportunity Report
                ________________________________

                 PXU0    September Mexican Peso

                      High Price:  446.13
                   Current Price:  430.00
                       Low Price:  397.14

                            Risk: -0.077
                     Opportunity: -0.156

                    (O/R) Ratio =  2.037