![]()
Corporate Webpages Copart, Inc.
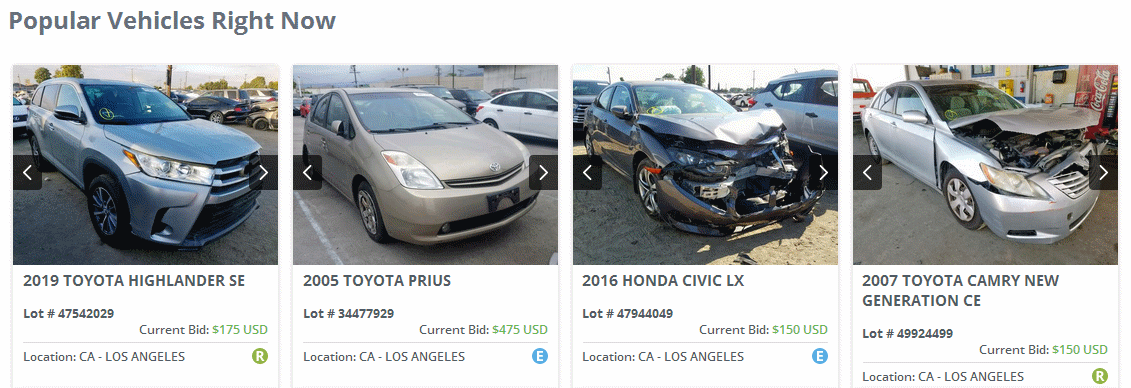
Would you buy a wreck for a used car? Apparently, many people
do. So many people do this in fact, that their business
supports various auction sites all across the world. Copart,
Inc. (CPRT) is one of the leading provider of auction sites,
wrecking yards, and used parts sales. Insurance companies like
more efficient service from salvagers. Even cars that have been
labeled "totaled" find buyers waiting to rebuild them. They can
be obtained for what seem like ridiculously low prices through
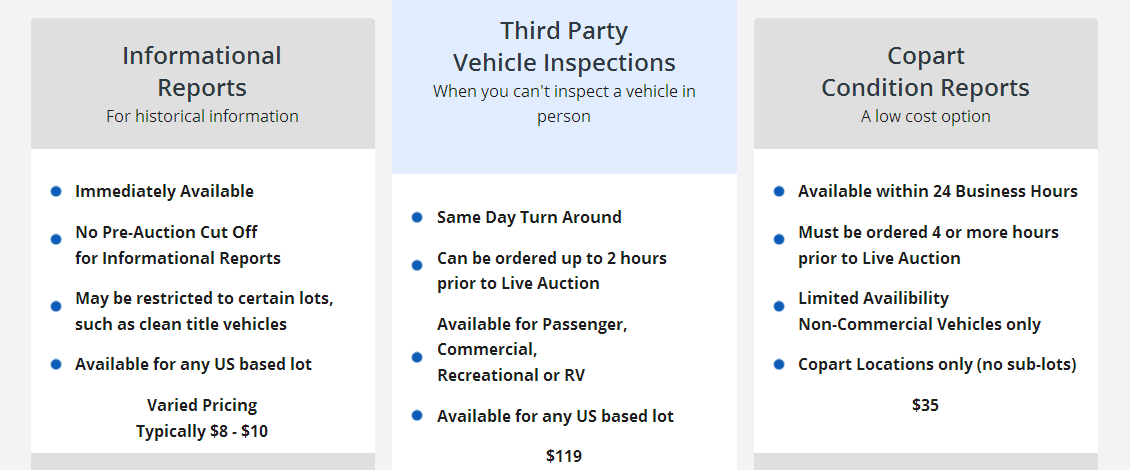
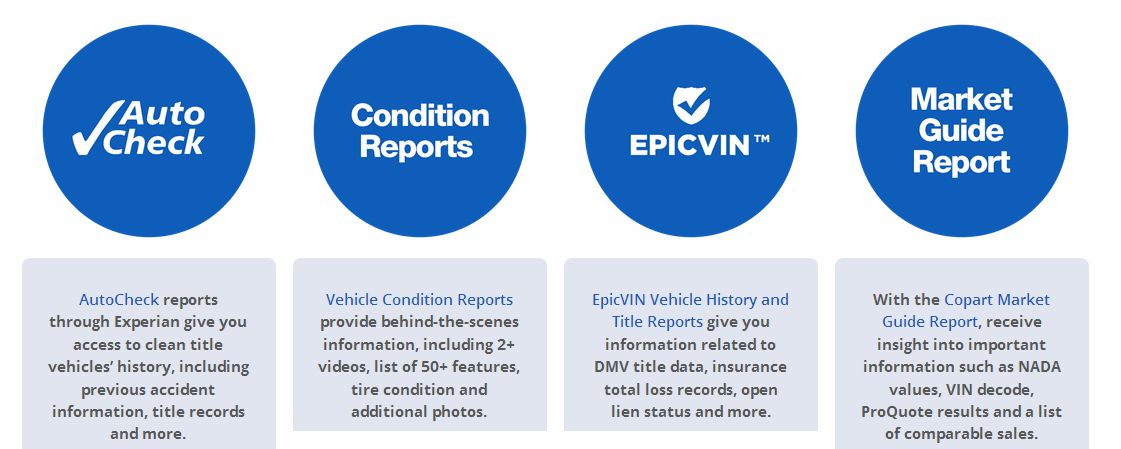
an auction bidding system. Buyers of a "wreck" find inspectors
working through companies to check out cars to see exactly upon
what they are bidding and anticipate the ultimate fixup costs.
Copart has a good website, CEO Letter, and although it pays no
dividends shows concern for shareholders and is expanding
rapidly all over the world from its Texas base. Management seems
reasonable compensated in good corporate governance. News for this
company is a steady stream of PR announcements of new site
openings or expanding acreage for existing sites to deal with
more and more cars. The way people drive these days, many if
not most without ever having taken a defensive driving course in their
lives, or if in areas like L.A. drive with little fear of any
interference by local police for speeding and reckess driving.
The company could be classified either as an auto dealership or
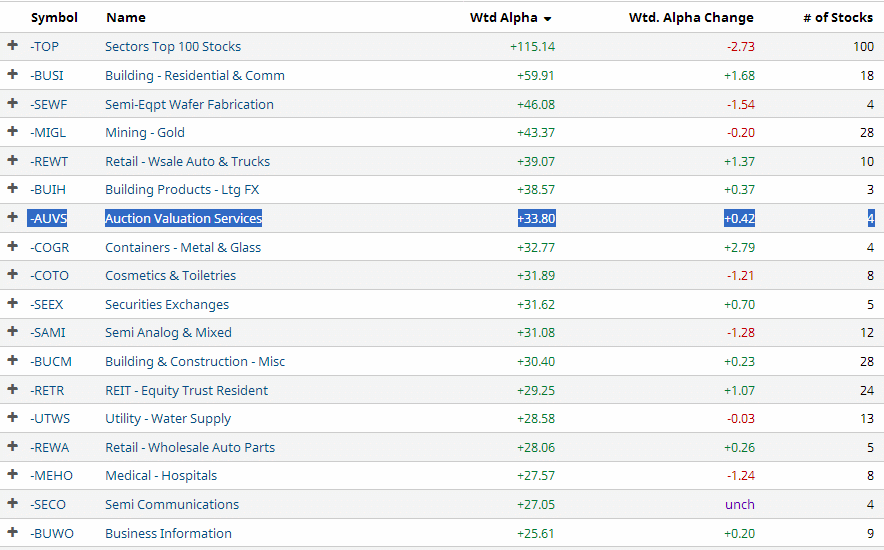
an auction site. Auction operations are in a strong performing
industry group lately.
Some researchers including Standard & Poor's are reserved on the
stock, as the stock has seen a huge rise in recent years and no
sign of stopping further growth, putting a little stress on
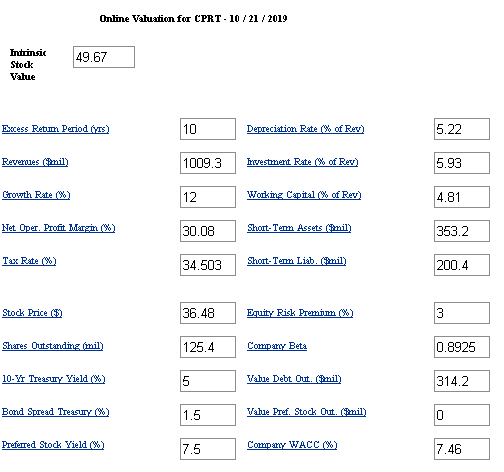
valuation. Intrinsic values are high. The Zenith Index is
passable indicating reasonable fundamentals, although the p/e
seems a little high to us at this point.
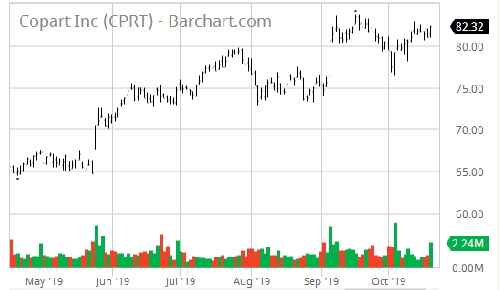
Institutions and some technical evaluation methods think the
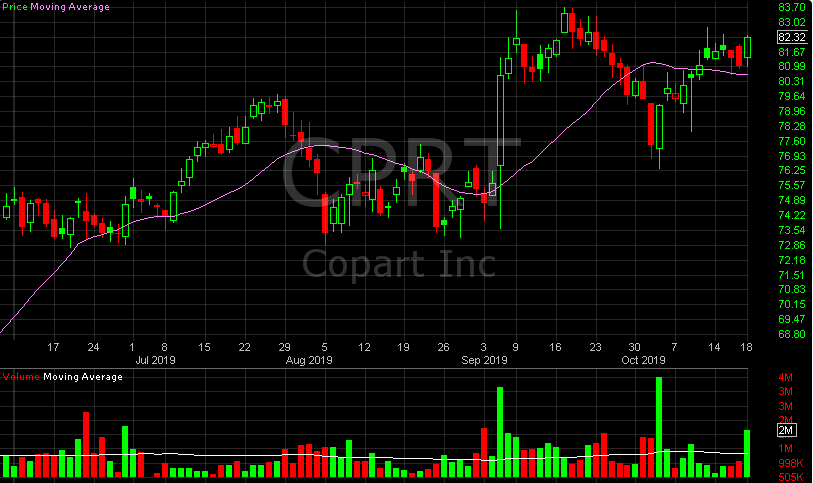
stock is showing signs of being a little "toppy." We think the
stock could drop back into a trading range as far down as $55 to
$70 per share from its lofty height of $83. But one shouldn't
hold his breath on that as so far the stock continuously looks
like a "buy and hold."
(WAIT FOR PAGE TO LOAD COMPLETELY BEFORE LINKS WORK.)
Company Profile
Company History
News
Comparison with Peers
Bond Issue
Zenith Index
Financial Statements
Avg. P/E to Current P/E
Financial Ratios
Intrinsic Value (Disc. CashFlow)
Fair Value Estimator
Projected Earnings
Research Reports
Analysts' Opinions
Insider Activity
Institutional Activity
Sentiment
Short Interest
Standard & Poor's
Management's Discussion
Channel Potential
MACD Histogram
Intraday Chart
Val Idea
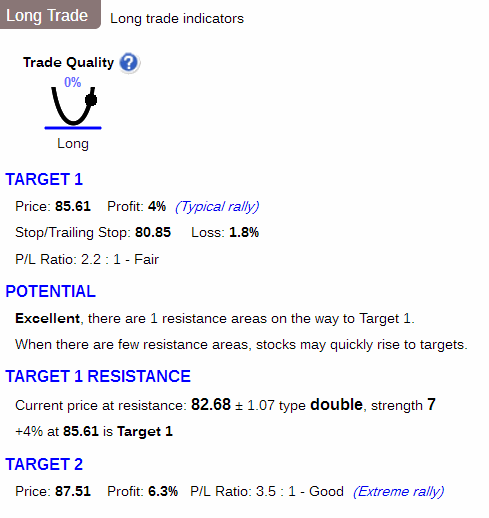
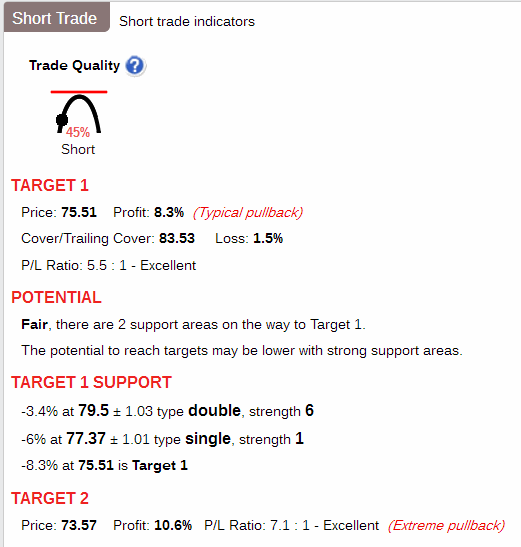
Stock Consultant
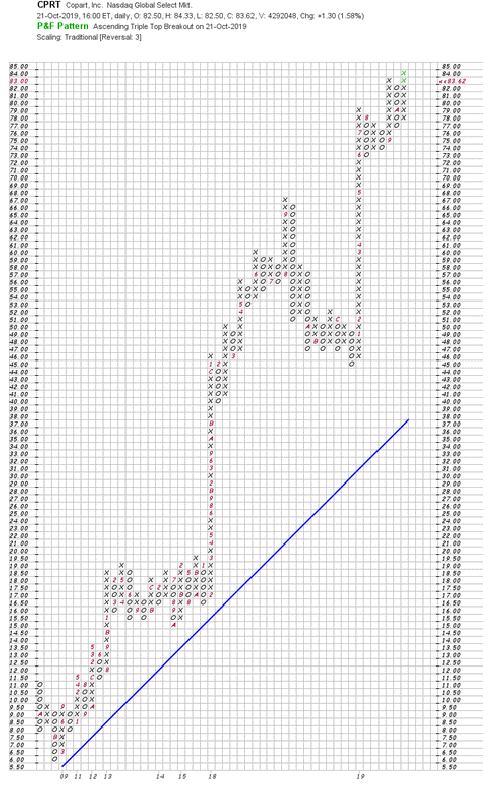
Point & Figure Chart
Wall Street Analyzer
Marketspace Chart
Time Series Forecast
Neural Network Prediction
Stock Options
Ultimate Trading Systems
Recommendation















Company Profile |

Company History |
News |
Comparison |
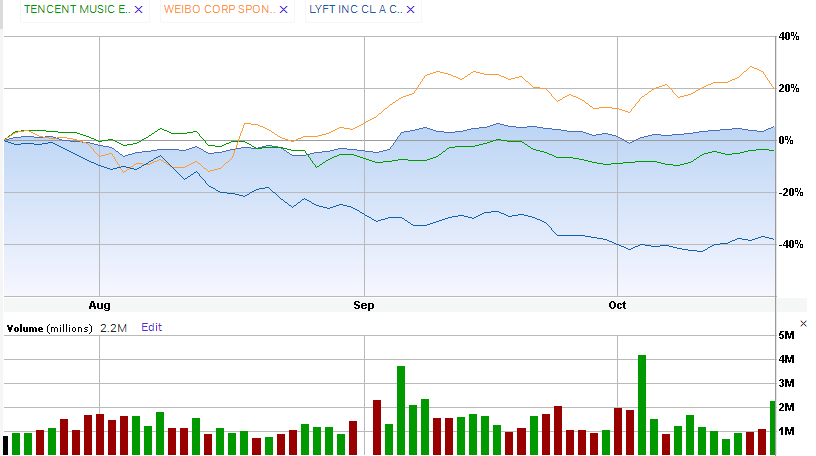
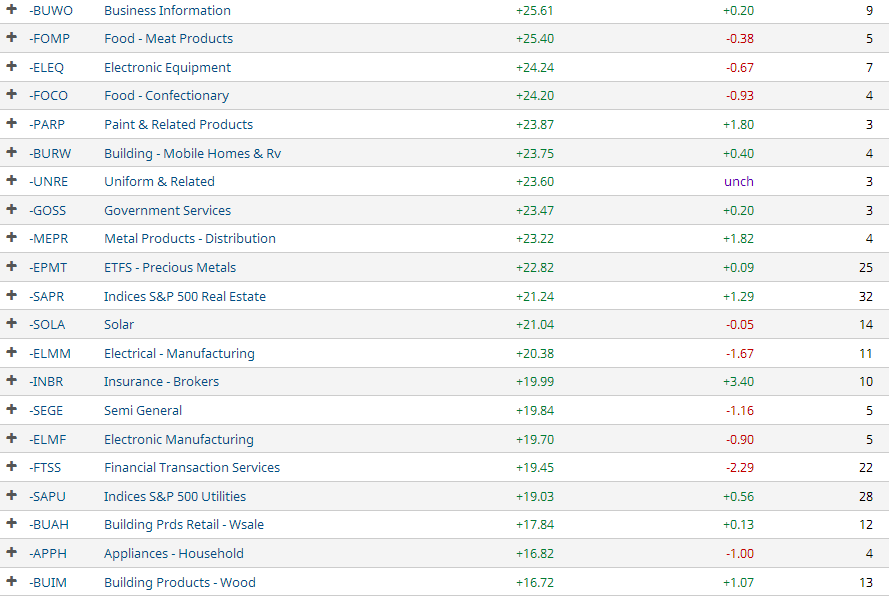
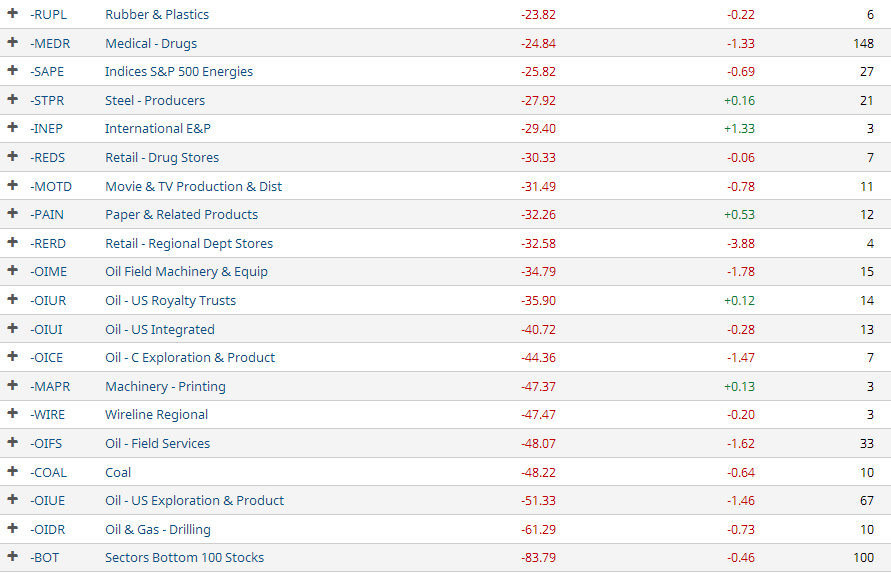

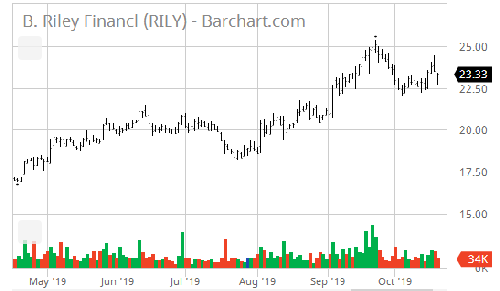
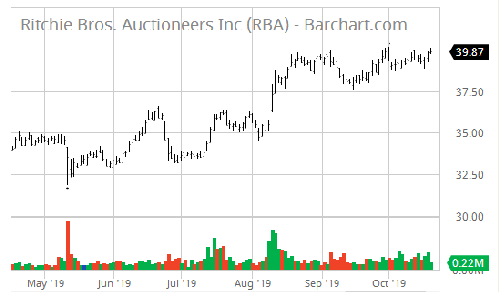
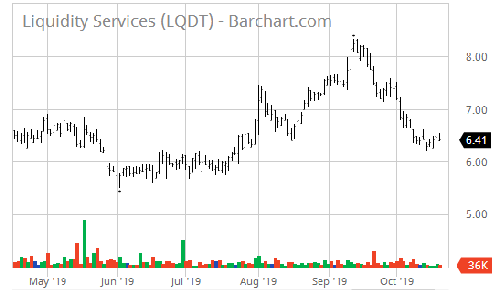
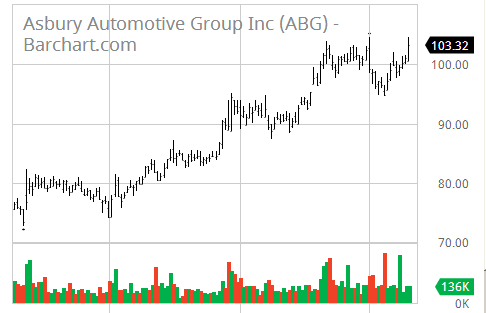
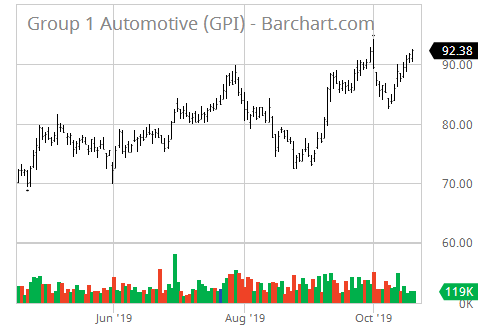
Similar Companies Performance:
Bond Issue |

Zenith Index |
Under current market conditions, a Zenith Index Score of 1.20 or above is required for a positive rating on this factor. 1.21 -1.30 is considered acceptable, 1.30-1.40 is considered strong and
> 1.40 is considered exceptionally strong. Accounting statements in this section often contain mistakes, especially in earlier years' totals, but data is deemed sufficient for us to give a rating. More accurate financial statements follow in the next section.
Copart, Inc. (CPRT)                                       Exchange: Nasdaq
14185 Dallas Parkway
Suite 300                        Sector: Consumer Cyclical
Dallas, TX 75254                 Industry:Auto & Truck Dealerships

Copart, Inc. provides online auctions and vehicle remarketing services.
It offers a range of services for processing and selling vehicles over
the Internet through its Virtual Bidding Third Generation Internet
auction-style sales technology to vehicle sellers, insurance companies,
banks and finance companies, charities, and fleet operators and dealers,
as well as for individual owners. The company's services include online
seller access, salvage estimation, estimating, end-of-life vehicle
processing, virtual insured exchange, transportation, vehicle inspection
stations, on-demand reporting, title processing and procurement, loan
payoff, flexible vehicle processing programs, buy it now, member
network, sales process, and dealer services. Its services also comprise
services to sell vehicles through CashForCars.com; and U-Pull-It service
that allows buyer to remove valuable parts, and sell the remaining parts
and car body. The company sells its products principally to licensed
vehicle dismantlers, rebuilders, repair licensees, used vehicle dealers,
and exporters, as well as to the general public. As of September 4,
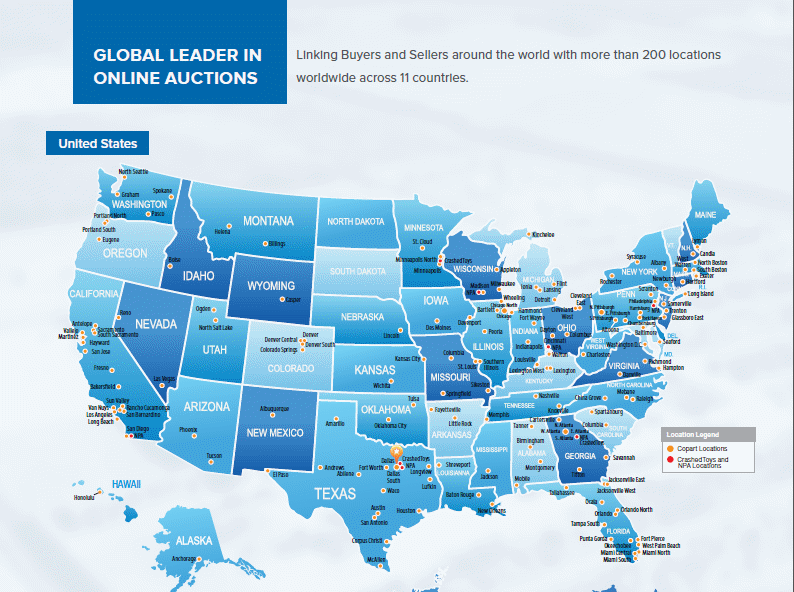
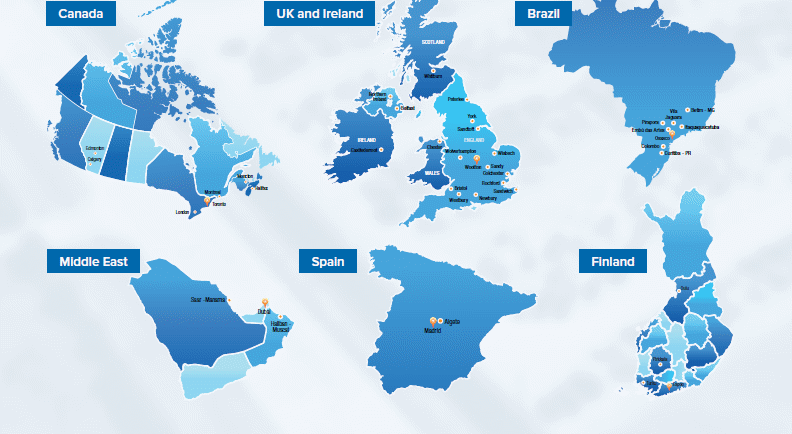
2019, it operated through approximately 200 locations in 11 countries.
Copart, Inc. was founded in 1982 and is headquartered in Dallas, Texas.

Last Trade:  82.32                           52-Week Range:  84.33 -  44.61
Employees: 7,327                             Avg.Volume:   1,385,553 Shares

Corporate Governance:
Pllar scores are Audit: 2; Board: 10; Shareholder Rights: 2; Compensation: 9.
         (A lower number means less governance risk.)

EPS:  2.46    Dividend Amount: $ 0.00          Yield:  0.00%
             Ex-Dividend Date:          N/A           Payout Ratio:   0.00

Key Statistics:

    Trailing P/E:  33.99              Forward P/E (est.):  28.25
                                           Target Price:  87.50

Qrtly Stock Price Growth (yoy):  63.07%               Beta:   0.00
Qrtly S&P Index   Growth (yoy):  20.80%        Short Ratio:   2.68%
    Qrtly Revenue Growth (yoy):   8.36%         Shares Out:  232250000
   Qrtly Earnings Growth (yoy):  39.90%

          Book Value:   7.74                    Debt/Equity:  22.56%
    Price/Book Value:  10.81        Operating Profit Margin:  35.09%
         Price/Sales:   9.51                  Profit Margin:  28.98%
         Market Cap:  19,421,000,000       Return on Equity:  35.22%
    Enterprise Value:  19,120,000,000      Return on Assets:  18.45%

    Operating Cash Flow:    646,650,000
         Free Cash Flow:    108,820,000


Annual Income Statement:                          (All numbers in thousands)
  Period Ending                              7/31/2019   7/31/2018   7/31/2017

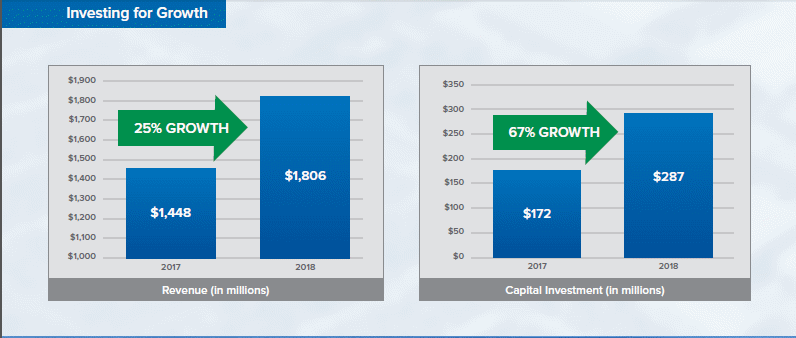
  Total Revenue                              2,041,957           0   1,805,695
  Cost of Revenue                                    0   1,143,615           0
  Gross Profit                                 723,863           0     898,342

Operating Expenses:
  Research & Development                             0           0           0
  Selling, General & Administrative                  0     176,890     151,364
  Total Operating Expenses                           0     176,890     151,364

Operating Income or Loss                             0     585,476     480,664

Income from Continuing Operations:
  Total Other Income/Expenses Net                    0      -3,890     -18,191
  Interest Expense                                   0      20,368      23,779
  Income Before Taxes                                0     562,511     440,100
  Income Tax Expense                                 0      45,839     125,505
Net Income from Continuing Op.s                591,693           0     418,007

Net Income Avail to Common Shares                    0     417,867     394,227

Annual Cash Flow Statement:                   (All numbers in thousands)
  Period Ending                          7/31/2019     7/31/2018     7/31/2017

  Net Income                               591,693             0       418,007

Operating Activities:
  Depreciation                              79,040        57,441        49,643
  Accounts Receivable                      -40,335       -38,542       -54,213
  Changes in Liabilities                    -8,205       -20,792       -16,125
  Inventories                               -3,959         1,294        -2,509
  Changes in other Oper'g Acts             247,159       319,880       158,581

Total Cash Flow f Operations               535,069       492,058       332,498

Investing Activities:
  Capital Exenditures                     -287,910      -172,178      -173,917
  Investments                             -287,910      -172,178      -173,917
  Other Cash Flows fr Investing                  0           105           100

Total Cash Flows from Investing           -288,476      -335,791      -172,876

Financing Activities:
  Dividends Paid                                 0             0             0
  Sale of Purchase of Stock                      0             0      -457,894
  Net Borrowings                          -231,000        -7,000      -337,500
  Other Cash Flows fr Financing             -1,350      -135,433           100

Total Cash Flows from Financing           -182,038      -106,975      -448,496

Change in Cash & Cash Equiv.                64,420        54,251      -300,163


Annual Balance Sheets:                              (All Numbers in Thousands)
  Period Ending                           7/31/2019     7/31/2018     7/31/2017
Current Assets:
  Cash & Cash Equivalents                   186,319       274,520       210,100
  Short Term Investments                          0             0             0
  Net Receivables                           367,265       125,255       110,189
  Inventory                                  20,941        16,734        10,163
  Other Current Assets                            0        51,018        41,281
  Total Current Assets                      574,525       379,326       347,952
Non-current Assets:
  Long-Term Investments                      43,836        32,560        33,716
  Property, Plant & Equipt                        0     1,653,545     1,396,050
  Goodwill                                  333,321       337,235       340,243
  Intangible Assets                          55,156        64,892        75,938
  Accumulated Amortization                        0      -490,120      -451,994
  Other Assets                               43,836        32,560        33,716

Total Assets                              2,547,617     2,307,698     1,982,501

Current Liabilities:
  Accounts Payable                          270,918       133,717        71,160
  Taxes Payable                               3,482           673         6,472
  Other Current Liabilities                       0        62,443        50,603
  Total Current Liabilities               2,366,960       184,993      1,933,930

  Long Term Debt                            270,918       133,717        71,160
  Deferred LT Liab. Charges                       0        62,443        50,603

Total Liabilities                         2,920,943       738,976     2,487,913

Stockholder Equity:
  Common Stock                                   23            23            23
  Retained Earnings                       1,338,328     1,162,146       745,370
  Other Stockhohlder Equity                -132,529      -107,928      -100,676
  Total Stockholder Equity                1,778,381     1,778,381     1,778,381

Net Tangible Assets                       2,547,617     2,307,698     1,982,501


Copart, Inc. (CPRT)                         [Indices near +3.0, near zero,
                                            or < zero bear special attention.]
P/E Ratio Tests:
P/E Ratio < 28?            0.8238          P/E Ratio > 5?             1.0000
P/E Ratio Vs Growth Rate:  3.0000          Forward P/E Ratio < 28?    0.9912
Price/Sales Ratio < 2.3?   0.2419          Inventory/Sales < 5%?      3.0000
Sales < $1 Billion?        0.4897          Operating Margin < 7.5%?   0.2137

Balance Sheet Tests:
Debt/Equity < 0.40?        1.7730          Long-Term Debt Service:   -0.9331
LTD Being Reduced?         0.0000          Short-Term Debt Service:   3.0000
Current Ratio > 2?         0.1214          Working Capital >= 1.5?    3.0000
Leverage Ratio < 20%?      0.2872          Debt/Assets < 1?           3.0000
Quick Ratio > 1?           3.0000          Inventory Turnover > 1?    1.0000
Share Equity Increase:     2.0000          Market Cap.< 1.5 Billion?  0.0772
                                           Intangibles < 3% Assets?   0.1967
Income Tests:
Profit Margin < 7.5%?      3.0000          EPS Annual Growth > 10%?   0.0943
Dividend Yield > 2.0%?     0.0000          EPS 3-yr Growth > 15?      0.1415
Enterprise Value/Revenue   3.0000          EPS Growth Consistent?     0.0000
Enterprise Value/EBITDA:   3.0000          Collection < 45 days?      0.6855
EPS Qrtly Growth > 10%?    0.0025          Gross Pft / LTD > 1?    1.8092
                                           Borrowing Int. Rate < 6%?  3.0000
Stock Performance Tests:
Volatility > 25%?          1.8840          % Held by Insiders < 5%?   0.3873
Beta > 1.25?               0.0000          % Held by Institut. < 50?  0.5752
50 Da MA > 200 Da MA?      0.2402          % Held by Institut. > 30?  2.8977
52-Wk Change vs. S&P 500:  3.0000          Short Ratio > 5?           0.5360
Price/Book Value < 3?      0.2821          Short % of Float > 20?     0.1070
Return on Assets > 17%?    1.0853          Average Volume > 100,000?  3.0000

Cash Flow Tests:
Oper. C.F. > Lever'd C.F:  3.0000          Positive Free Cash Flow?   3.0000
Positive Oper. Cash Flow?  3.0000          Price to C.F.Ratio < 14?:  0.7249
                                           Cash Flow / Assets > 10%?  3.0000

CPRT   Copart, Inc.                        Overall Zenith Index:      1.3825
Financial Statements |
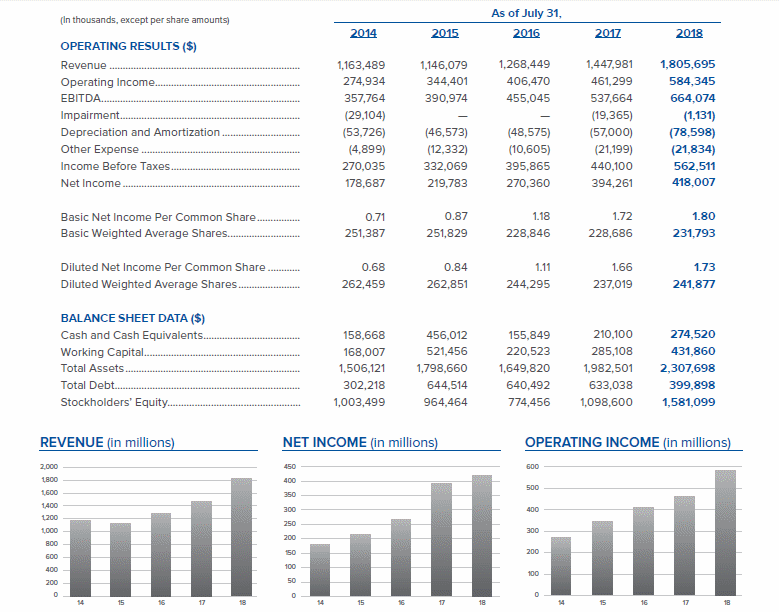
COPART INC (CPRT) INCOME STATEMENT Fiscal year ends in July. USD in thousands e 2015-07 2016-07 2017-07 2018-07 2019-07 TTM Revenue 1,146,079 1,268,449 1,447,981 1,805,695 2,041,957 2,041,957 Cost of revenue 662,703 723,863 815,953 1,043,329 1,143,615 1,143,615 Gross profit 483,376 544,586 632,028 762,366 898,342 898,342 Operating expenses Sales, General and administrative 138,975 138,116 151,364 176,890 181,867 181,867 Total operating expenses 138,975 138,116 151,364 176,890 181,867 181,867 Operating income 344,401 406,470 480,664 585,476 716,475 716,475 Interest Expense 18,121 23,606 23,779 20,368 19,810 19,810 Other income (expense) 5,789 13,001 -16,785 -2,597 8,286 8,286 Income before income taxes 332,069 395,865 440,100 562,511 704,951 704,951 Provision for income taxes 112,286 125,505 45,839 144,504 113,258 113,258 Minority interest 0 0 34 140 0 0 Other income 0 0 34 140 0 0 Net income from continuing operations 219,783 270,360 394,261 418,007 591,693 591,693 Other 0 0 -34 -140 0 0 Net income 219,783 270,360 394,227 417,867 591,693 591,693 Net income available to common shareholders 219,783 270,360 394,227 417,867 591,693 591,693 Earnings per share Basic 0.88 1.18 1.72 1.80 2.57 2.57 Diluted 0.83 1.10 1.66 1.73 2.46 2.46 Weighted average shares outstanding Basic 251,828 228,846 228,686 231,793 230,489 230,489 Diluted 262,850 244,294 237,019 241,877 240,453 240,453 ____________________________________________________________________________________________________________________________________________ COPART INC (CPRT) BALANCE SHEET Fiscal year ends in July. USD in thousands e 2015-07 2016-07 2017-07 2018-07 2019-07 Assets Current assets Cash Total cash 456,012 155,849 210,100 274,520 186,319 Receivables 221,788 285,021 318,264 366,913 386,791 Inventories 8,613 10,388 10,163 16,734 20,941 Deferred income taxes 3,396 1,444 0 0 0 Prepaid expenses 19,824 18,005 17,616 16,665 16,568 Other current assets 24,949 28,599 31,118 34,284 76,548 Total current assets 734,582 499,306 587,261 709,116 687,167 Non-current assets Property, plant and equipment Land 481,748 556,780 629,826 762,524 939,817 Fixtures and equipment 180,042 185,982 210,699 280,057 338,916 Other properties 453,965 489,566 555,525 610,964 686,615 Property and equipment, at cost 1,115,755 1,232,328 1,396,050 1,653,545 1,965,348 Accumulated Depreciation -415,353 -415,537 -451,994 -490,120 -537,622 Property, plant and equipment, net 700,402 816,791 944,056 1,163,425 1,427,726 Goodwill 271,850 260,198 340,243 337,235 333,321 Intangible assets 17,857 11,761 75,938 64,892 55,156 Deferred income taxes 28,840 23,506 1,287 470 411 Other long-term assets 46,421 38,258 33,716 32,560 43,836 Total non-current assets 1,065,370 1,150,514 1,395,240 1,598,582 1,860,450 Total assets 1,799,952 1,649,820 1,982,501 2,307,698 2,547,617 Liabilities and stockholders' equity Liabilities Current liabilities Short-term debt 53,671 76,151 82,155 1,151 1,138 Accounts payable 57,517 76,953 71,160 133,717 113,947 Deferred income taxes 0 0 92 0 0 Taxes payable 8,279 5,625 6,472 673 3,482 Accrued liabilities 30,417 41,544 55,479 37,566 42,150 Deferred revenues 37,595 45,128 55,622 66,931 79,887 Other current liabilities 25,647 33,382 31,173 37,218 41,400 Total current liabilities 213,126 278,783 302,153 277,256 282,004 Non-current liabilities Long-term debt 592,135 564,341 550,883 398,747 400,091 Deferred taxes liabilities 5,322 3,816 3,192 19,733 48,683 Minority interest 0 0 534 0 0 Other long-term liabilities 24,905 28,424 27,673 30,863 38,458 Total non-current liabilities 622,362 596,581 582,282 449,343 487,232 Total liabilities 835,488 875,364 884,435 726,599 769,236 Stockholders' equity Common stock 12 11 23 23 23 Additional paid-in capital 407,808 392,445 453,349 526,858 572,559 Retained earnings 625,437 491,194 745,370 1,162,146 1,338,328 Accumulated other comprehensive income -68,793 -109,194 -100,676 -107,928 -132,529 Total stockholders' equity 964,464 774,456 1,098,066 1,581,099 1,778,381 Total liabilities and stockholders' equity 1,799,952 1,649,820 1,982,501 2,307,698 2,547,617 ____________________________________________________________________________________________________________________________________________ COPART INC (CPRT) Statement of CASH FLOW Fiscal year ends in July. USD in thousands e 2015-07 2016-07 2017-07 2018-07 2019-07 TTM Cash Flows From Operating Activities Depreciation & amortization 48,893 49,643 57,441 79,040 85,334 85,334 Investment/asset impairment charges 0 0 19,365 1,157 0 0 Deferred income taxes 4,365 5,740 19,901 16,717 23,167 23,167 Stock based compensation 18,154 20,864 20,840 23,221 23,445 23,445 Accounts receivable -20,417 -54,213 -38,542 -40,335 -60,808 -60,808 Inventory -1,731 -2,509 1,294 -3,959 -4,719 -4,719 Prepaid expenses 69 -738 1,760 -776 -204 -204 Accounts payable -3,926 48,347 4,269 53,320 11,126 11,126 Income taxes payable -1,971 2,788 -333 -3,149 10,669 10,669 Other working capital 6,324 -9,800 10,760 -13,306 -29,974 -29,974 Other non-cash items 215,316 272,376 395,303 423,139 588,610 588,610 Net cash provided by operating activities 265,076 332,498 492,058 535,069 646,646 646,646 Cash Flows From Investing Activities Investments in property, plant, and equipmen -79,153 -173,917 -172,178 -287,910 -373,883 -373,883 Property, plant, and equipment reductions 1,521 562 660 6,425 18,361 18,361 Acquisitions, net -4,500 0 -164,378 -6,991 -745 -745 Purchases of investments 0 -21,119 0 0 0 0 Sales/Maturities of investments 0 21,498 0 0 0 0 Other investing charges 217 100 105 0 0 0 Net cash used for investing activities -81,915 -172,876 -335,791 -288,476 -356,267 -356,267 Cash Flows From Financing Activities Long-term debt issued 698,939 331,468 0 0 0 0 Long-term debt repayment -350,000 -337,500 -7,000 -231,000 0 0 Excess tax benefit from stock based compe 2,971 0 0 0 0 0 Repurchases of treasury stock -237,306 -457,894 0 0 -364,997 -364,997 Other financing activities 5,758 15,430 -99,975 48,962 -5,307 -5,307 Net cash provided by (used for) financing 120,362 -448,496 -106,975 -182,038 -370,304 -370,304 Effect of exchange rate changes -6,179 -11,289 4,959 -135 -8,276 -8,276 Net change in cash 297,344 -300,163 54,251 64,420 -88,201 -88,201 Cash at beginning of period 158,668 456,012 155,849 210,100 274,520 274,520 Cash at end of period 456,012 155,849 210,100 274,520 186,319 186,319 Free Cash Flow Operating cash flow 265,076 332,498 492,058 535,069 646,646 646,646 Capital expenditure -79,153 -173,917 -172,178 -287,910 -373,883 -373,883 Free cash flow 185,923 158,581 319,880 247,159 272,763 272,763 ____________________________________________________________________________________________________________________________________________
Average to Current P/E Ratios |
              (CPRT)     Copart Inc.

                               2014    2015    2016    2017    2018

          Annual Earnings:     0.84    1.11    1.66    1.73    2.46
Average Price During Year:    17.51   17.93   22.96   31.85   52.06

                P/E Ratio:    20.84   16.16   13.83   18.41   21.16

 Average 5-Year P/E Ratio  =  18.08
             Current Price =  82.32

Previous 5 Quarter Earnings:   0.45    0.47    0.55    0.81    0.64

          Current Annualized (Last Four Quarters) Earnings =   2.00
                                                           ________
                                 Average PE / Current PE =     0.44
                                                           --------

                                      ...a number above 1.00 is good
                                                1.00 or below is bad
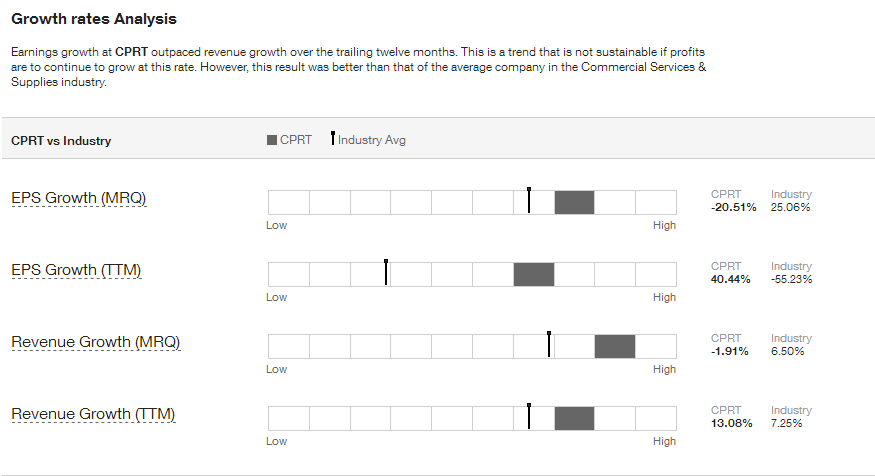
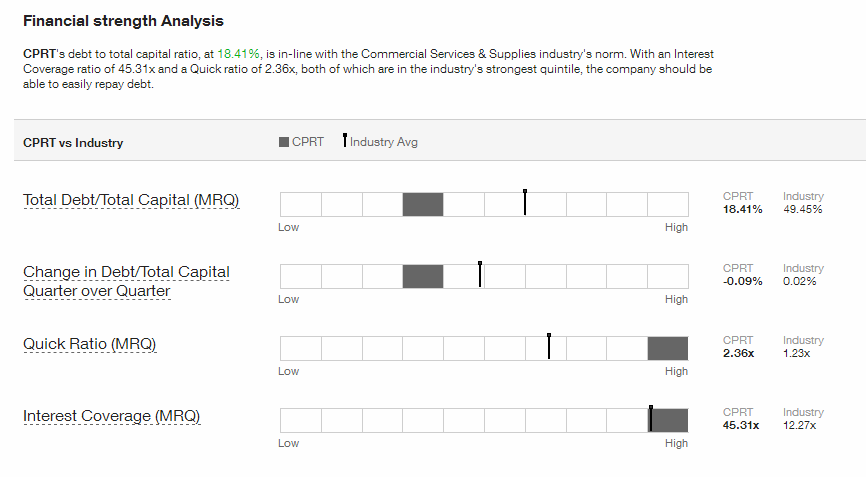
Financial Ratios |
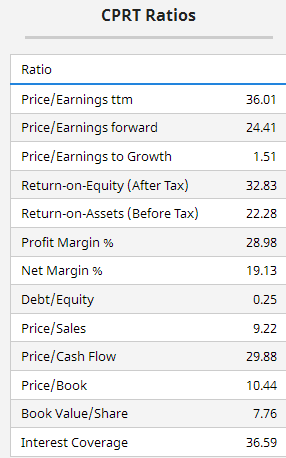
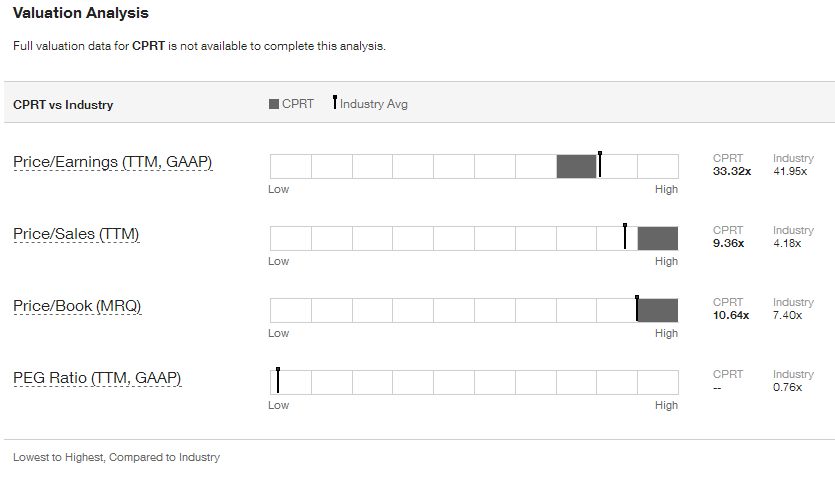
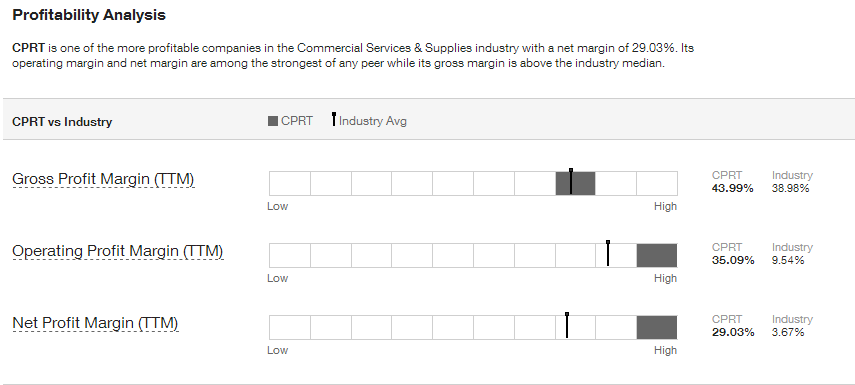
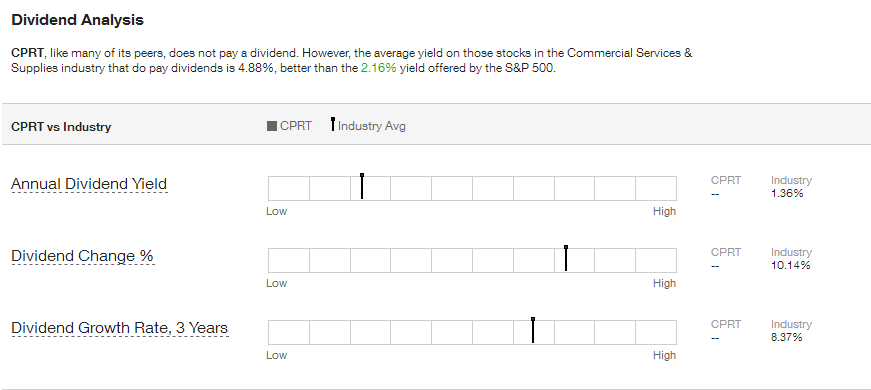
. . . . . . . . . . . . Lowest to Highest, Compared to Industry

Intrinsic Value (DCF) |
Intrinsic Value by Discounted Cash Flow Method:
Fair Value Estimator |
Fair Value Estimate:

Projected Earnings |

Research Reports |
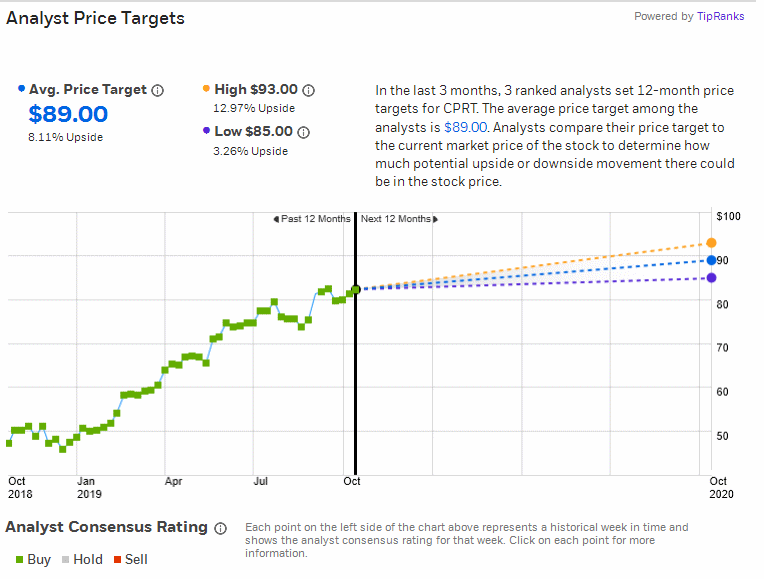
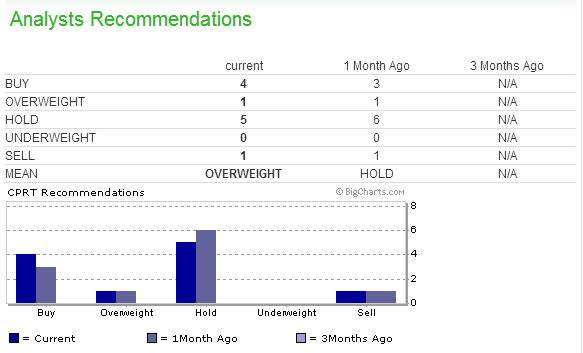
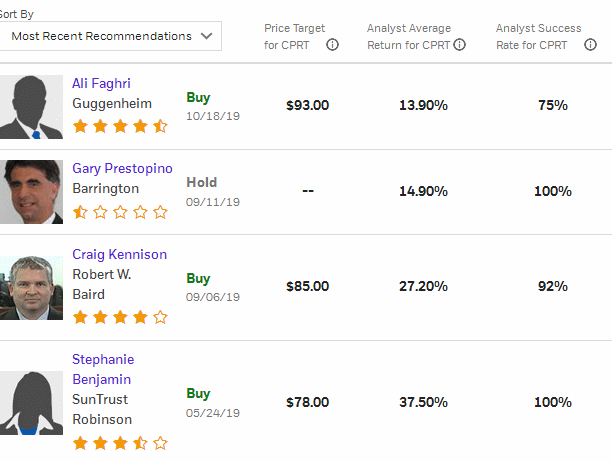
Analysts' Opinions |

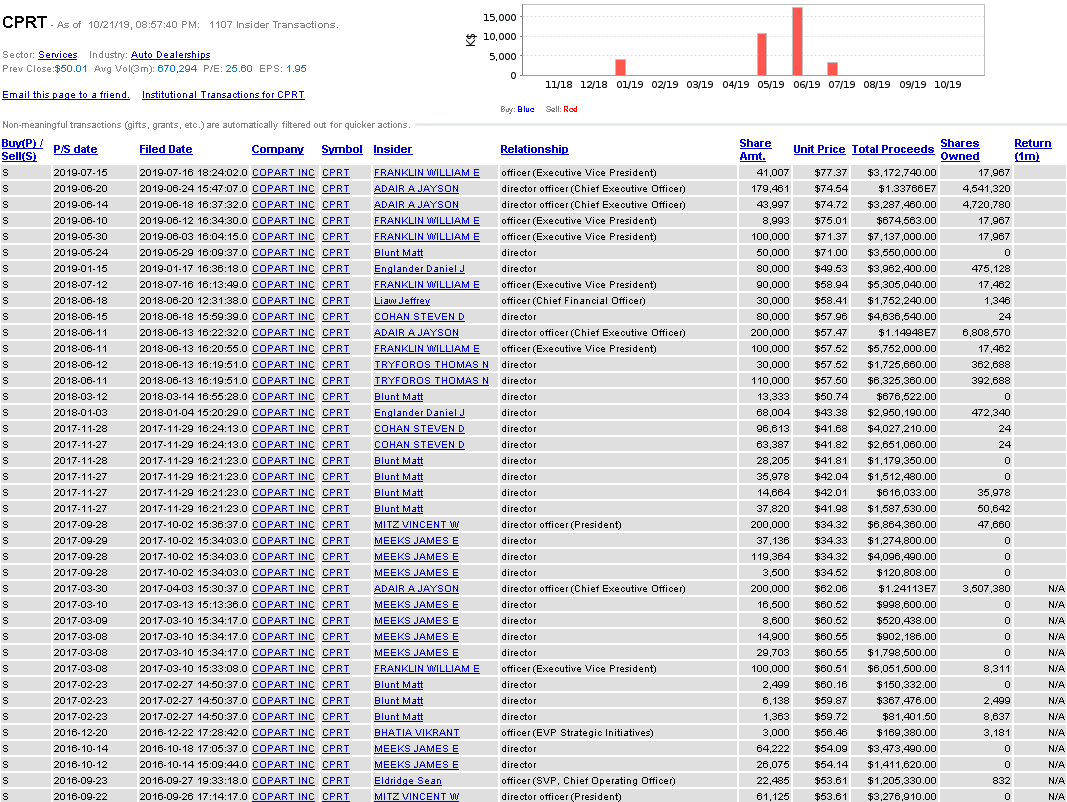
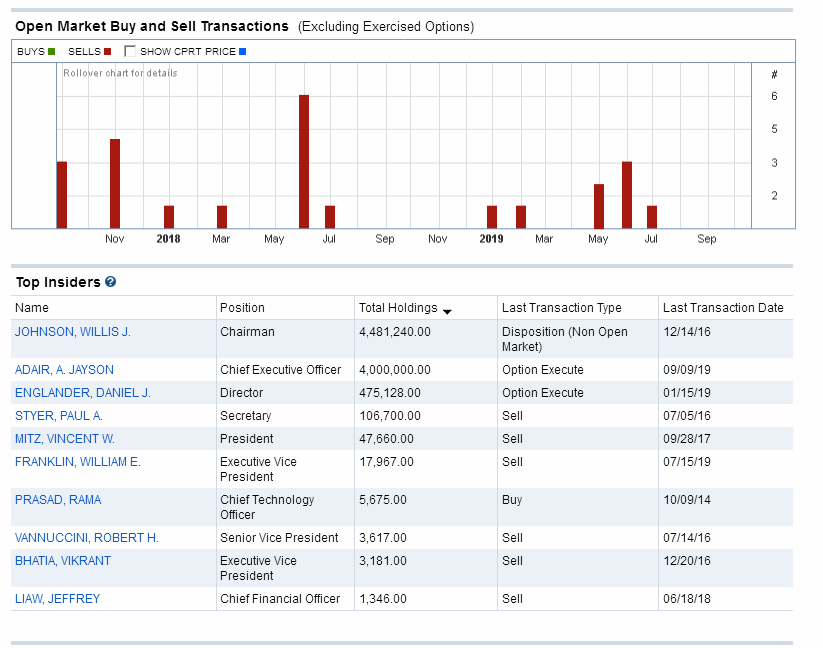
Insider Activity |

 441
441Institutional Activity |
Institutional Ownership:
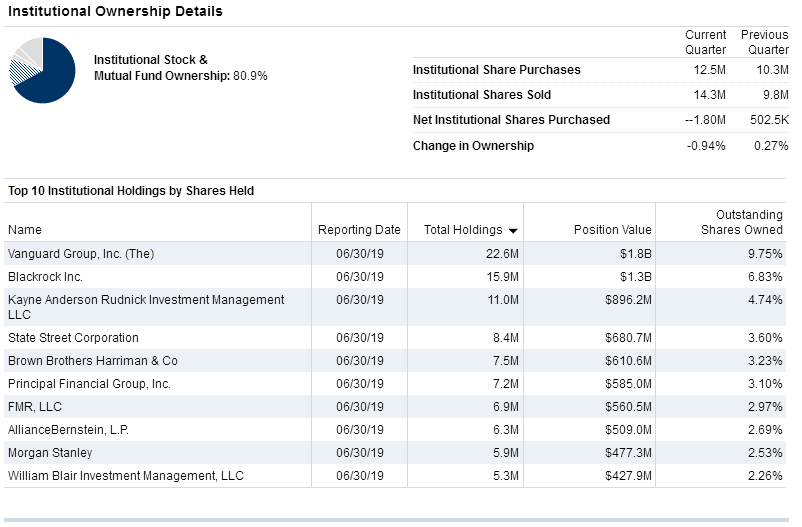
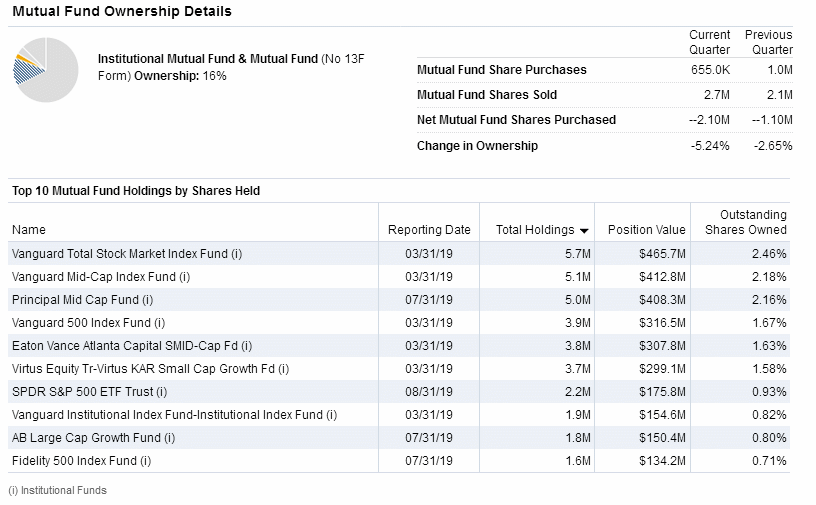
Sentiment |
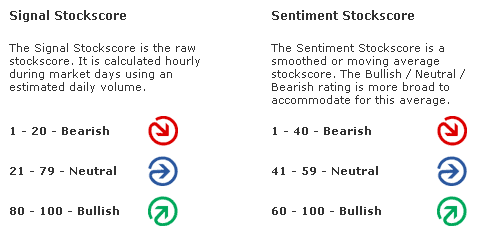
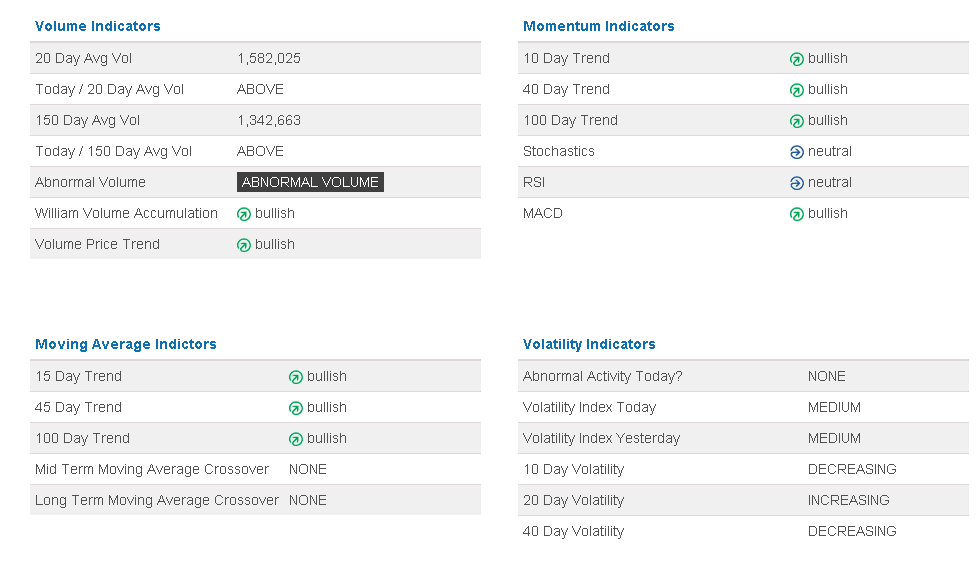
Zenith uses the "sentiment" score above or below 50 to award a positive or negative point in the Decision Matrix.


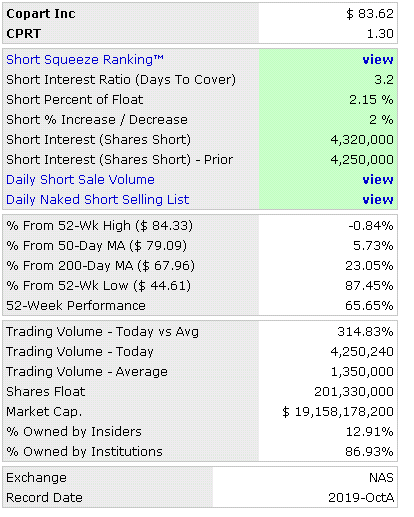
Short Interest Ratio |
As the short interest rises as a percentage of average daily share volume (Days to Cover), this is considered a measure of negative sentiment. Similarly, a decrease in that percentage is considered positive sentiment.

Standard & Poor's |
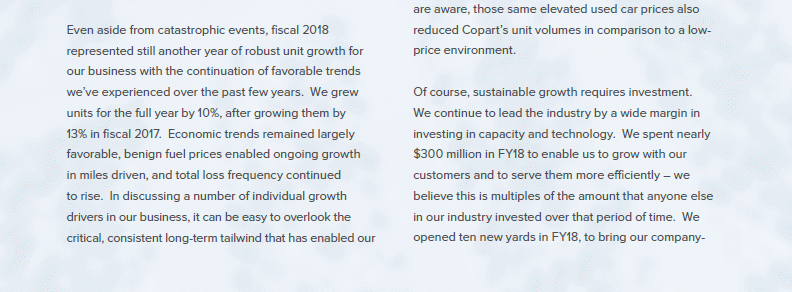
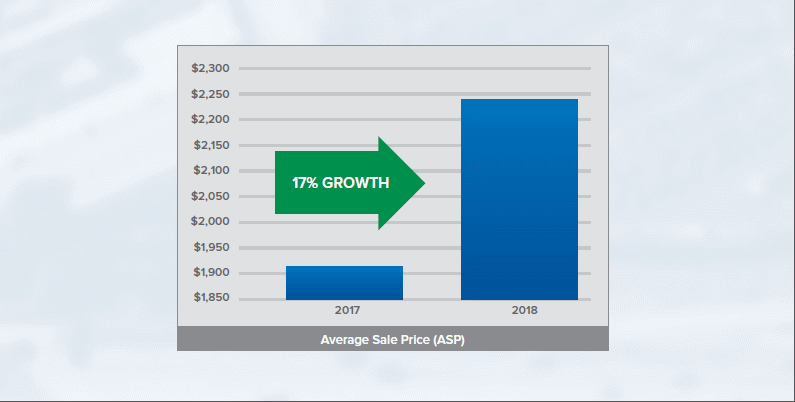
Management's Discussion of Results of Operations Excerpts |
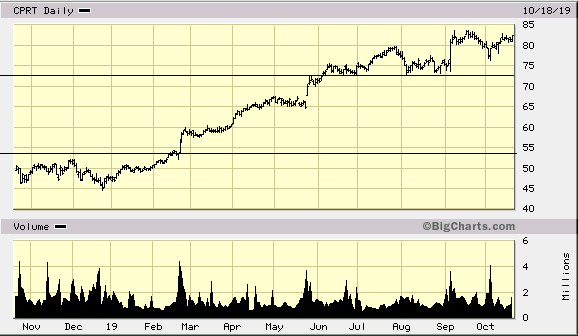
Channeling Potential |
The summary below includes a value for `Degree,' which refers on a
scale of 1 to 10 the range of a channel in the period under consi-
deration compared to the total range of price movement. It also looks
for the last closing price to be within the channel, otherwise zeroed.
The `Index' is the `Degree' weighted for volatility.  Generally, the
the higher the index, the more suitable is the stock for trading as
a `rolling stock' between channel high and low points.

Results for COPART INC.:
Symbol? CPRT
Total Months Available:  25
       Months in Cycle?   4

Months Covered by Periods:  12

Period 1           Period 2          Period 3
   H1      L1        H2      L2        H3      L3
  54.29   44.61     75.50   51.99     83.70   72.76

RANGE   =  83.70  TO   44.61            Close =  81.02
CHANNEL =  72.76  TO   54.29           Degree =   5
Volatility =  22.80%                    Index =  11
MACD Histogram Divergence |
The theory is that connecting the two most recent peaks or valleys of the MACD histogram will signal the direction of the next major move.
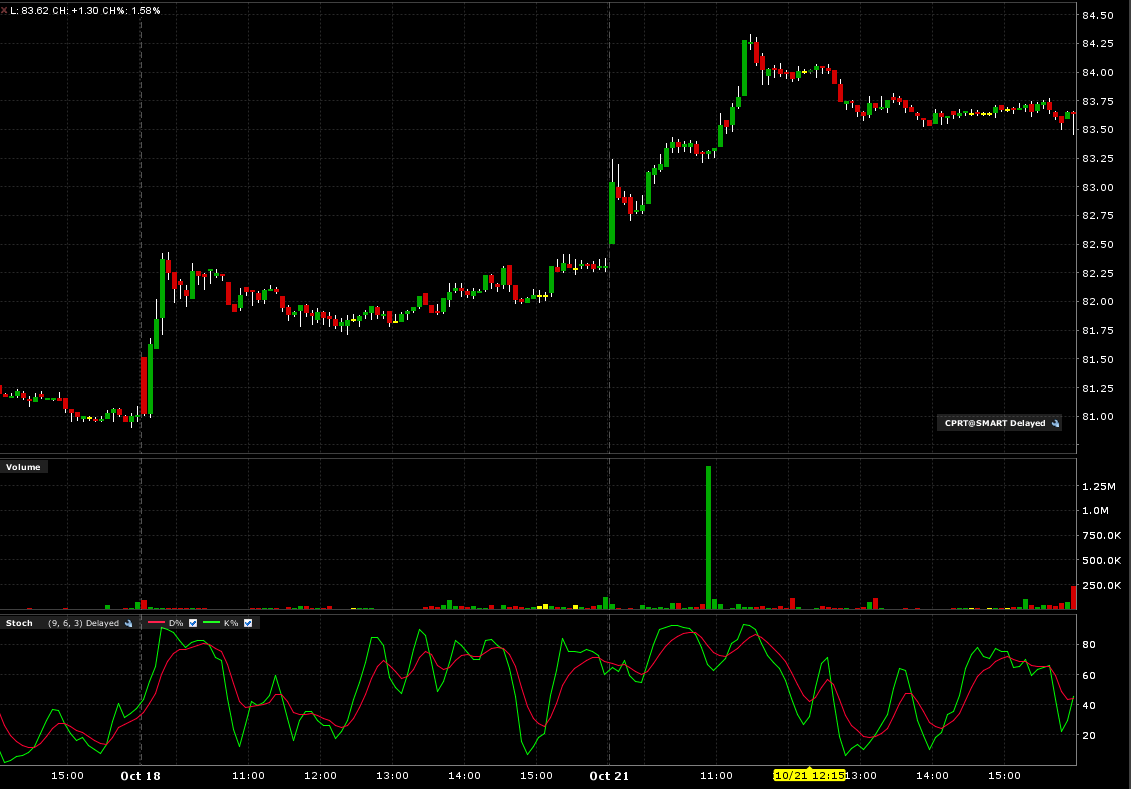
Intraday Chart |
2 Days:
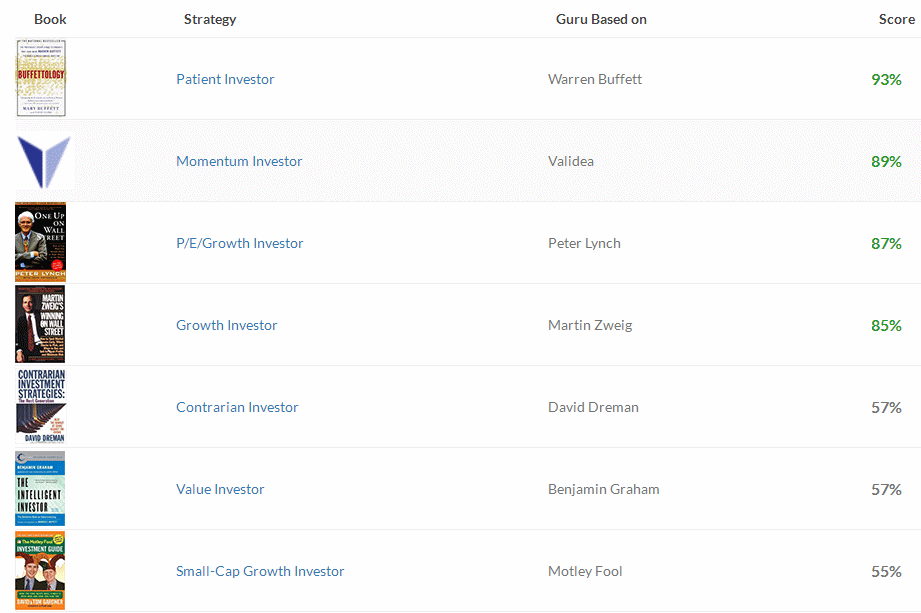
Val Idea |
8 out of 12 favorable, (positive opinion.)
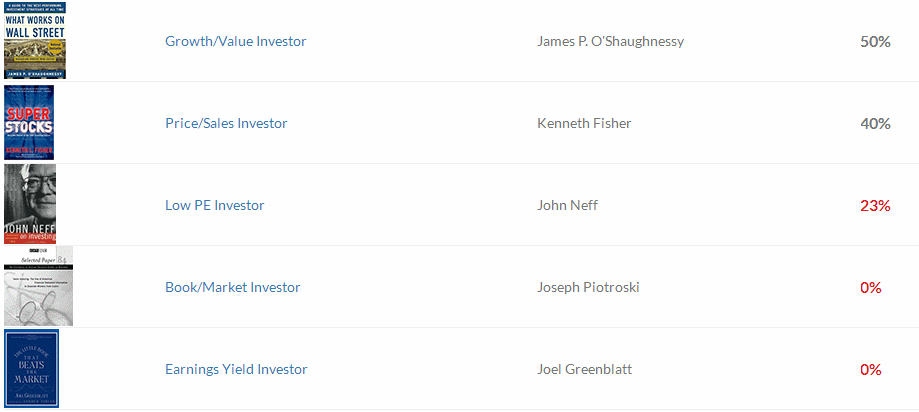
Stock Consultant |
Point & Figure Chart |
Wall Street Analyzer |
Marketspace Chart |
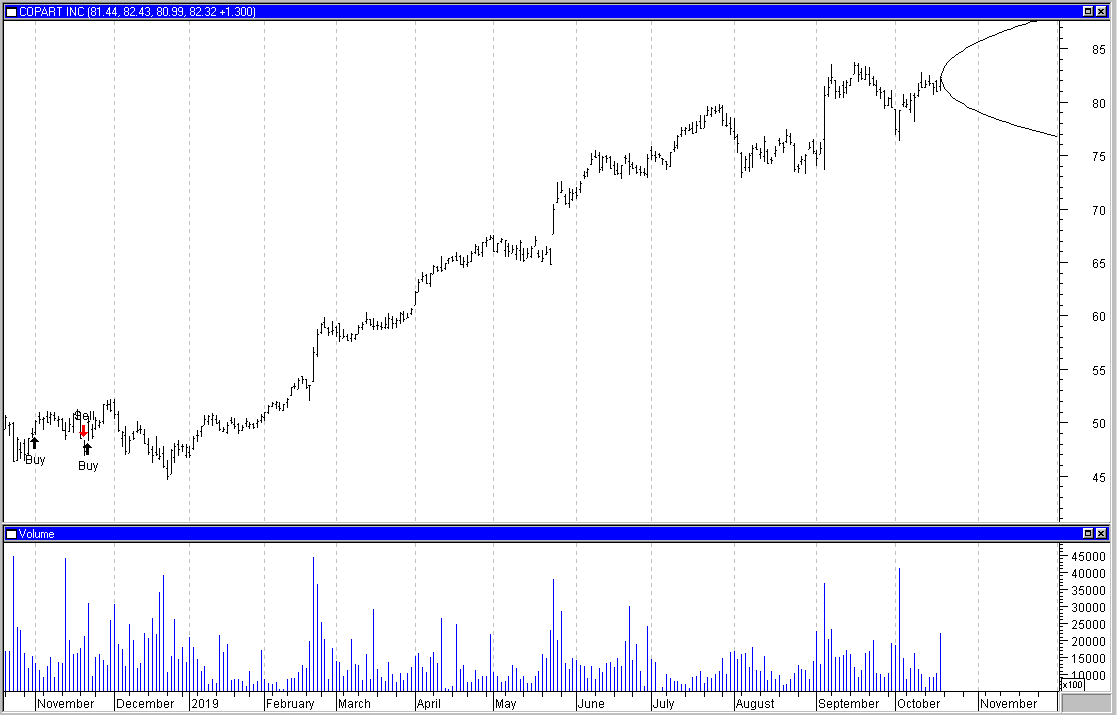
Time Series Forecast |
Neural Network Prediction |
"Neurostock" can only track long trades. Therefore its performance, as tracked by itself on stocks which are consistently falling, may not appear as good as it could if each "sell" signal were a "short sale."

![]()
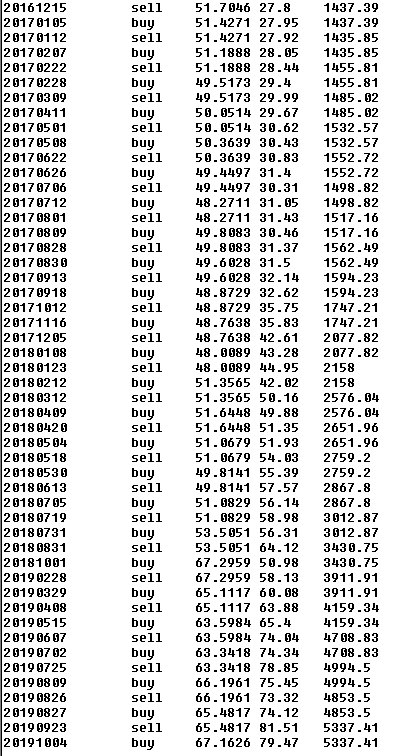

Ultimate Trading Systems |
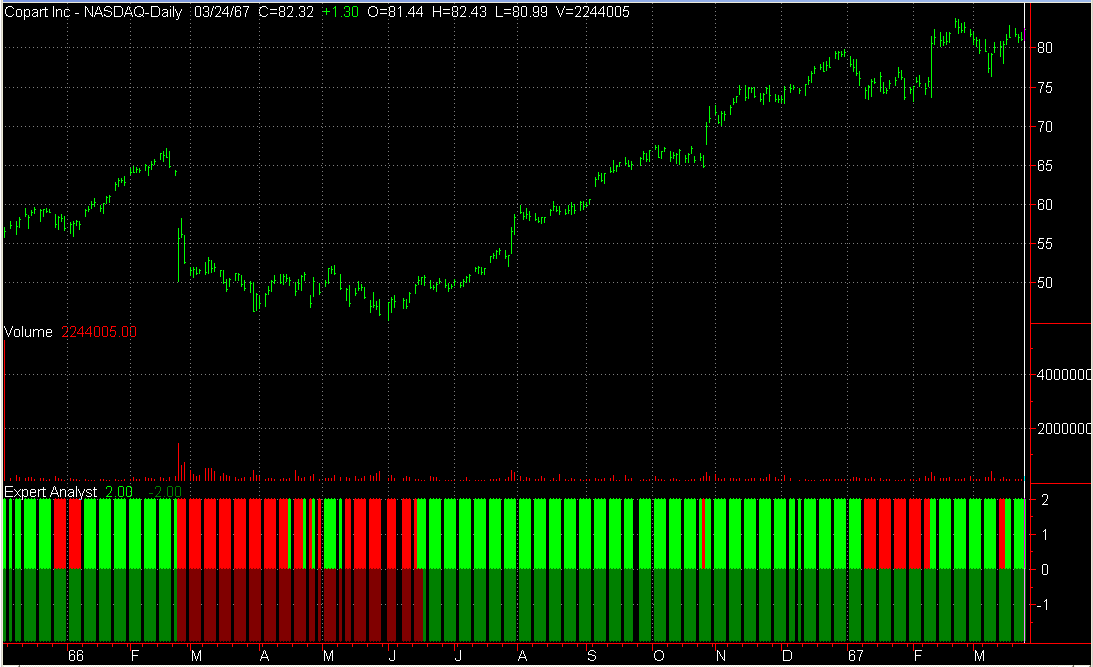
3 out of 3 of the ultimate systems favor an upmove.
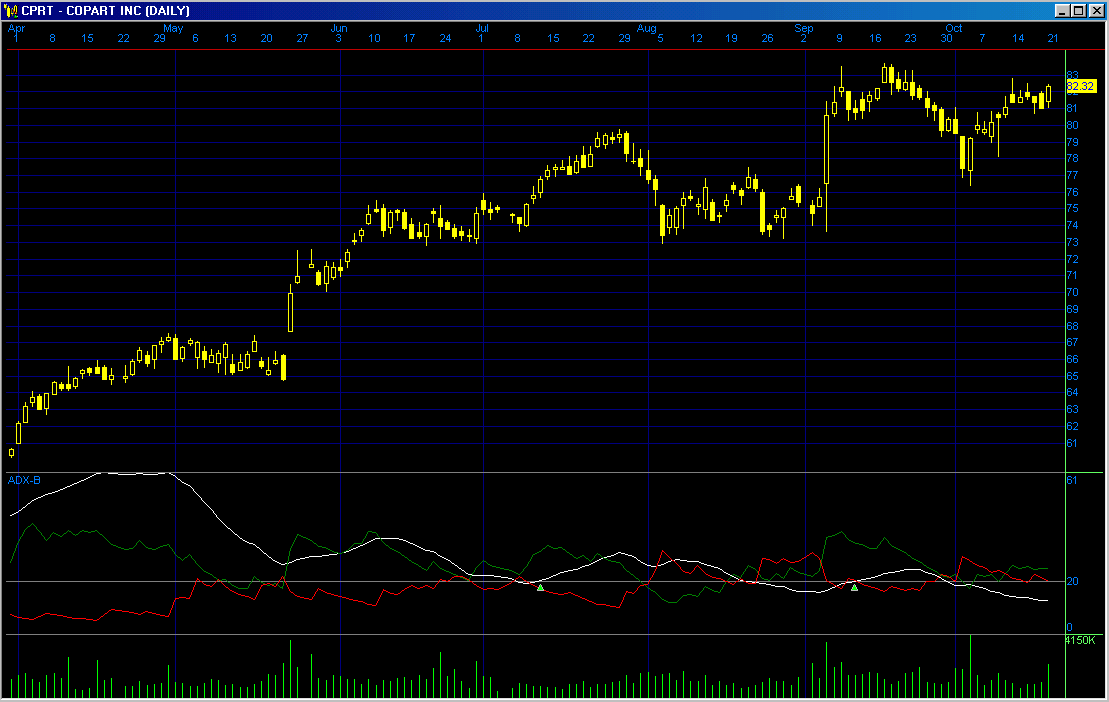
System Below:
Short term outlook: Positive: Bright Green, Negative: Bright Red
Long term outlook: Postive: Dark Green, Negative: Dark Red.

Recommendation |
| Factors | Weighted Points |
|---|---|
| News | + 1 |
| Comparison | - 1 |
| Industry | + 1 |
| Bond Issue | 0 |
| Zenith Index | + 1 |
| Non-GAAP vs. GAAP Earnings | - 1 |
| Cash Flow | - 1 |
| Average to Current P/E | - 1 |
| Ratios | + 1 |
| Intrinsic Value DCF | + 1 |
| Fair Value Estimator | + 1 |
| Projected Earnings | + 1 |
| Research Reports | + 1 |
| Analysts | + 1 |
| Executive Perquisites | + 1 |
| Insider Activity | - 1 |
| Institutional Activity | - 1 |
| Management Reporting | + 1 |
| Short Interest | - 1 |
| Sentiment | + 1 |
| Standard & Poor's | - 1 |
| MACD Histogram Divergence | - 1 |
| Val Idea | + 1 |
| Stock Consultant | - 1 |
| Point & Figure | + 1 |
| Wall Street Analyzer | + 1 |
| Marketspace Chart | + 1 |
| Time Series Chart | - 1 |
| Neural Network | + 1 |
| Stock Options | + 1 |
| Ultimate Trading Systems | + 1 |
| Total | + 8 |
Place 360 shares of Copart, Inc. (CPRT) on the Active List.