![]()
Corporate Webpages Cincinnati Financial Corporation
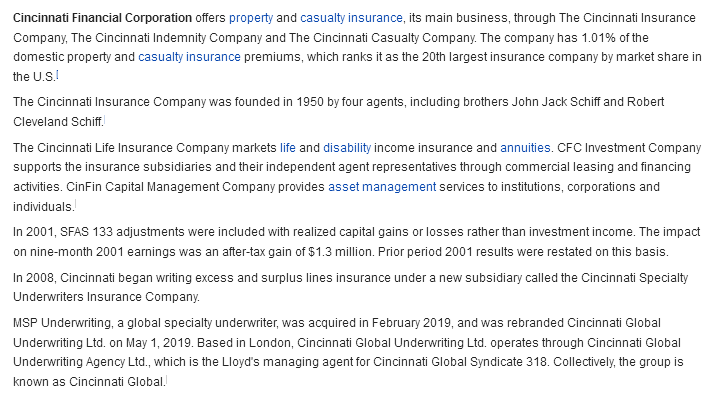
Cinncinati Financial Corporation was founded in 1968, and
quickly became one of the 20 largest casualty insurance
companies in the U.S. admidst a large field of competitors. It
strove to become global, particularly in England and former
commonwealth countries, growing so fast as to have significant
intrinsic value.
Researchers are generally favorable but analysts are reserved
and their stock price projections are lower. The company had an
earnings drop in 2017 which pushed its average to current p/e
ratio below 1.0, a rare situation today among American corporations.
The suggestion is that earnings power is greater than suspected.
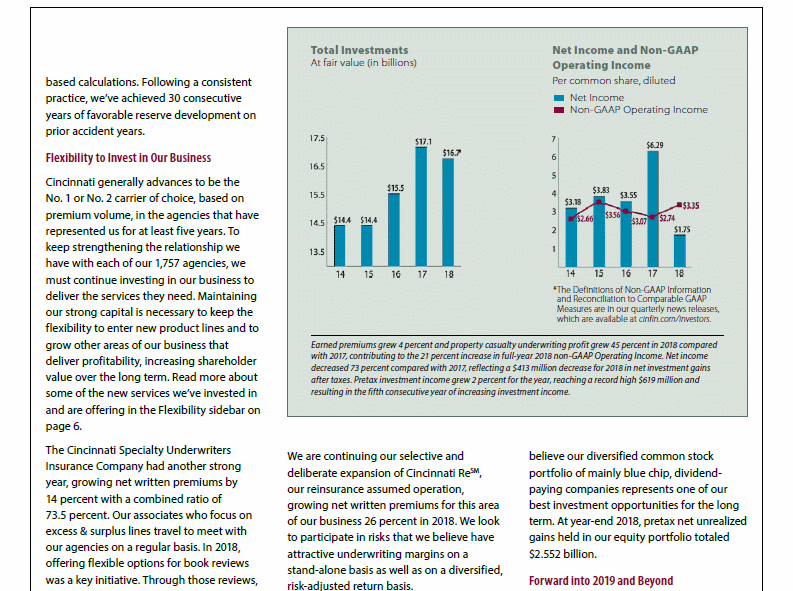
Ratios look good financially, but the corporation has an
unacceptably-low Zenith Index, and a rather complex management
reporting in standard SEC format.
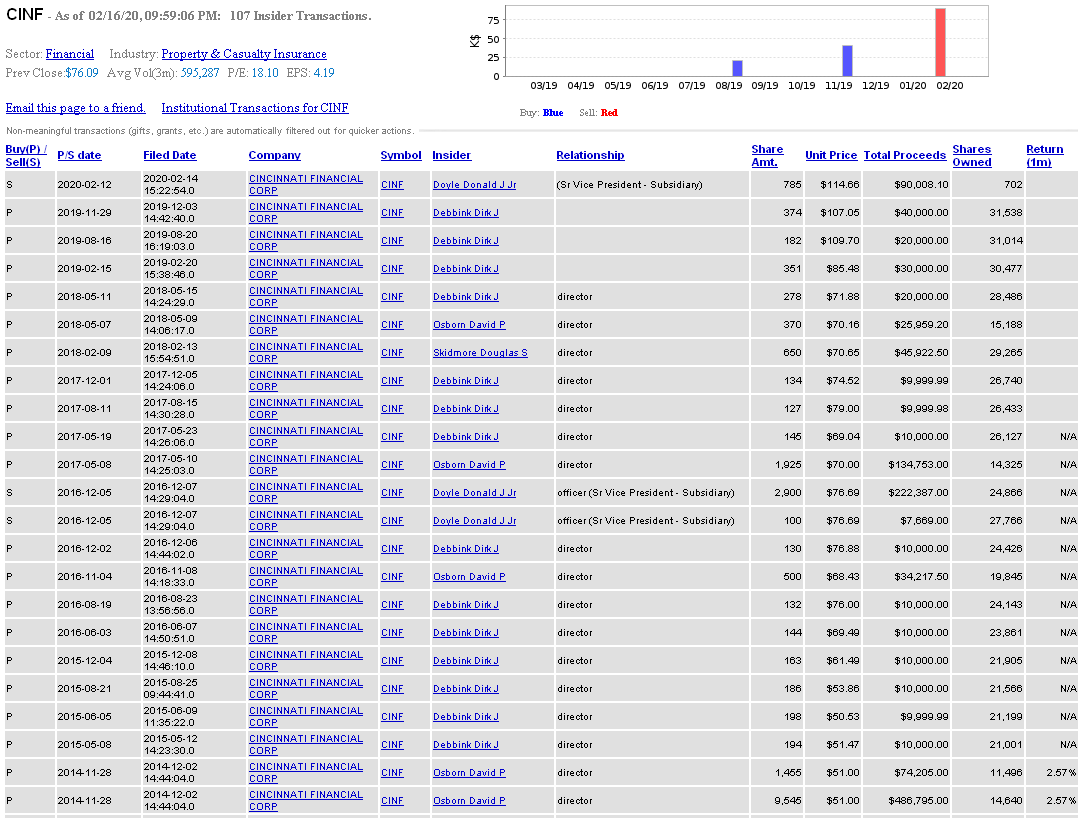
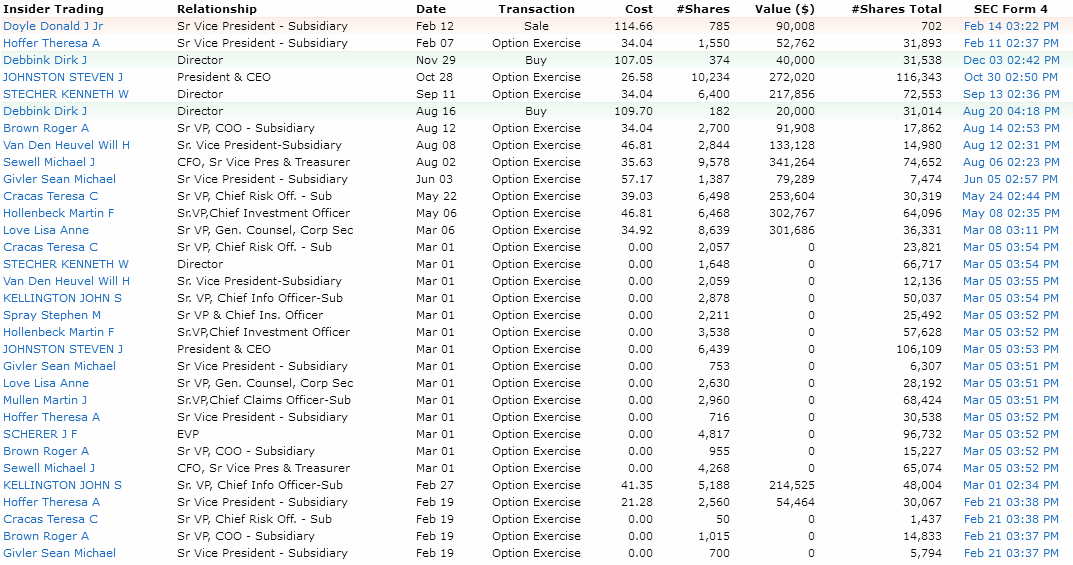
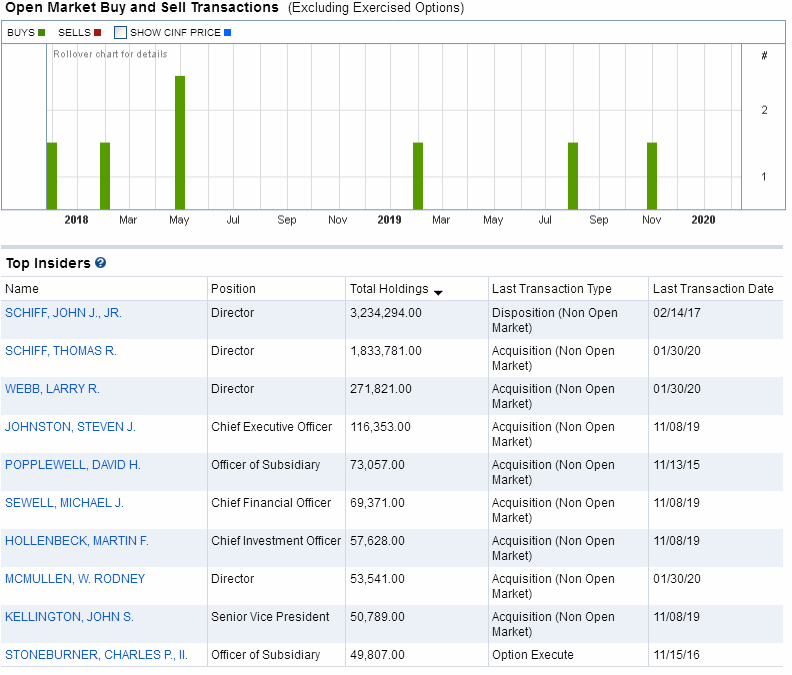
There was some significant insider buying activity a few months
back, but overall insiders are selling. The company has a
portfolio of stock market investments which apparently have not
been doing as well as expected in the current market.
News for this company consists mainly of a flood of "helpful
hints" articles produced by the company's public relations
effots related to protecting property and thus reducing
insurance incidents.
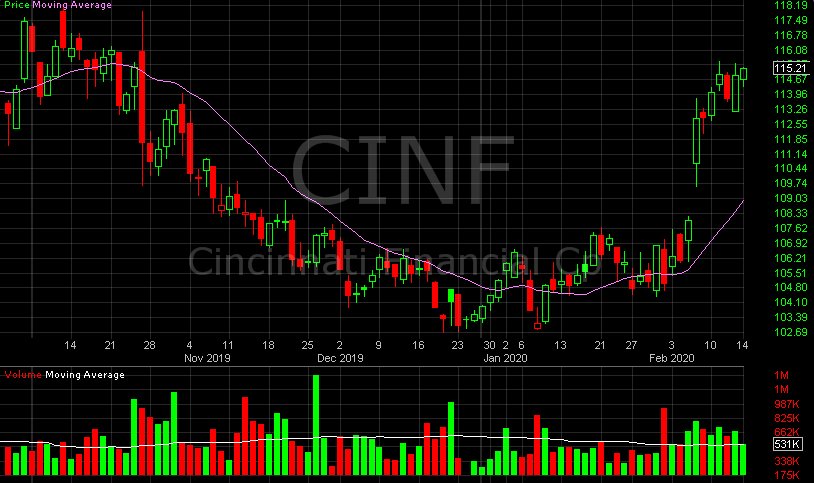
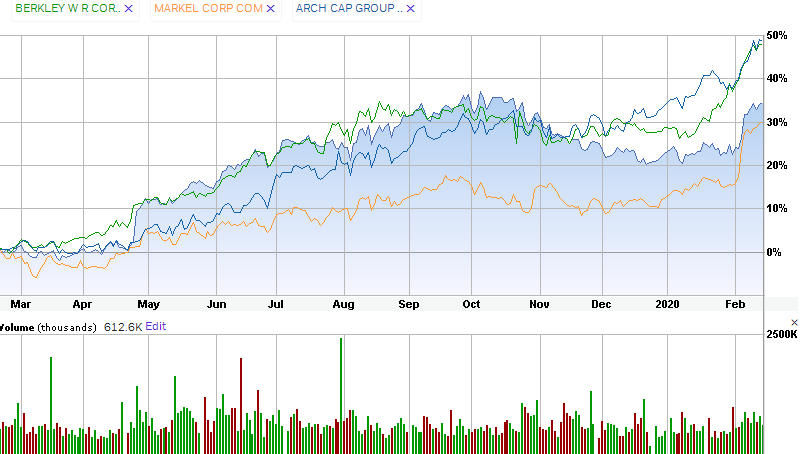
The stock still shows positive overall sentiment but has been
trending down for the last three months of 2019, only to shoot
back up again on prospects for the New Year. Insurance
companies in general have been performing well as a group in the
stock market. This is despite a number of tragedies related to
weather and brush fires.
(WAIT FOR PAGE TO LOAD COMPLETELY BEFORE LINKS WORK.)
Company Profile
Company History
News
Comparison with Peers
Bond Issue
Zenith Index
Financial Statements
Avg. P/E To Current P/E
Financial Ratios
Intrinsic Value (Disc.
CashFlow)
Fair Value
Estimator
Projected
Earnings
Research
Reports
Analysts'
Opinions
Insider
Activity
Institutional
Activity
Sentiment
Short Interest
Standard &
Poor's
Management's
Discussion
Channel Potential
MACD
Histogram
Intraday
Chart
Val
Idea
Stock
Consultant
Point
& Figure Chart
Wall Street Analyzer
Marketspace Chart
Time Series
Forecast
Neural Network Prediction
Stock
Options
Ultimate Trading Systems
Recommendation














|
Company
Profile |

|
Company
History |

|
News |
|
Comparison |
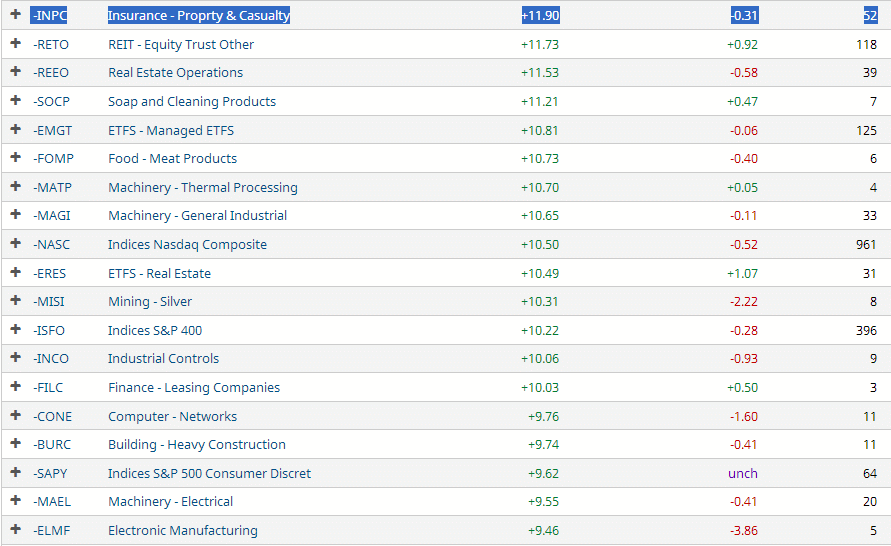
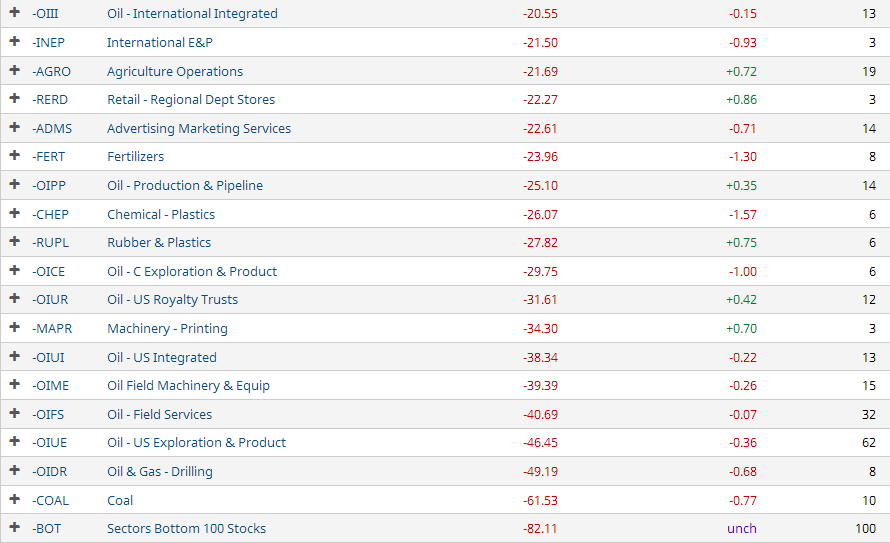
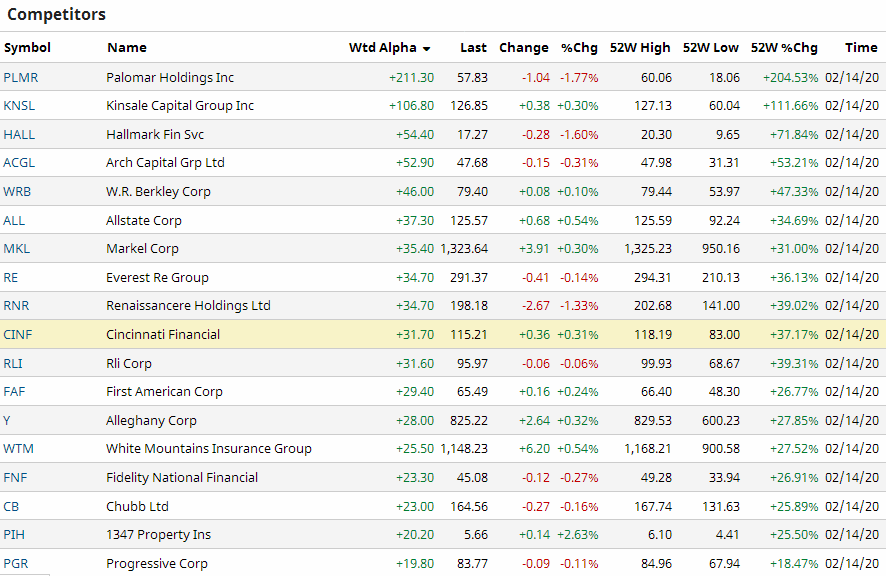
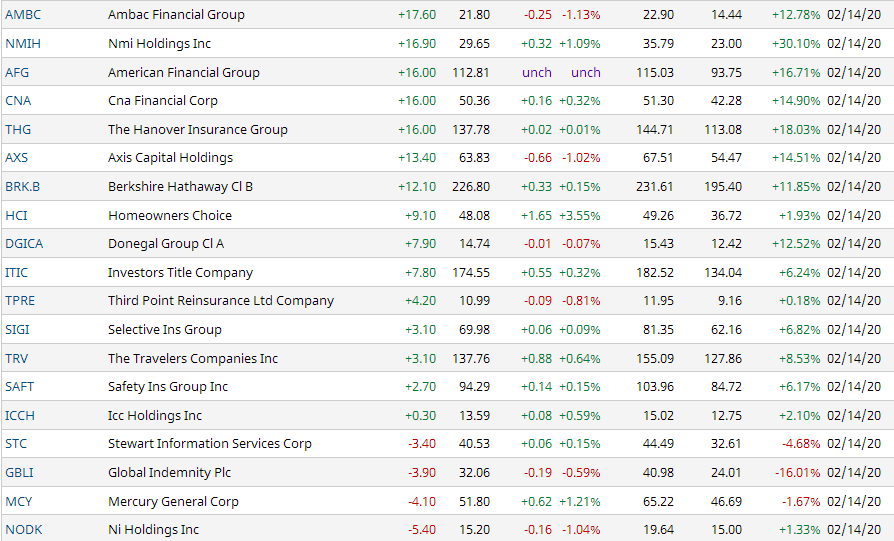
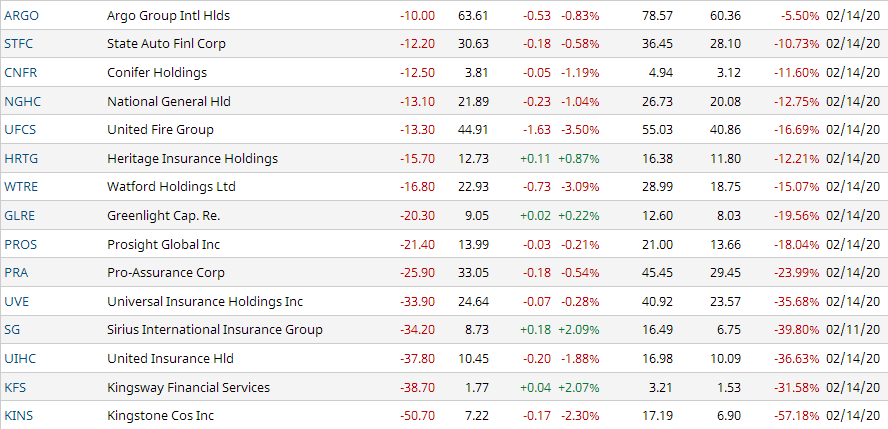
Similar Companies Performance:
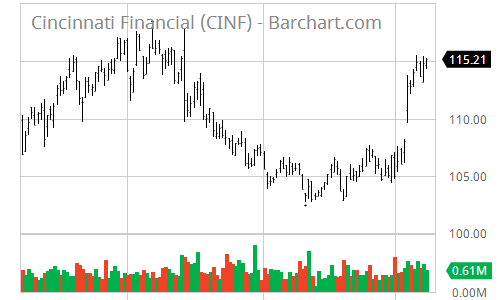
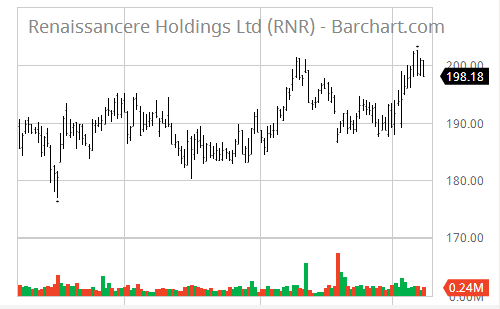
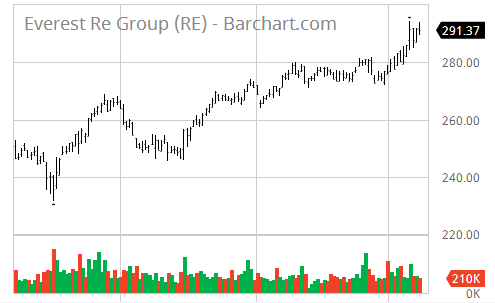
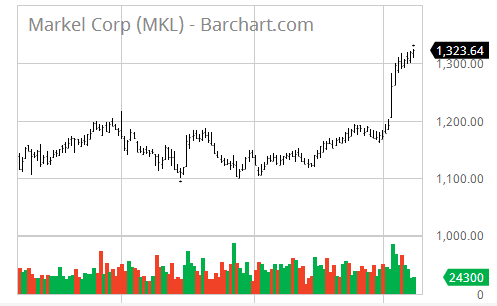
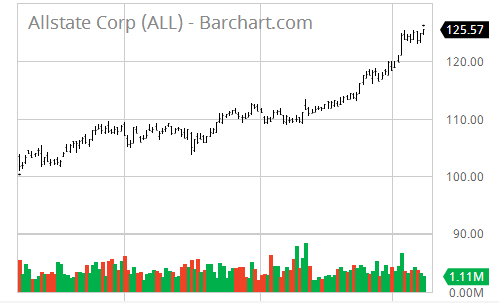
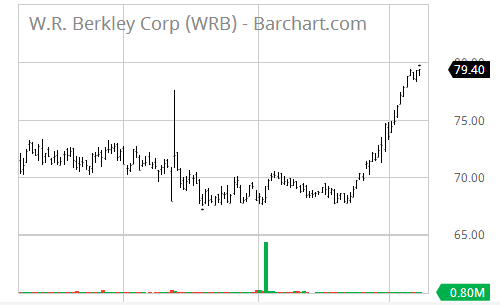
|
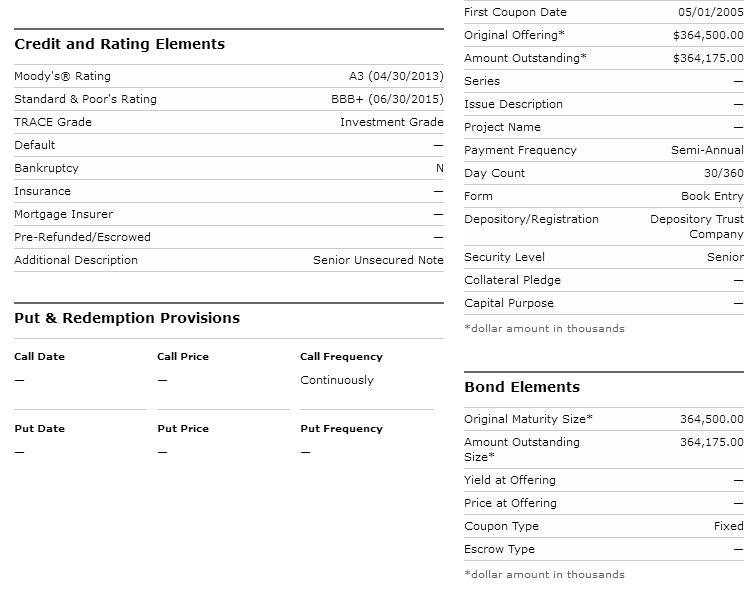
Bond
Issue |
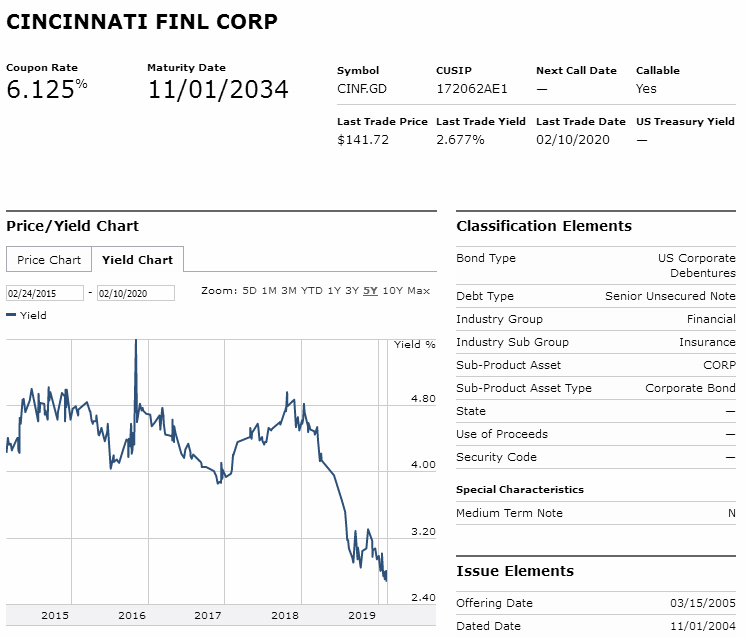
|
Zenith Index
|
Under current market conditions, a Zenith Index Score of 1.20 or above is
required for a positive rating on this factor. 1.21 -1.30 is considered
acceptable, 1.30-1.40 is considered strong and
> 1.40 is considered
exceptionally strong. Accounting statements in this section often contain
mistakes, especially in earlier years' totals, but data is deemed sufficient for
us to give a rating. More accurate financial statements follow in the next
section.
Cincinnati Financial Corporation (CINF) Exchange: Nasdaq
6200 South Gilmore Road
Fairfield, OH 45014 Sector: Financial Services
United States Industry: InsuranceGă÷Property & Casualty
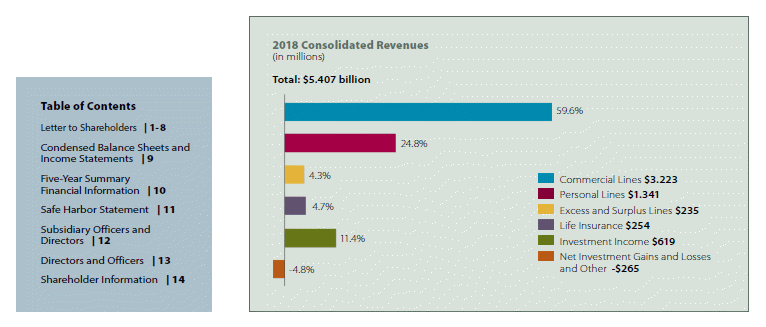
Cincinnati Financial Corporation, together with its subsidiary, provides
property casualty insurance products in the United States. The company
operates in five segments: Commercial Lines Insurance, Personal Lines
Insurance, Excess and Surplus Lines Insurance, Life Insurance, and
Investments. The Commercial Lines Insurance segment provides coverage
for commercial casualty, commercial property, commercial auto, and
workers' compensation. It also offers director and officer liability
insurance, contract and commercial surety bonds, and fidelity bonds;
coverage for property, liability, and business interruption; and
machinery and equipment coverage. The Personal Lines Insurance segment
provides personal auto insurance; homeowners insurance; and dwelling
fire, inland marine, personal umbrella liability, and watercraft
coverages to individuals. The Excess and Surplus Lines Insurance segment
offers commercial casualty insurance that covers businesses for
third-party liability from accidents occurring on their premises or
arising out of their operations, such as injuries sustained from
products; and commercial property insurance, which insures buildings,
inventory, equipment, and business income from loss or damage due to
various causes, such as fire, wind, hail, water, theft, and vandalism.
The Life Insurance segment provides term life insurance products;
universal life insurance products; worksite products, such as term life,
whole life, and disability insurance; and whole life insurance products,
as well as markets deferred annuities and immediate annuities. The
Investments segment invests in fixed-maturity investments, including
taxable and tax-exempt bonds, and redeemable preferred stocks; and
equity investments comprising common and nonredeemable preferred stocks.
The company also offers commercial leasing and financing services; and
insurance brokerage services. Cincinnati Financial Corporation was
founded in 1950 and is headquartered in Fairfield, Ohio.
Last Trade: 114.85 52-Week Range: 118.19 - 83.00
Employees: Avg.Volume: 602,529 Shares
Corporate Governance:
Pillar scores are Audit: 1; Board: 10; Shareholder Rights: 8; Compensation: 3.
(A lower number means less governance risk.)
EPS: 12.10 Dividend Amount: $ 2.40 Yield: 2.09%
Ex-Dividend Date: Mar 17, 2020 Payout Ratio: 18.51
Key Statistics:
Trailing P/E: 9.52 Target Price: 110.50
Qrtly Stock Price Growth (yoy): 34.15% Beta: 0.57
Qrtly S&P Index Growth (yoy): 203.10% Short Ratio: 4.11%
Qrtly Revenue Growth (yoy): 52.00% Shares Out: 162900000
Qrtly Earnings Growth (yoy): 0.00%
Book Value: 60.55 Debt/Equity: 8.97%
Price/Book Value: 0.00 Operating Profit Margin: 31.87%
Price/Sales: 0.00 Profit Margin: 25.20%
Market Cap: 18,768,000,000 Return on Equity: 22.57%
Enterprise Value: 0 Return on Assets: 6.67%
Operating Cash Flow: 0
Free Cash Flow: 0
Annual Income Statement: (All numbers in thousands)
Period Ending 12/31/2019 12/31/2018 12/31/2017
Total Revenue 7,924,000 5,407,000 5,732,000
Cost of Revenue 0 0 0
Gross Profit 0 0 0
Operating Expenses:
Research & Development 0 0 0
Selling, General & Administrative 0 0 0
Total Operating Expenses 0 0 0
Operating Income or Loss 0 0 0
Income from Continuing Operations:
Total Other Income/Expenses Net 9,000 5,000 5,000
Interest Expense 53,000 53,000 53,000
Income Before Taxes 2,472,000 251,000 730,000
Income Tax Expense 475,000 -36,000 -315,000
Net Income from Continuing Op.s 1,997,000 287,000 1,045,000
Non-recurring Events:
Extraordinary Items 0 0 0
Net Income 1,997,000 287,000 1,045,000
Net Income Avail to Common Shares 1,997,000 287,000 1,045,000
Annual Cash Flow Statement: (All numbers in thousands)
Period Ending 12/31/2019 12/31/2018 12/31/2017
Net Income 1,997,000 287,000 1,045,000
Operating Activities:
Depreciation 0 63,000 55,000
Changes in Accounts Recv'bls 0 -109,000 77,000
Changes in Liabilities 0 1,161,000 1,036,000
Changes in Inventories 0 0 0
Changes in other Oper'g Acts 0 395,000 470,000
Total Cash Flow f Operations 0 1,181,000 1,052,000
Investing Activities:
Capital Exenditures 0 -20,000 -16,000
Investments 0 0 0
Other Cash Flows fr Investing 0 -8,000 -9,000
Total Cash Flows from Investing 0 -451,000 -558,000
Financing Activities:
Dividends Paid 0 -336,000 -400,000
Sale of Purchase of Stock 0 0 0
Other Cash Flows fr Financing 0 -159,000 -9,000
Total Cash Flows from Financing 0 -603,000 -614,000
Change in Cash & Cash Equiv. 0 127,000 -120,000
Annual Balance Sheets: (All Numbers in Thousands)
Period Ending 12/31/2019 12/31/2018 12/31/2017
Current Assets:
Cash & Cash Equivalents 784,000 657,000 777,000
Short Term Investments 0 0 0
Net Receivables 2,260,000 2,155,000 2,212,000
Inventory 0 0 0
Other Current Assets 0 0 0
Total Current Assets 0 0 0
Long-Term Investments 0 0 0
Property, Plant & Equipt 195,000 185,000 183,000
Goodwill 0 0 0
Intangible Assets 0 0 0
Other Assets 0 0 0
Total Assets 21,935,000 21,843,000 20,386,000
Current Liabilities:
Accounts Payable 0 0 0
Current Portion LT Debt 0 0 0
Other Current Liabilities 0 0 0
Total Current Liabilities 0 0 0
Long Term Debt 788,000 787,000 787,000
Other Liabilities 0 0 0
Total Liabilities 14,102,000 13,600,000 13,326,000
Stockholder Equity:
Common Stock 397,000 397,000 397,000
Retained Earnings 7,625,000 5,180,000 5,037,000
Capital Surplus 22,000 2,788,000 1,693,000
Total Stockholder Equity 7,833,000 8,243,000 7,060,000
Cincinnati Financial Corporation (CINF) [Indices near +3.0, near zero,
or < zero bear special attention.]
P/E Ratio Tests:
P/E Ratio < 28? 2.9412 P/E Ratio > 5? 1.0000
P/E Ratio Vs Growth Rate: 0.0000 Forward P/E Ratio < 28? 0.0000
Price/Sales Ratio < 2.3? 1.0000 Inventory/Sales < 5%? 1.0000
Sales < $1 Billion? 0.1262 Operating Margin < 7.5%? 0.2353
Balance Sheet Tests:
Debt/Equity < 0.40? 3.0000 Long-Term Debt Service: 3.0000
LTD Being Reduced? -3.0000 Short-Term Debt Service: 0.0000
Current Ratio > 2? 1.0000 Working Capital >= 1.5? 1.0000
Leverage Ratio < 20%? 0.7586 Debt/Assets < 1? 3.0000
Quick Ratio > 1? 3.0000 Inventory Turnover > 1? 1.0000
Share Equity Increase: 2.1178 Market Cap.< 1.5 Billion? 0.0799
Intangibles < 3% Assets? 3.0000
Income Tests:
Profit Margin < 7.5%? 3.0000 EPS Annual Growth > 10%? 0.0144
Dividend Yield > 2.0%? 0.9569 EPS 3-yr Growth > 15? 0.0785
Enterprise Value/Revenue 2.3685 EPS Growth Consistent? 0.0000
Enterprise Value/EBITDA: 3.0000 Collection < 45 days? 0.4323
EPS Qrtly Growth > 10%? 0.0000 Gross Pft/Cur. LTD > 1? 3.0000
Borrowing Int. Rate < 6%? 0.8921
Stock Performance Tests:
Volatility > 25%? 1.1910 % Held by Insiders < 5%? 0.7610
Beta > 1.25? 0.4560 % Held by Institut. < 50? 0.7732
50 Da MA > 200 Da MA? -0.0590 % Held by Institut. > 30? 2.1557
52-Wk Change vs. S&P 500: 0.6567 Short Ratio > 5? 0.8220
Price/Book Value < 3? 3.0000 Short % of Float > 20? 0.0845
Return on Assets > 17%? 0.3924 Average Volume > 100,000? 3.0000
Cash Flow Tests:
Oper. C.F. > Lever'd C.F: 0.0000 Positive Free Cash Flow? -1.0000
Positive Oper. Cash Flow? -1.0000 Price to C.F.Ratio < 14?: 0.0000
Cash Flow / Assets > 10%? 0.0000
CINF Cincinnati Financial Corporation Overall Zenith Index: 1.0048
|
Financial
Statements |
CINCINNATI FINANCIAL CORP  (CINF)           INCOME STATEMENT

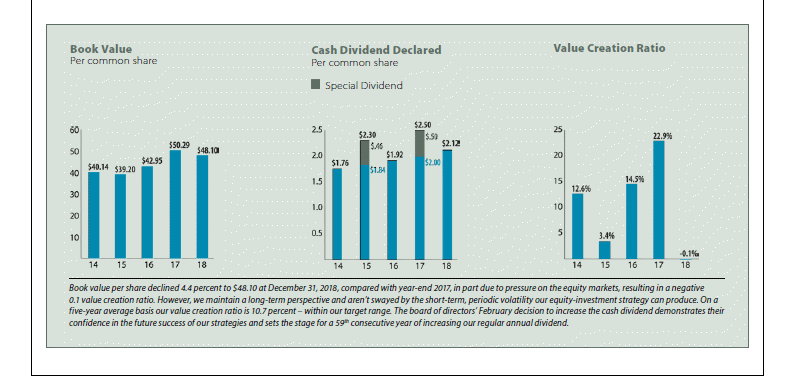
Fiscal year ends in December. USD in thousand        2014-12         2015-12         2016-12         2017-12         2018-12             TTM

Revenue                                            4,945,000       5,142,000       5,449,000       5,732,000       5,407,000       6,482,000
Gross profit                                       4,945,000       5,142,000       5,449,000       5,732,000       5,407,000       6,482,000

Operating expenses
Operating income                                   4,945,000       5,142,000       5,449,000       5,732,000       5,407,000       6,482,000
Interest Expense                                      53,000          53,000          53,000          53,000          53,000          53,000
Other income (expense)                            -4,171,000      -4,208,000      -4,584,000      -4,949,000      -5,103,000      -5,319,000
Income before taxes                                  721,000         881,000         812,000         730,000         251,000       1,110,000
Provision for income taxes                           196,000         247,000         221,000        -315,000         -36,000         191,000
Net income from continuing operations                525,000         634,000         591,000       1,045,000         287,000         919,000
Net income                                           525,000         634,000         591,000       1,045,000         287,000         919,000

Net income available to common shareholders          525,000         634,000         591,000       1,045,000         287,000         919,000

Earnings per share
Basic                                                   3.21            3.87            3.59            6.36            1.76            5.63
Diluted                                                 3.18            3.83            3.55            6.29            1.75            5.56

Weighted average shares outstanding
Basic                                                163,500         164,000         164,500         164,200         163,200         163,125
Diluted                                              165,100         165,600         166,500         166,000         164,500         164,800

____________________________________________________________________________________________________________________________________________


CINCINNATI FINANCIAL CORP  (CINF)           BALANCE SHEET

Fiscal year ends in December. USD in thousand        2014-12         2015-12         2016-12         2017-12         2018-12

Assets

Current assets

Cash

Total cash                                           591,000         544,000         777,000         657,000         784,000

Receivables                                        2,073,000       2,102,000       2,212,000       2,155,000       2,260,000
Prepaid expenses                                      29,000          54,000          62,000          42,000          44,000
Other current assets                              -2,693,000      -2,700,000      -3,051,000      -2,854,000      -3,088,000
Total current assets                                       0               0               0               0               0

Non-current assets

Property, plant and equipment
Net property, plant and equipment                    194,000         185,000         183,000         185,000         195,000

Equity and other investments                      14,386,000      14,423,000      15,500,000      17,051,000      16,732,000
Other long-term assets                           -14,580,000     -14,608,000     -15,683,000     -17,236,000     -16,927,000
Total non-current assets                                   0               0               0               0               0

Total assets                                               0               0               0               0               0

Liabilities and stockholders' equity

Liabilities

Current liabilities
Short-term debt                                       49,000          35,000          20,000          24,000          32,000
Other current liabilities                            -49,000         -35,000         -20,000         -24,000         -32,000
Total current liabilities                                  0               0               0               0               0

Non-current liabilities
Long-term debt                                       791,000         786,000         787,000         787,000         788,000
Capital leases                                        36,000          35,000          39,000          40,000          46,000
Deferred taxes liabilities                           840,000         638,000         865,000         745,000         627,000
Other long-term liabilities                       -1,667,000      -1,459,000      -1,691,000      -1,572,000      -1,461,000
Total non-current liabilities                              0               0               0               0               0

Total liabilities                                          0               0               0               0               0

Stockholders' equity

Common stock                                         397,000         397,000         397,000         397,000         397,000
Additional paid-in capital                         1,214,000       1,232,000       1,252,000       1,265,000       1,281,000
Retained earnings                                  4,505,000       4,762,000       5,037,000       5,180,000       7,625,000
Treasury stock                                    -1,287,000      -1,308,000      -1,319,000      -1,387,000      -1,492,000
Accumulated other comprehensive income             1,744,000       1,344,000       1,693,000       2,788,000          22,000
Total stockholders' equity                         6,573,000       6,427,000       7,060,000       8,243,000       7,833,000
Total liabilities and stockholders' equity         6,573,000       6,427,000       7,060,000       8,243,000       7,833,000

____________________________________________________________________________________________________________________________________________


CINCINNATI FINANCIAL CORP  (CINF)           Statement of CASH FLOW

Fiscal year ends in December. USD in thousand        2014-12         2015-12         2016-12         2017-12         2018-12             TTM

Cash Flows From Operating Activities
Net income                                           525,000         634,000         591,000       1,045,000         287,000         919,000
Depreciation & amortization                           51,000          52,000          48,000          55,000          63,000          69,000
Investments losses (gains)                          -133,000         -70,000        -124,000        -148,000         408,000        -328,000
Deferred income taxes                                 37,000          16,000          38,000        -444,000         -47,000          59,000
Stock based compensation                              19,000          20,000          23,000          26,000          28,000          29,000
Change in working capital                            327,000         368,000         479,000         470,000         395,000         446,000
Accounts receivable                                  -60,000         -48,000        -113,000          77,000        -109,000        -151,000
Other working capital                                387,000         416,000         592,000         393,000         504,000         597,000
Other non-cash items                                  47,000          44,000          48,000          48,000          47,000          41,000
Net cash provided by operating activities            873,000       1,064,000       1,103,000       1,052,000       1,181,000       1,235,000

Cash Flows From Investing Activities
Investments in property, plant, and equipmen          -9,000         -10,000         -13,000         -16,000         -20,000         -28,000
Purchases of investments                          -1,695,000      -2,214,000      -2,447,000      -2,251,000      -1,989,000      -2,153,000
Sales/Maturities of investments                    1,380,000       1,584,000       1,991,000       1,718,000       1,566,000       1,590,000
Other investing activities                            13,000          16,000          13,000          -9,000          -8,000          -6,000
Net cash used for investing activities              -311,000        -624,000        -456,000        -558,000        -451,000        -597,000

Cash Flows From Financing Activities
Debt issued                                                0               0               0           4,000               0               0
Debt repayment                                       -55,000         -14,000         -15,000               0               0               0
Common stock repurchased                             -21,000         -53,000         -39,000         -92,000        -125,000          -5,000
Dividend paid                                       -278,000        -366,000        -306,000        -400,000        -336,000        -350,000
Other financing activities                           -50,000         -54,000         -54,000        -126,000        -142,000        -112,000
Net cash provided by (used for) financing           -404,000        -487,000        -414,000        -614,000        -603,000        -467,000

Net change in cash                                   158,000         -47,000         233,000        -120,000         127,000         171,000
Cash at beginning of period                          433,000         591,000         544,000         777,000         657,000         616,000
Cash at end of period                                591,000         544,000         777,000         657,000         784,000         787,000

Free Cash Flow
Operating cash flow                                  873,000       1,064,000       1,103,000       1,052,000       1,181,000       1,235,000
Capital expenditure                                   -9,000         -10,000         -13,000         -16,000         -20,000         -28,000
Free cash flow                                       864,000       1,054,000       1,090,000       1,036,000       1,161,000       1,207,000
____________________________________________________________________________________________________________________________________________
|
Average to Current P/E
Ratios |
              (CINF)     Cincinnati Financial Corp.

                               2015    2016    2017    2018    2019

          Annual Earnings:     3.83    3.55    6.30    1.74   12.10
Average Price During Year:    53.35   68.60   74.00   74.32   98.65

                P/E Ratio:    13.93   19.32   11.75   42.71    8.15

 Average 5-Year P/E Ratio  =  19.17
             Current Price =  115.21

Previous 5 Quarter Earnings:  -2.78    4.22    2.59    1.50    3.79

          Current Annualized (Last Four Quarters) Earnings =   7.88
                                                           ________
                                 Average PE / Current PE =     1.31
                                                           --------

                                      ...a number above 1.00 is good
                                                1.00 or below is bad
|
Financial
Ratios |
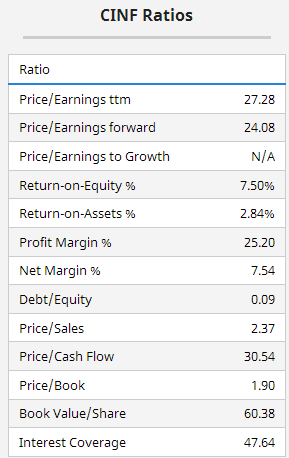
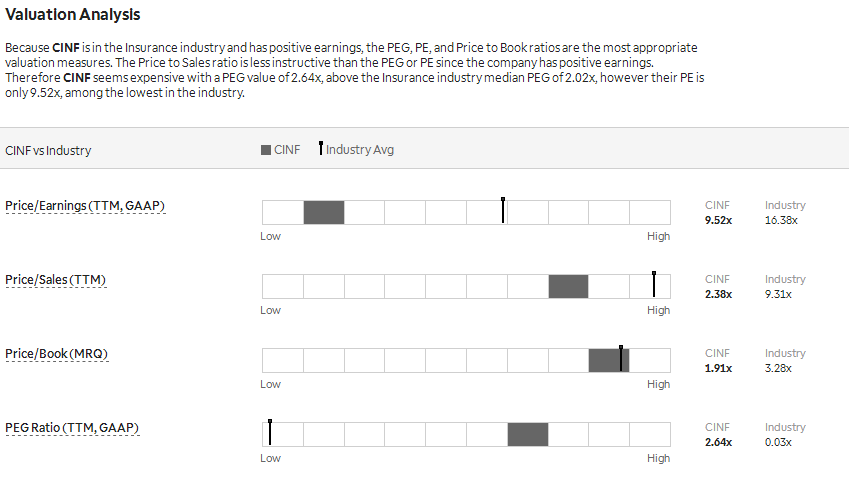
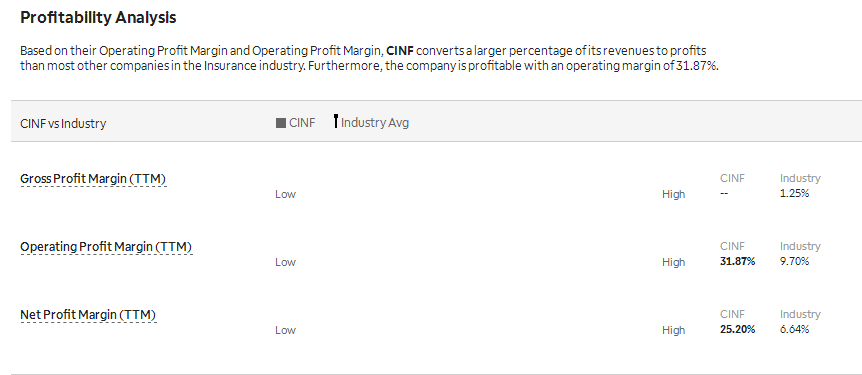
. . . . . . . . . . . . Lowest to Highest, Compared to Industry
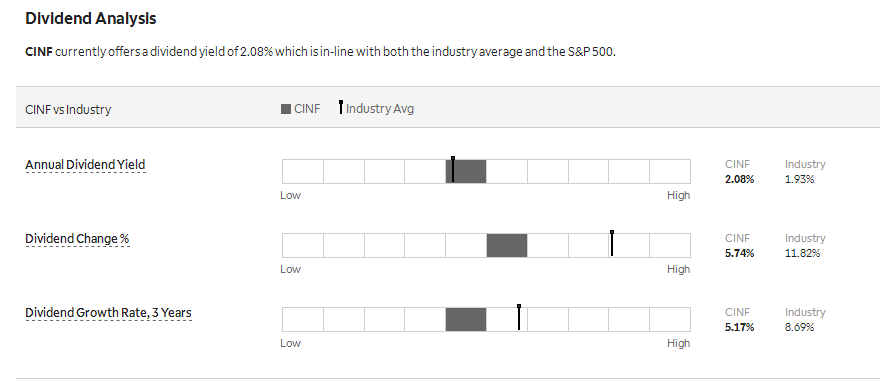
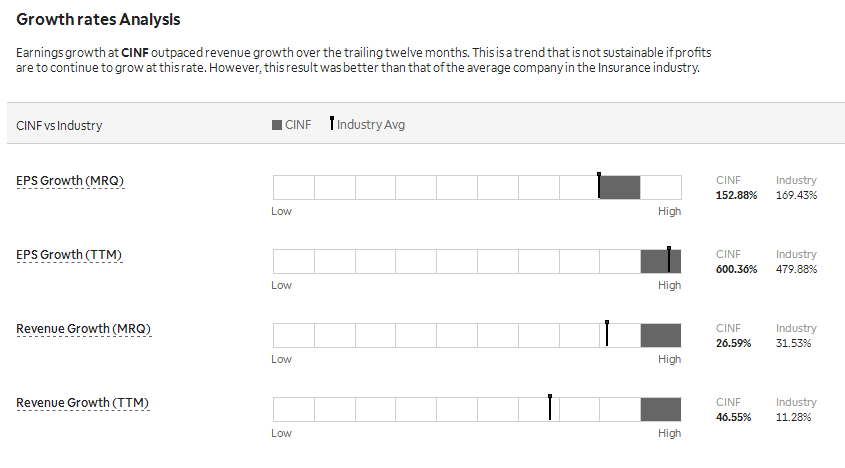
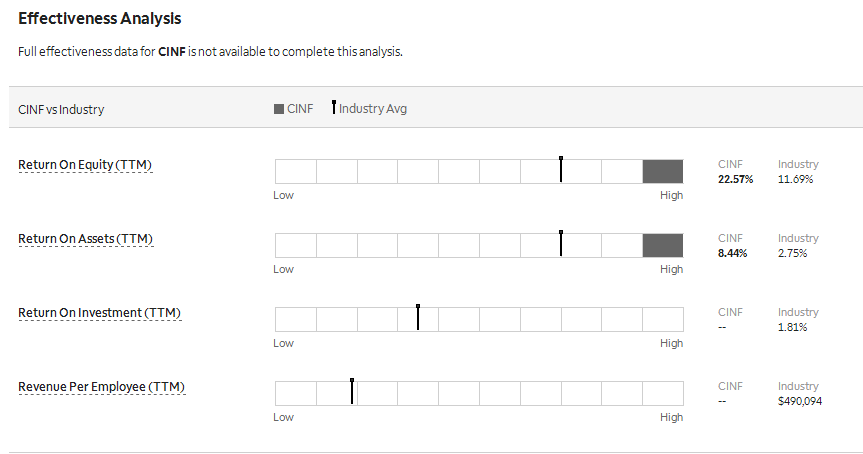
|
Intrinsic Value
(DCF) |
Intrinsic Value by Discounted Cash Flow Method:
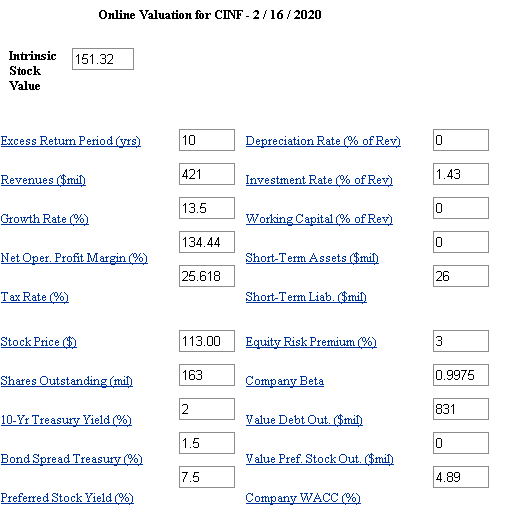
|
Fair Value
Estimator |
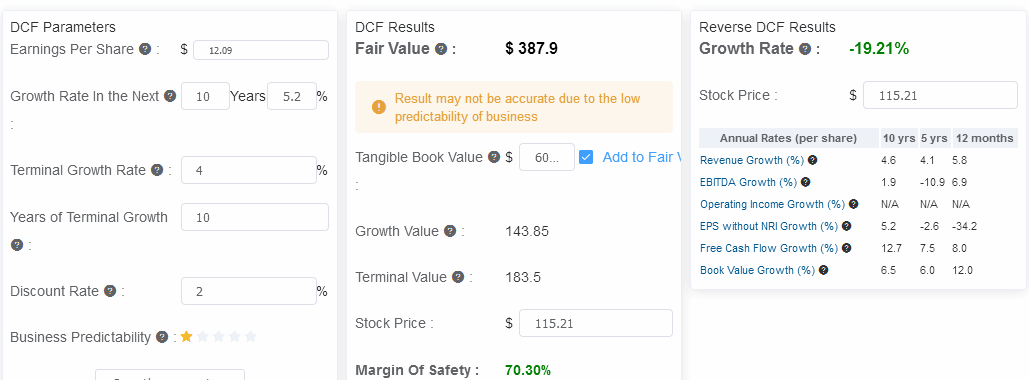
Fair Value Estimate:
|
Projected
Earnings |

|
Research
Reports |
|
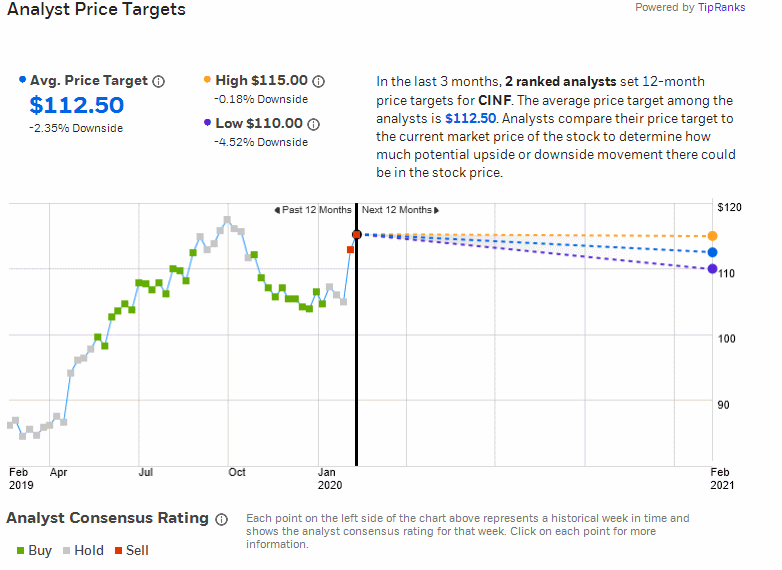
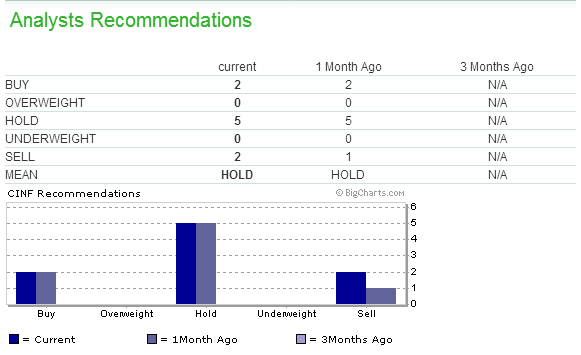
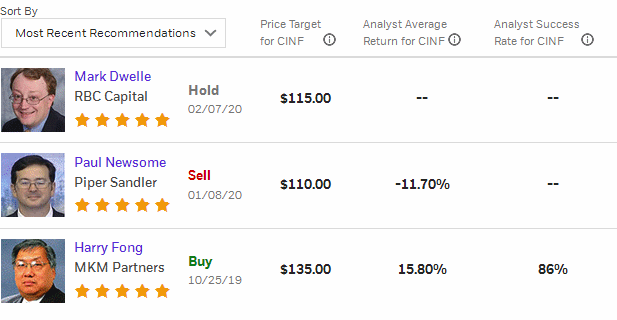
Analysts'
Opinions |
|
Insider
Activity |
|
Institutional
Activity |
Institutional Ownership:
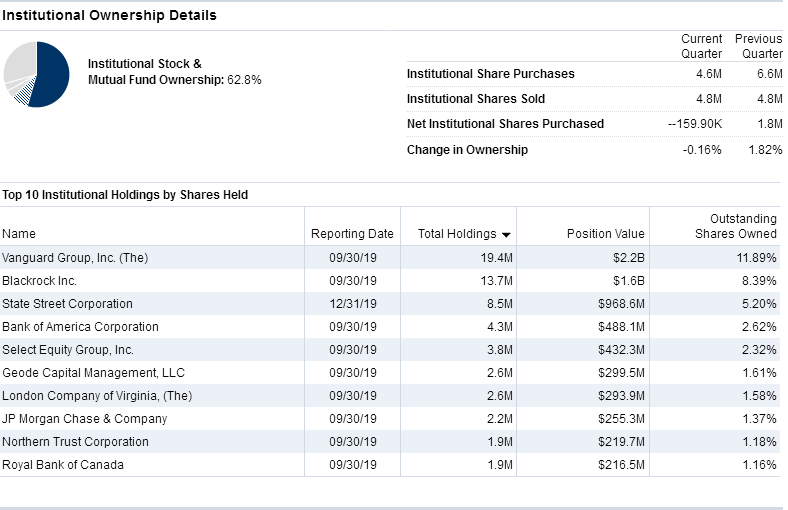
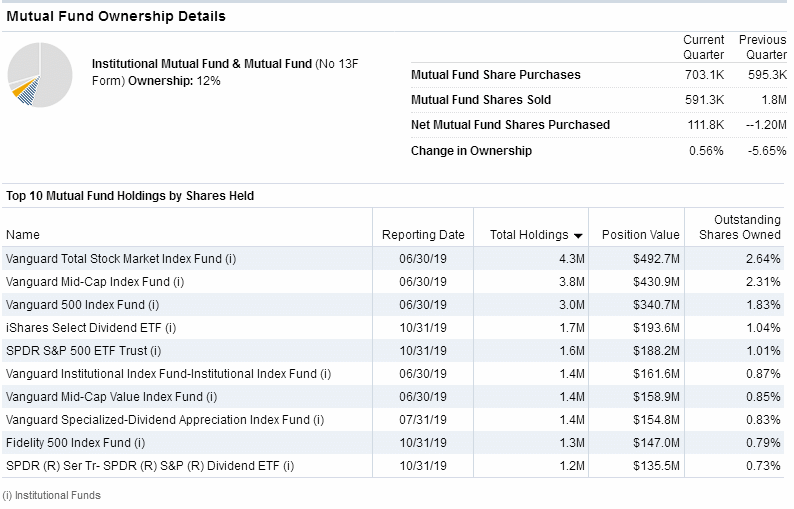
|
Sentiment
|

Zenith uses the "sentiment" score above or below 50 to award a positive or negative point in the Decision Matrix.


|
Short Interest
Ratio |
As the short interest rises as a percentage of average daily share volume (Days to Cover), this is considered a measure of negative sentiment. Similarly, a decrease in that percentage is considered positive sentiment.
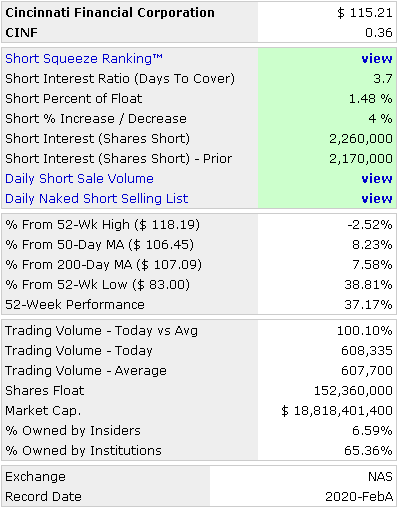

|
Standard &
Poor's |
|
Management's Discussion of
Results of Operations Excerpts |
|
Channeling
Potential |
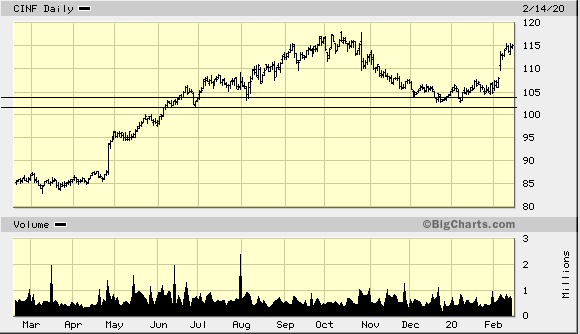
The summary below includes a value for `Degree,' which refers on a
scale of 1 to 10 the range of a channel in the period under consi-
deration compared to the total range of price movement. It also looks
for the last closing price to be within the channel, otherwise zeroed.
The `Index' is the `Degree' weighted for volatility.  Generally, the
the higher the index, the more suitable is the stock for trading as
a `rolling stock' between channel high and low points.

Results for CINNCINATI FINANCIAL CORP.:
Symbol? CINF
Total Months Available:  25
       Months in Cycle?   4

Months Covered by Periods:  12

Period 1           Period 2          Period 3
   H1      L1        H2      L2        H3      L3
 103.41   83.00    118.19  101.55    117.90  102.69

RANGE   = 118.19  TO   83.00            Close = 114.08
CHANNEL = 103.41  TO  102.69           Degree =   0
Volatility =   0.63%                    Index =   0
|
MACD Histogram
Divergence |
The theory is that connecting the two most recent peaks or valleys of the MACD histogram will signal the direction of the next major move.
|
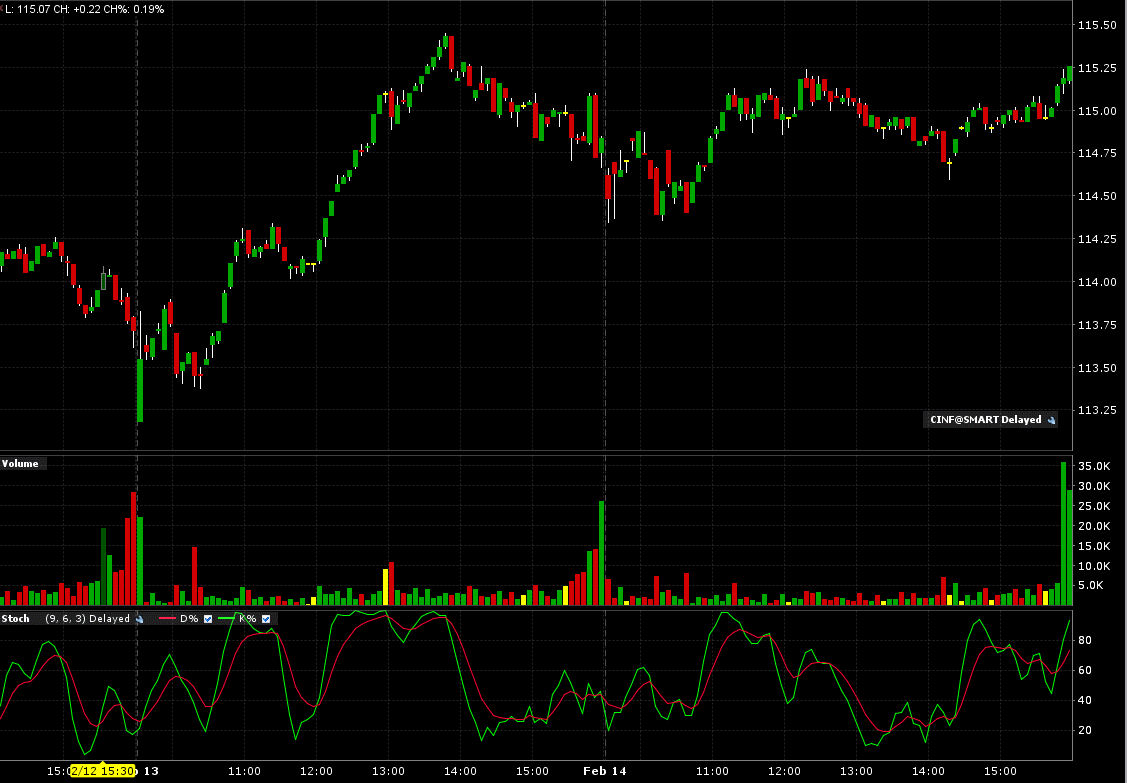
Intraday
Chart |
2 Days:
|
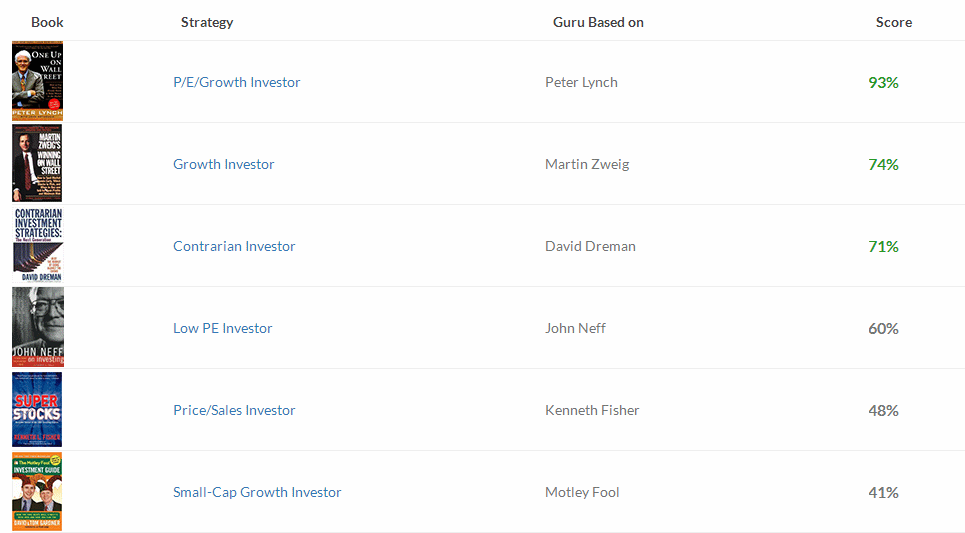
Val
Idea |
4 out of 9 favorable, (negative opinion.)

|
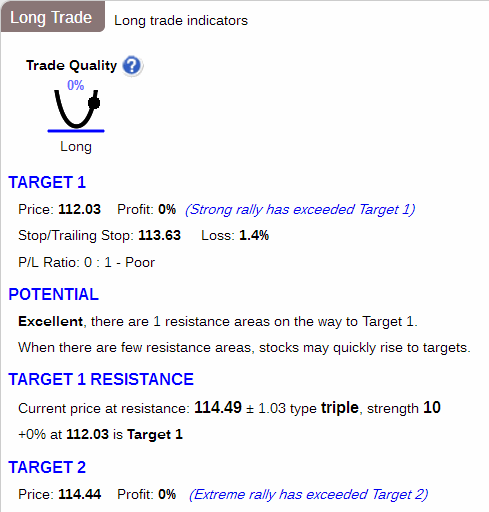
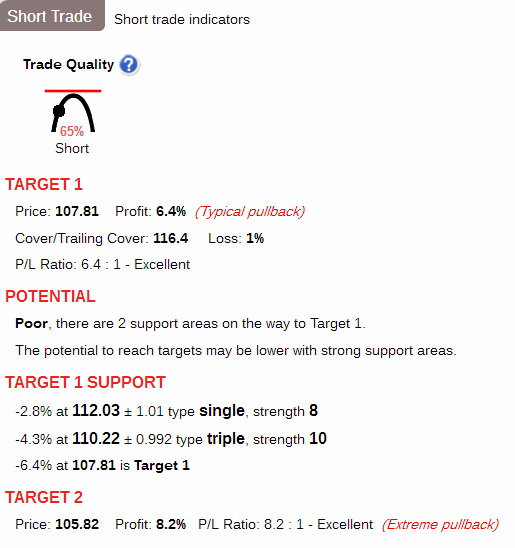
Stock
Consultant |
|
Point & Figure
Chart |
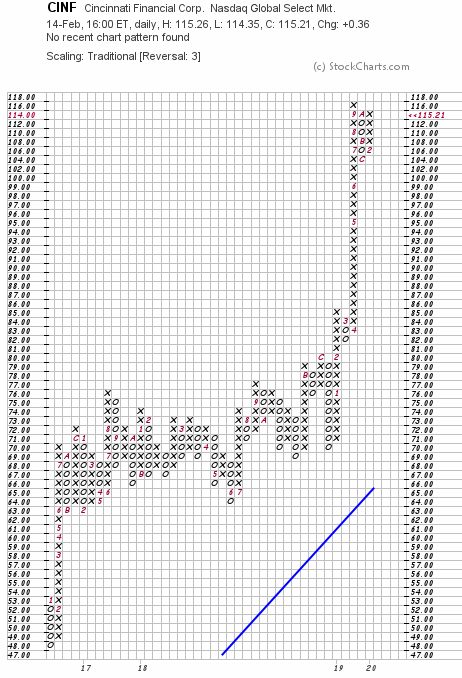
|
Wall Street
Analyzer |
|
Marketspace
Chart |
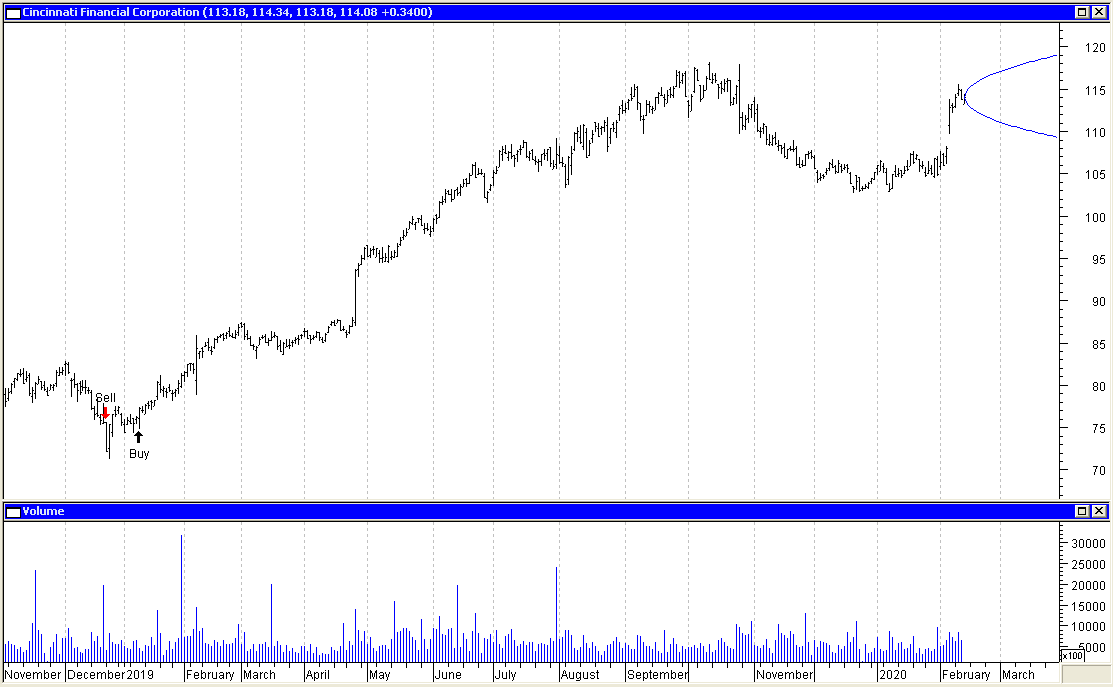
|
Time Series
Forecast |
|
Neural Network
Prediction |
"Neurostock" can only track long trades. Therefore its performance, as tracked by itself on stocks which are consistently falling, may not appear as good as it could if each "sell" signal were a "short sale."

![]()
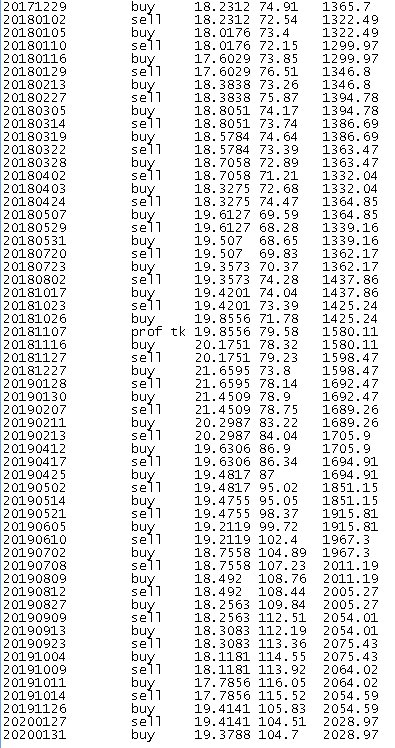

|
Ultimate Trading
Systems |
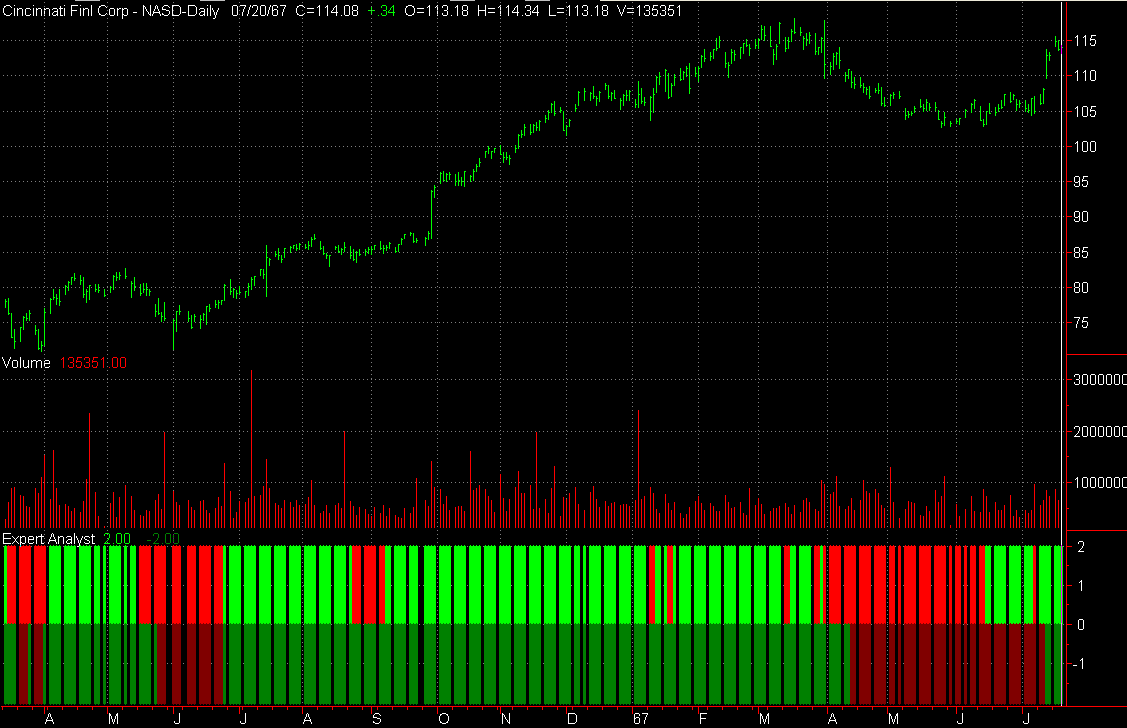
2 out of 3 of the ultimate systems favor an upmove.
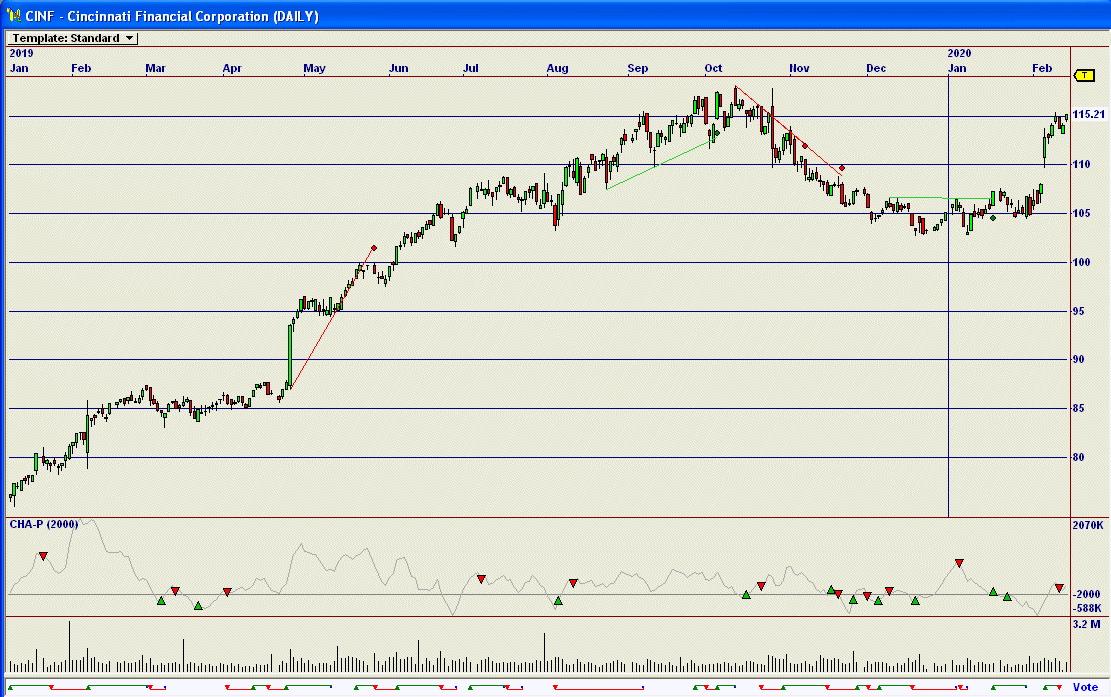
System Below:
Short term outlook: Positive: Bright Green, Negative: Bright
Red
Long term outlook: Postive: Dark Green, Negative: Dark Red.

|
Recommendation |
| Factors | Weighted Points |
|---|---|
| News | + 1 |
| Comparison | + 1 |
| Industry | + 1 |
| Bond Issue | + 1 |
| Zenith Index | - 1 |
| Non-GAAP vs. GAAP Earnings | - 1 |
| Cash Flow | + 1 |
| Average to Current P/E | + 1 |
| Ratios | + 1 |
| Intrinsic Value DCF | + 1 |
| Fair Value Estimator | + 1 |
| Projected Earnings | + 1 |
| Research Reports | + 1 |
| Analysts | - 1 |
| Executive Perquisites | - 1 |
| Insider Activity | - 1 |
| Institutional Activity | - 1 |
| Management Reporting | + 1 |
| Short Interest | - 1 |
| Sentiment | + 1 |
| Standard & Poor's | - 1 |
| MACD Histogram Divergence | + 1 |
| Val Idea | - 1 |
| Stock Consultant | - 1 |
| Point & Figure | + 1 |
| Wall Street Analyzer | - 1 |
| Marketspace Chart | + 1 |
| Time Series Chart | - 1 |
| Neural Network | - 1 |
| Stock Options | + 1 |
| Ultimate Trading Systems | + 1 |
| Total | + 5 |
Place 260 shares of Cinncinati Financial Corporation (CINF) on the Active List.