![]()
Corporate Webpages Arconic Inc.
Arconic, Inc. (ARNC) has been variously described as a metal
fabricator of specialty metals and parts or a basic materials
provider, most notably of aluminum. Lightweight aluminum is
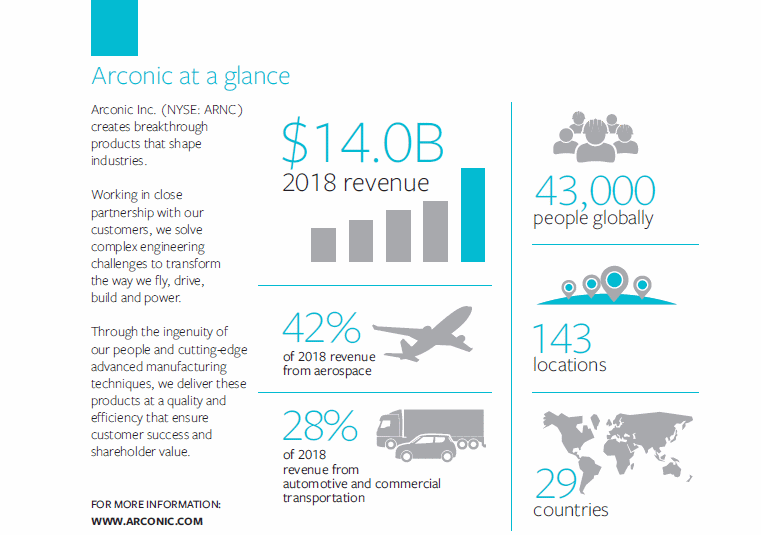
heavily used in aircraft manufacture and hence Arconic has a
close association with aerospace.
The company was listed as a separate entity well after 2013,
which is currently the year we try to accept only stocks listed
at or before that time in order to build up an adequate track
record. Some of our systems fail to predict well with less than
five years of financial tracking data, so we made a slight
mistake in selecting this company, but not too serious a one.
Perhaps the essential thing to grasp about this company is that
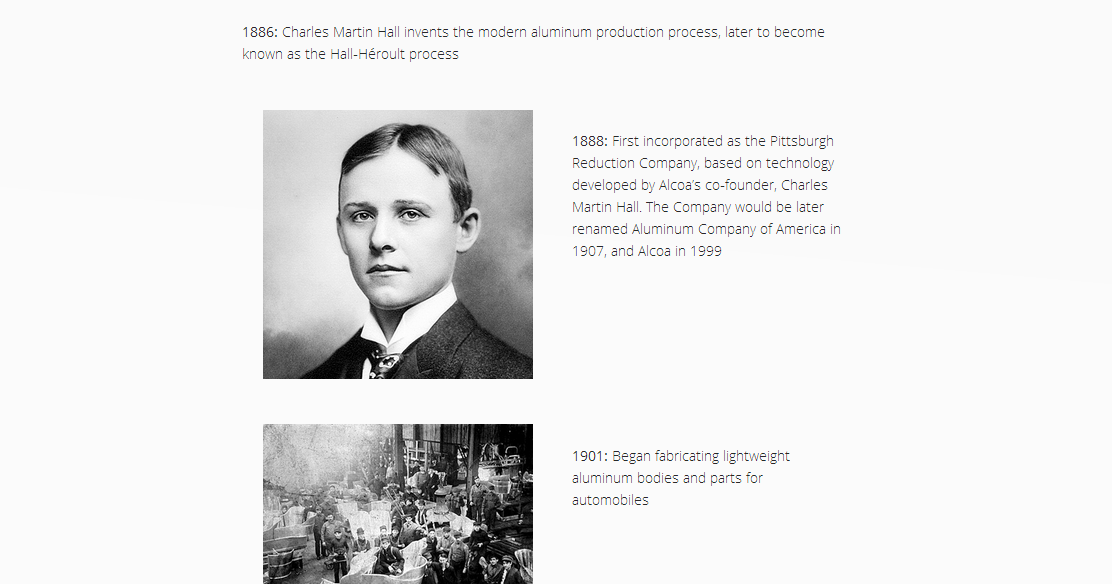
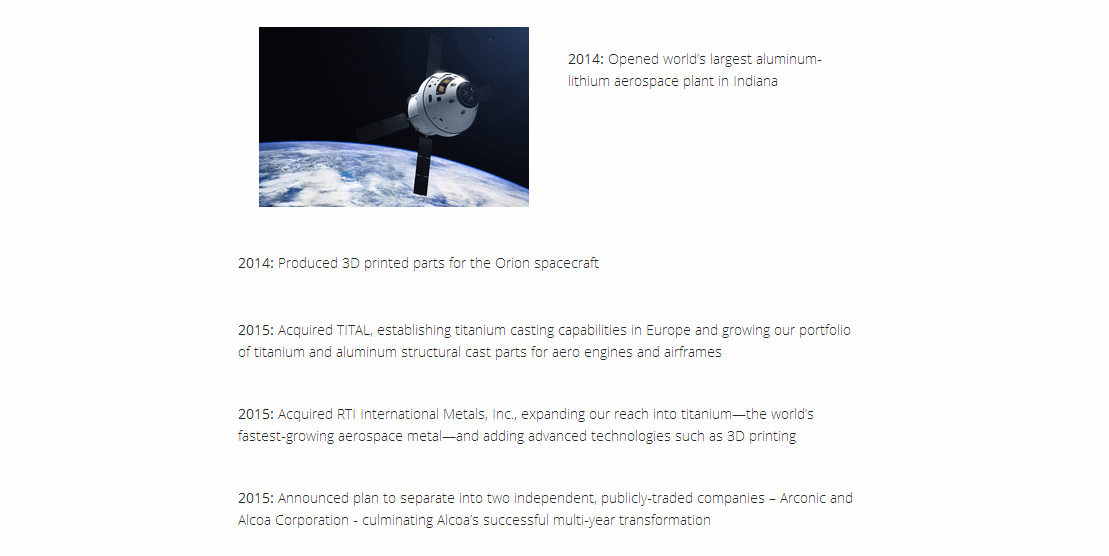
it IS the original Aluminum Company of America (Alcoa). In the
1960's and '70's the aluminum group of companies became one of
the darlings of Wall Street. In 2015, Alcoa decided to split
itself apart into two companies, with the basic metals and
mining end remaining "Alcoa" but Alcoa's global rolled products,
engineered products, and transportation and construction
solutions would form into a separate company, "Arconic."
Arconic has been plagued with further divestitures on top of
itself being divested from Alcoa. These divestitutes have had a
negative impact on earnings. They are signs of a troubled company.
Management has been putting forth restructuring and cost-cutting
proposals, buying back stock shares, and dealing with labor
difficulties, especially with the United Steelworkers of America
union.
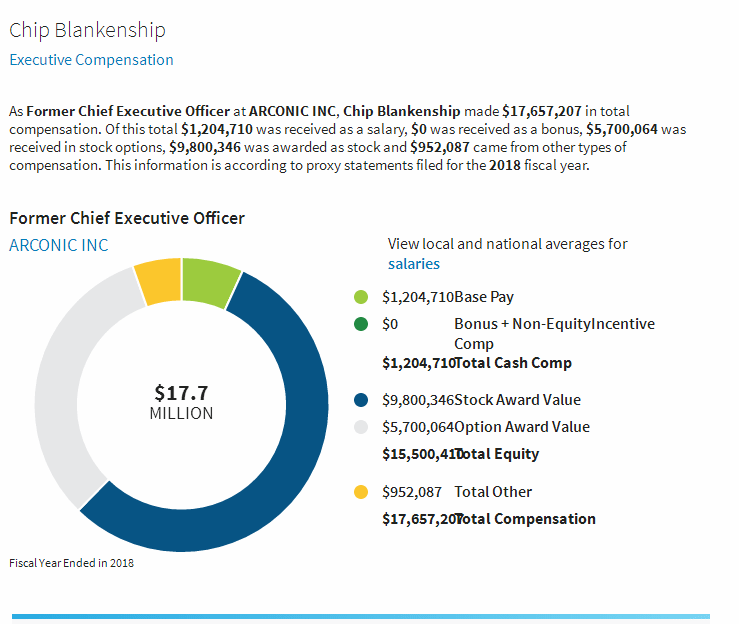
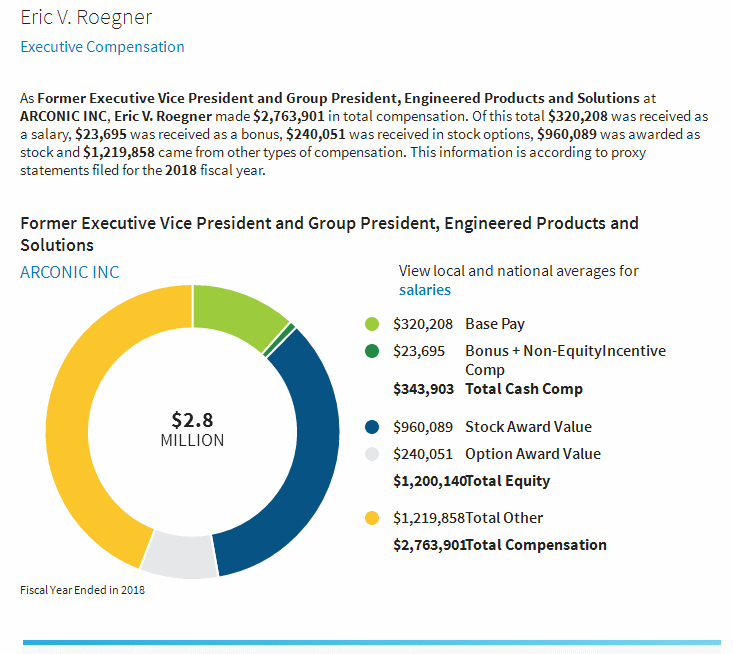
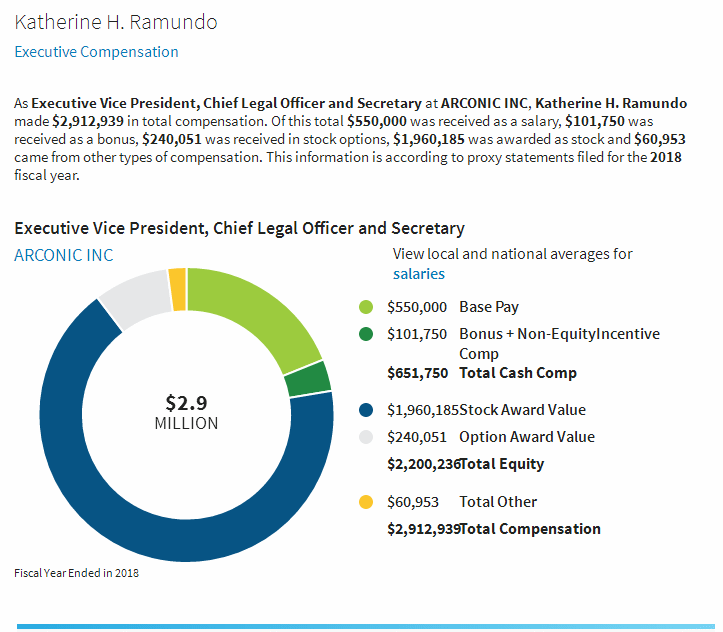
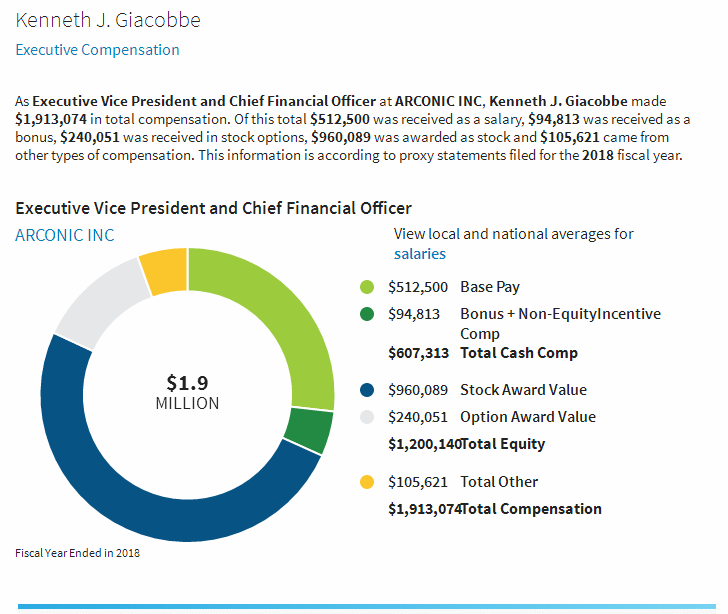
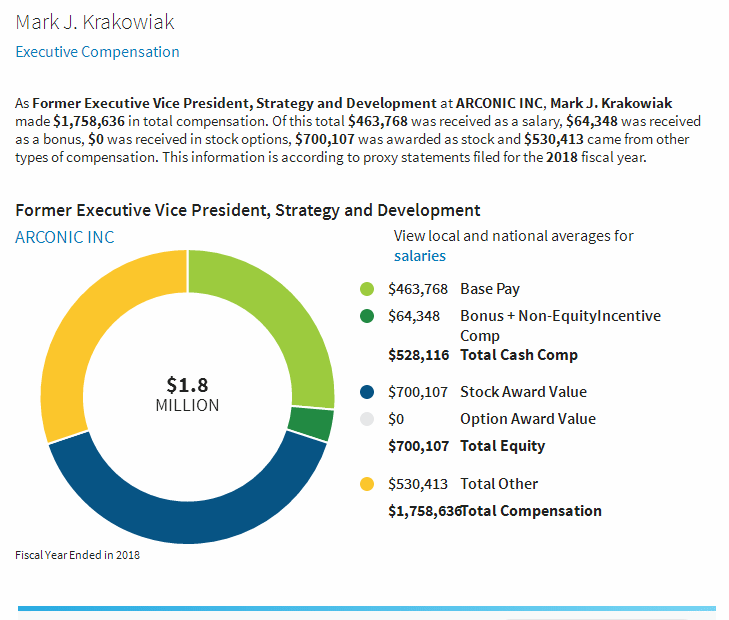
We think the CEO is way over-compensated and there other less
prominent leaders also feeding at the trough. Compensation
appears to represent poor corporate governance.
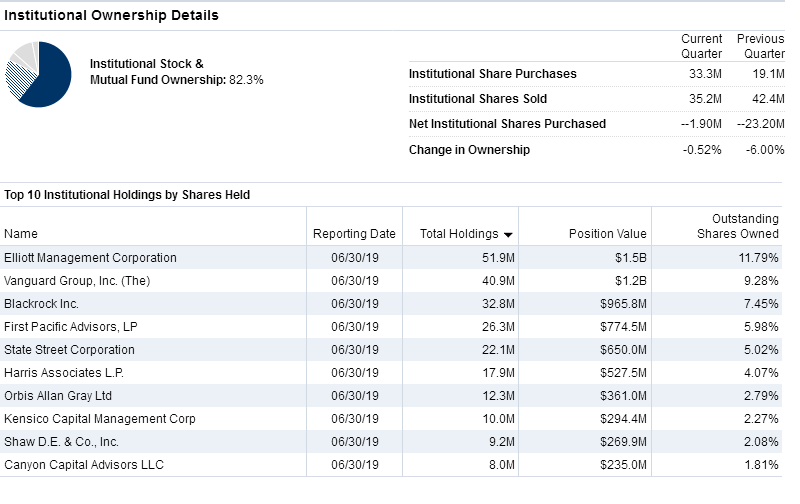
Adding to all that is activist shareholder intervention to
criticize management, particular from Elliot International which
is a big holder of shares. Elliot and other institutional
investors have been selling off shares. Another activist
investor, Apollo Management, one of the worst managers that has
devastated corporations it takes over also showed interest in
acquiring the huge Arconic, Inc. Rumors surrounding potential
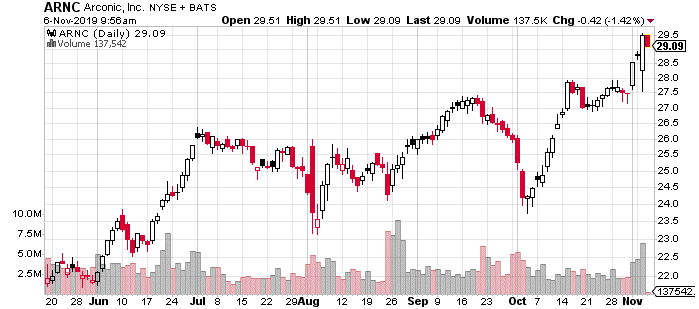
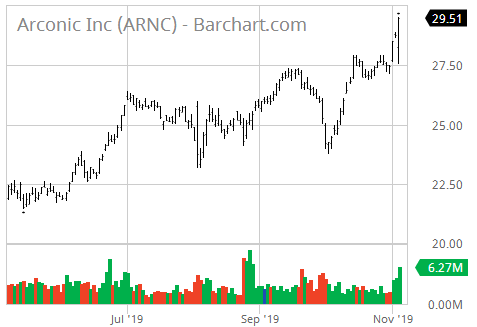
buyers cause the stock to make occasional quantum jump moves but
within a fairly limited trading range, perhaps hindered by the
size of the corporation. So our conclusion is that it might
make a "forgiving" trading stock vehicle.
Because the company's parts are so essential to certain
industries, especially aircraft manufacturers, and air travel is
increasing, prospects look good. However, attempts to branch
out into other areas such as building materials have led even to
lawsuits regarding at least one material supplied to be the
cause of a major fire. Current class action lawsuits related to
that are affecting the company.
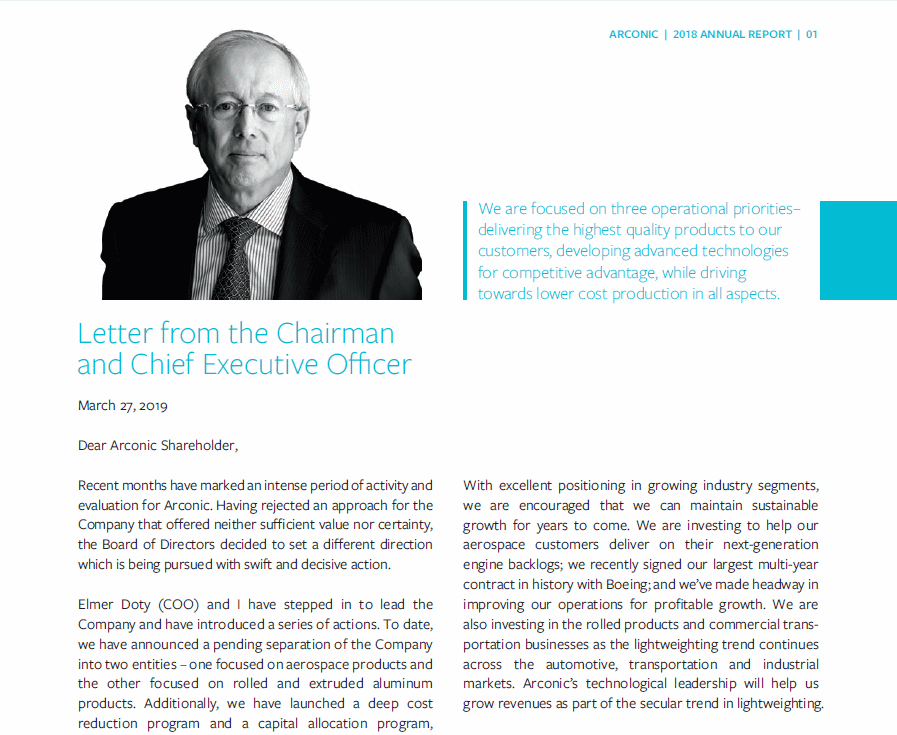
It has what we regard as a very good website describing its products as
well as glitzy annual report and CEO Letter to Shareholders, expressing
optimism.
(WAIT FOR PAGE TO LOAD COMPLETELY BEFORE LINKS WORK.)
Company Profile
Company History
News
Comparison with Peers
Bond Issue
Zenith Index
Financial Statements
Avg. P/E to Current P/E
Financial Ratios
Intrinsic Value (Disc. CashFlow)
Fair Value Estimator
Projected Earnings
Research Reports
Analysts' Opinions
Insider Activity
Institutional Activity
Sentiment
Short Interest
Standard & Poor's
Management's Discussion
Channel Potential
MACD Histogram
Intraday Chart
Val Idea
Stock Consultant
Point & Figure Chart
Wall Street Analyzer
Marketspace Chart
Time Series Forecast
Neural Network Prediction
Stock Options
Ultimate Trading Systems
Recommendation


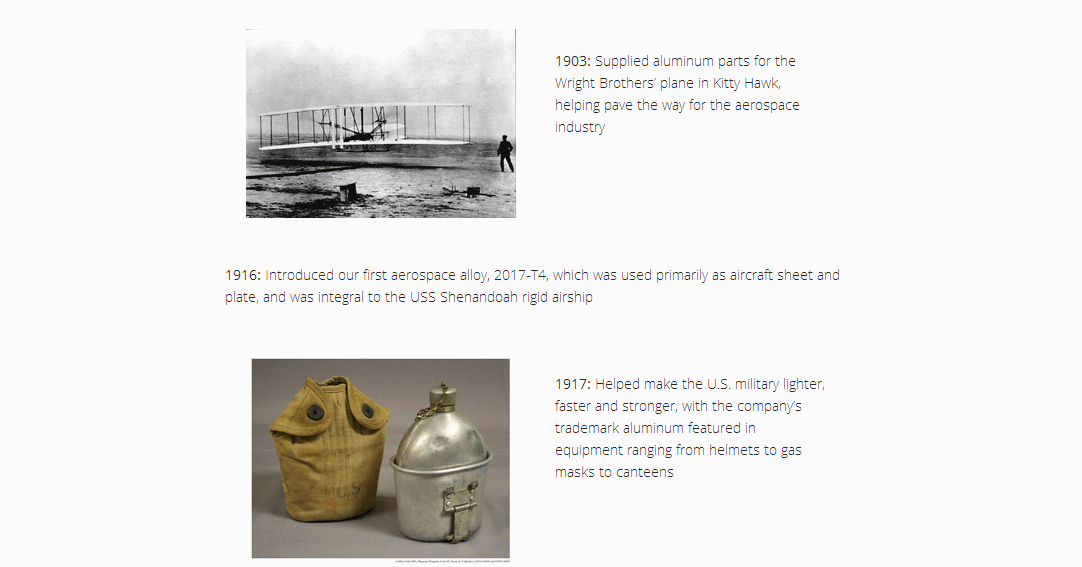
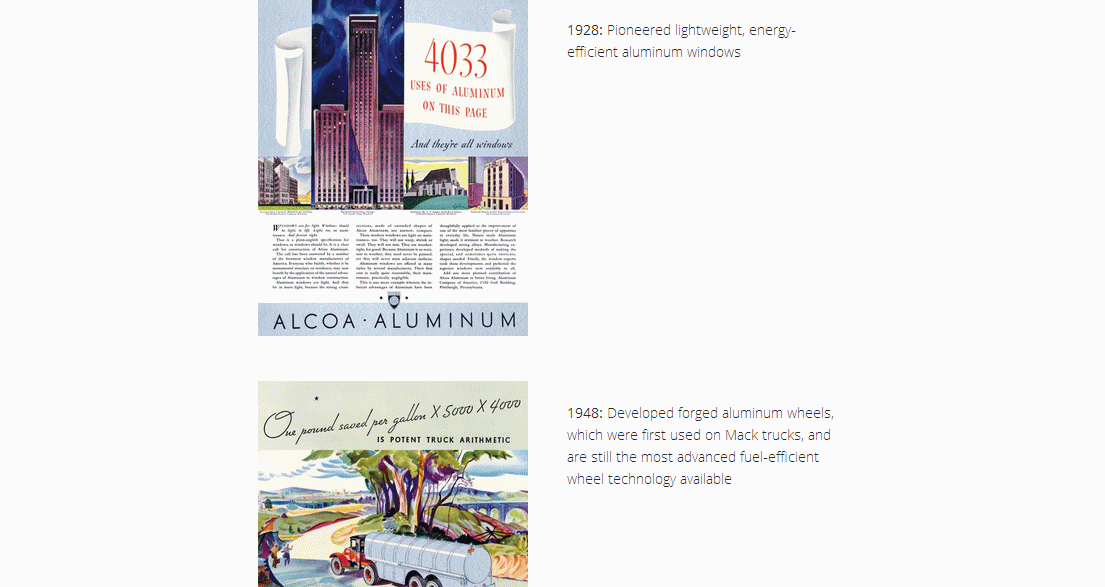
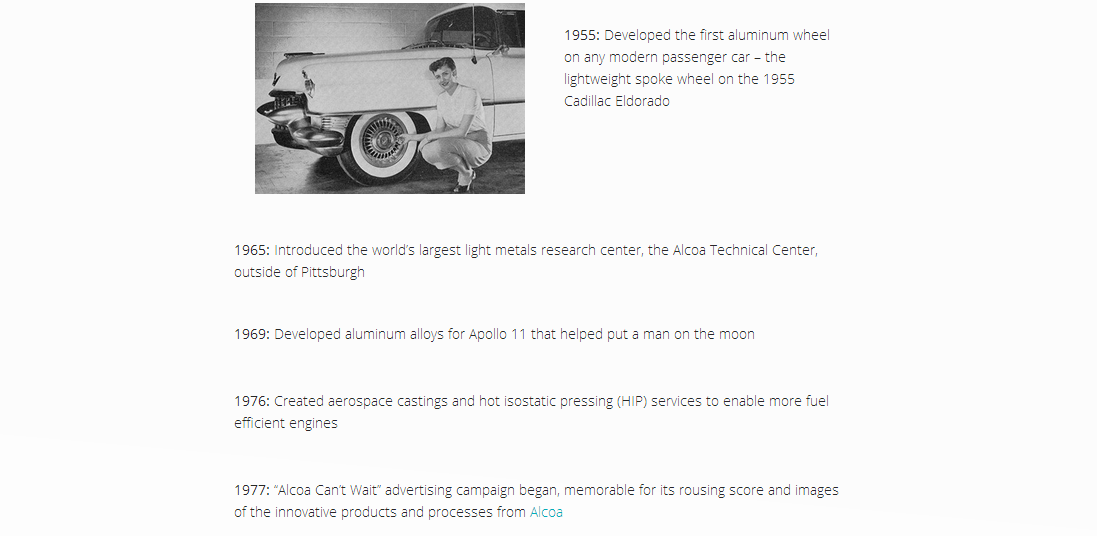
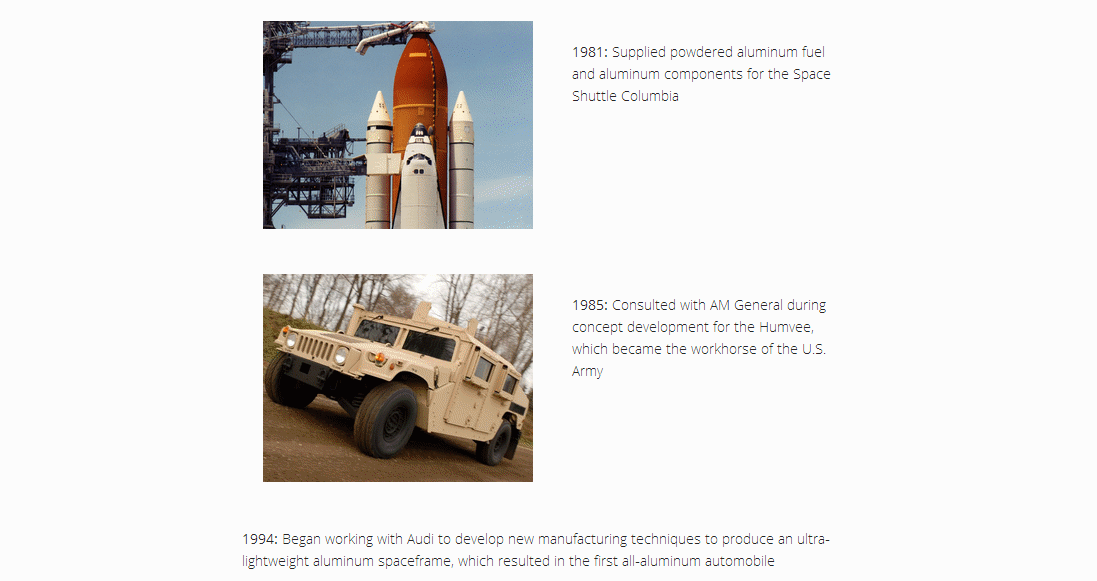

Company Profile |

Company History |
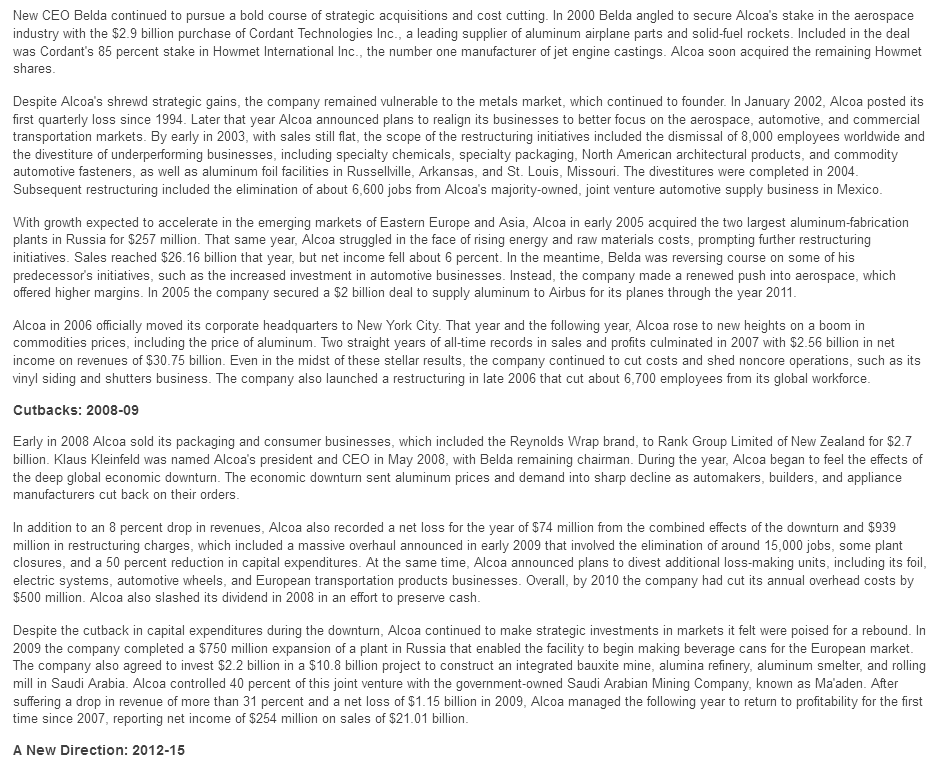
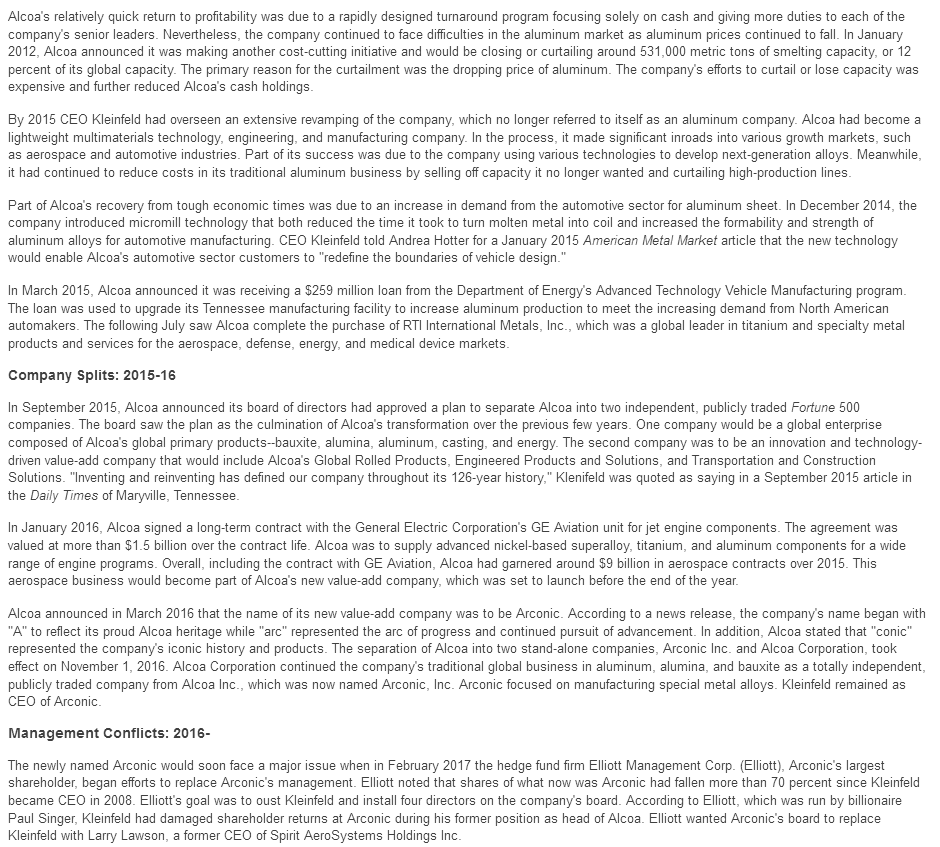
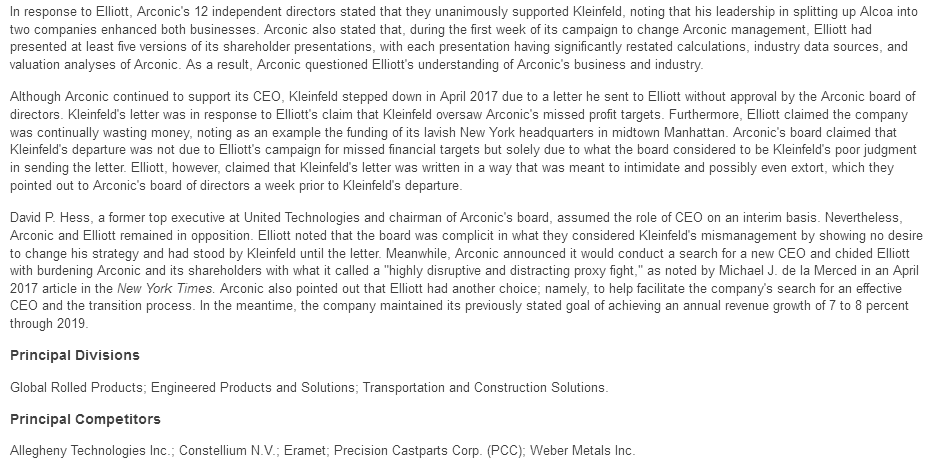
News |
Comparison |
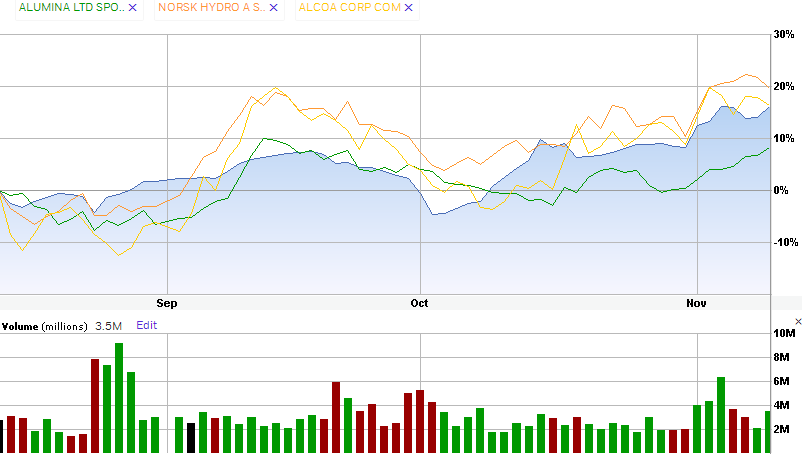
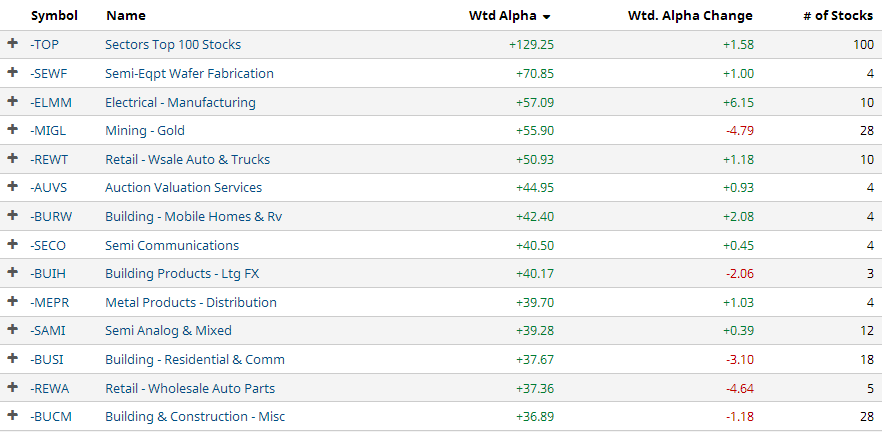
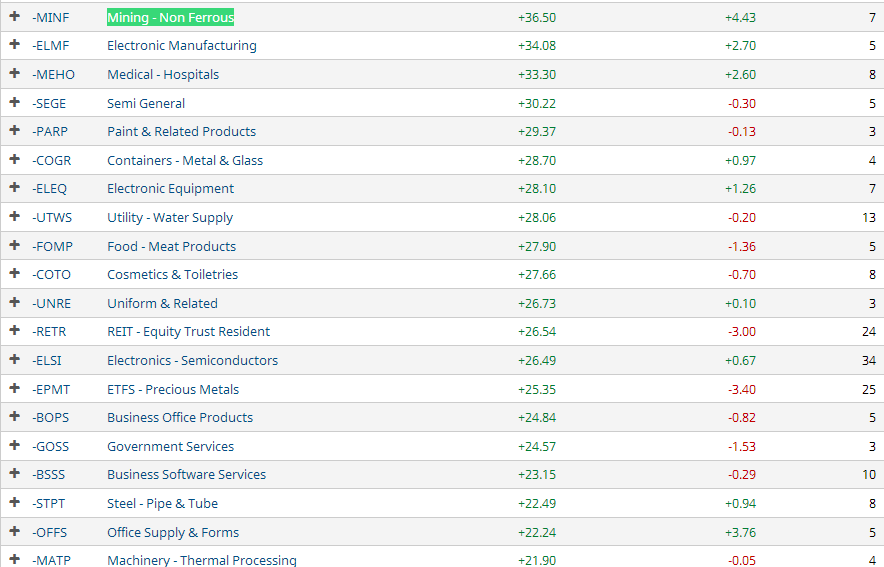
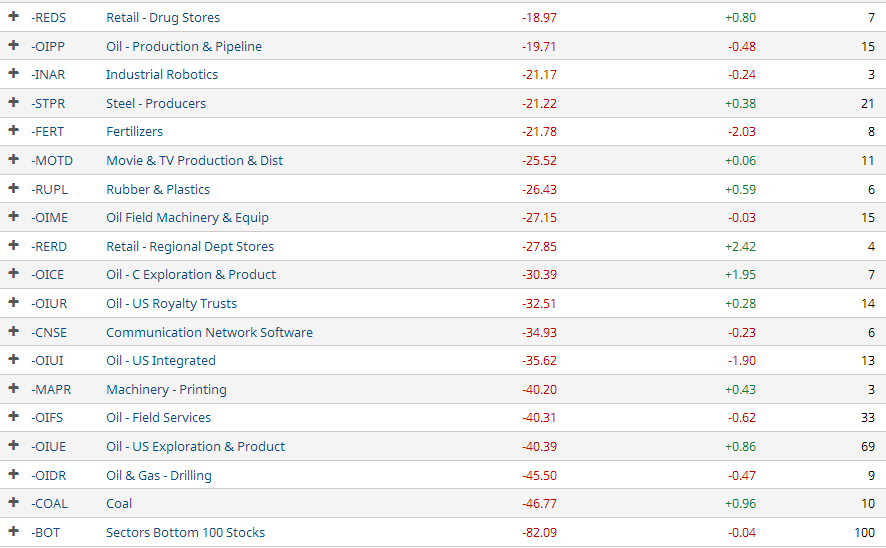

Similar Companies Performance:
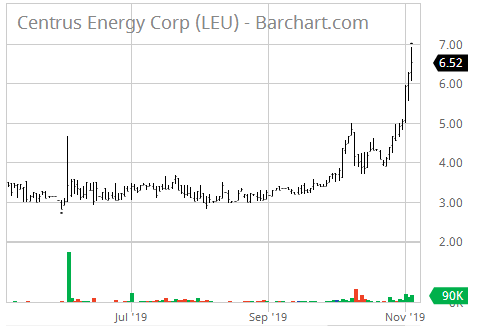
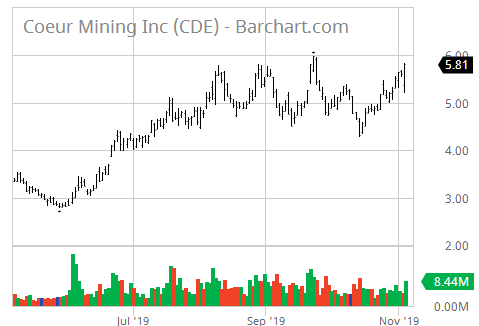
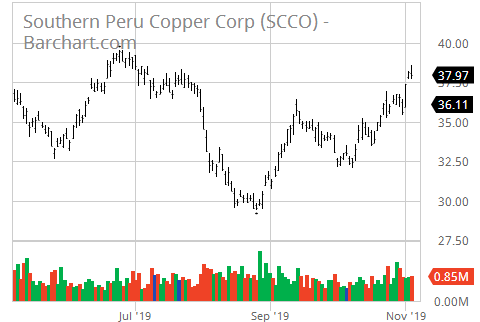
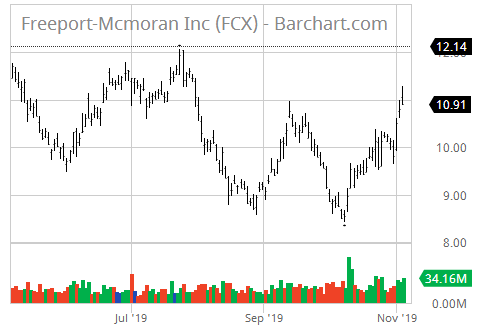
Bond Issue |

Zenith Index |
Under current market conditions, a Zenith Index Score of 1.20 or above is required for a positive rating on this factor. 1.21 -1.30 is considered acceptable, 1.30-1.40 is considered strong and
> 1.40 is considered exceptionally strong. Accounting statements in this section often contain mistakes, especially in earlier years' totals, but data is deemed sufficient for us to give a rating. More accurate financial statements follow in the next section.
Arconic Inc. (ARNC)                                       Exchange: NYSE
390 Park Avenue
New York, NY 10022               Sector: Industrials
United States                    Industry: Diversified Industrials

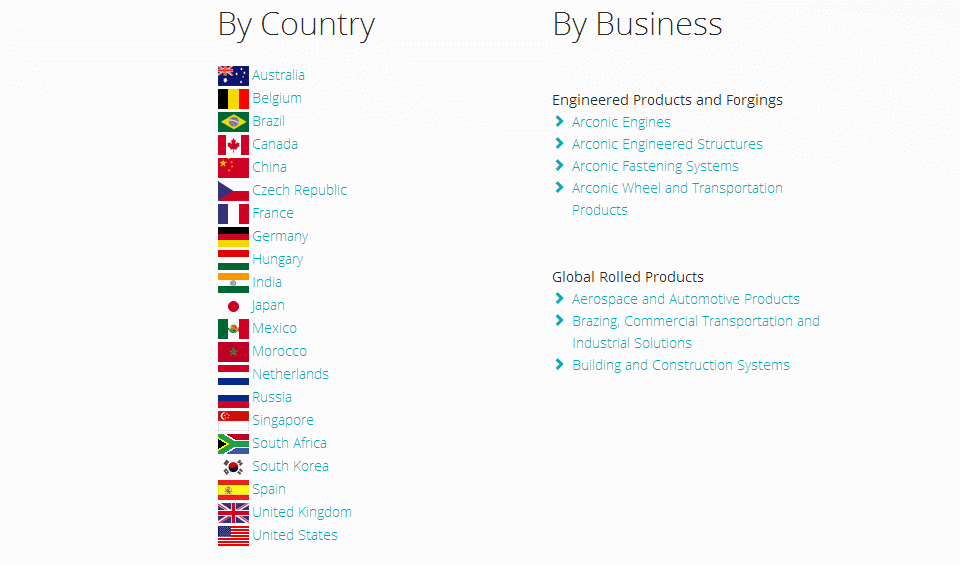
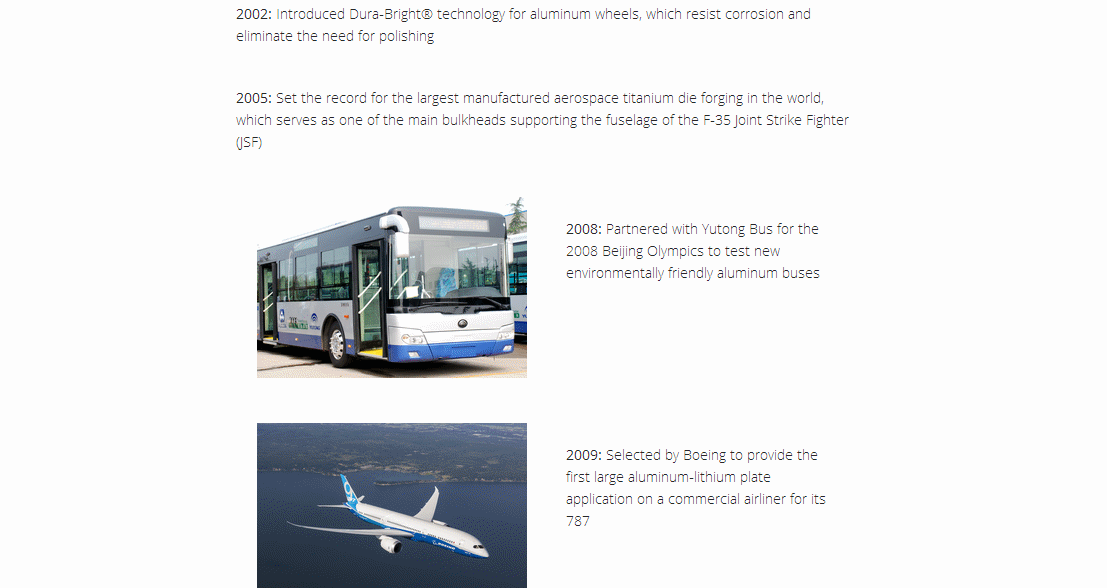
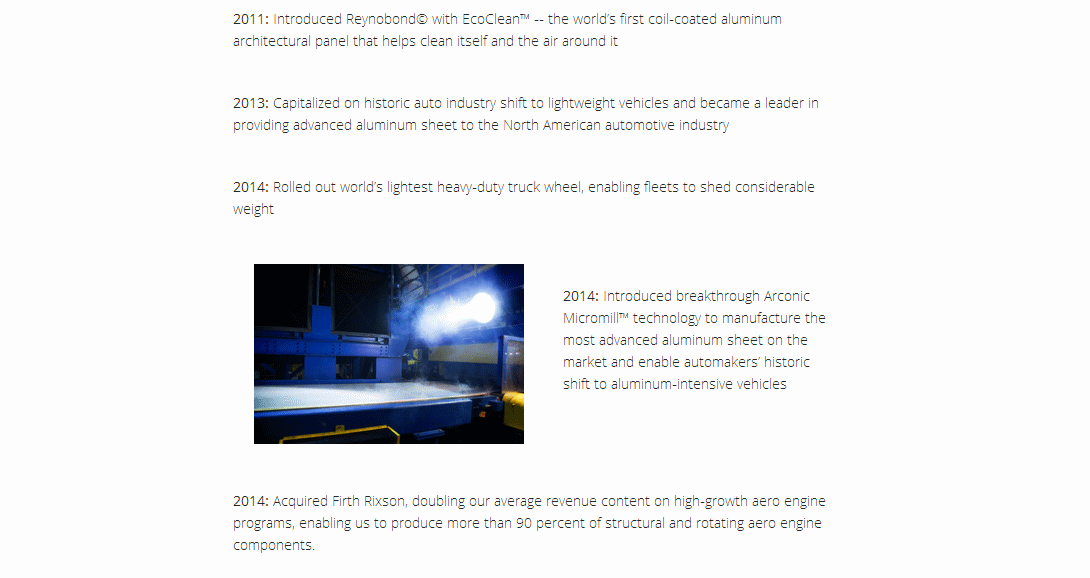
Arconic Inc. engineers, manufactures, and sells lightweight metals
worldwide. The company operate in three segments: Engineered Products
and Solutions, Global Rolled Products, and Transportation and
Construction Solutions. The Engineered Products and Solutions segment
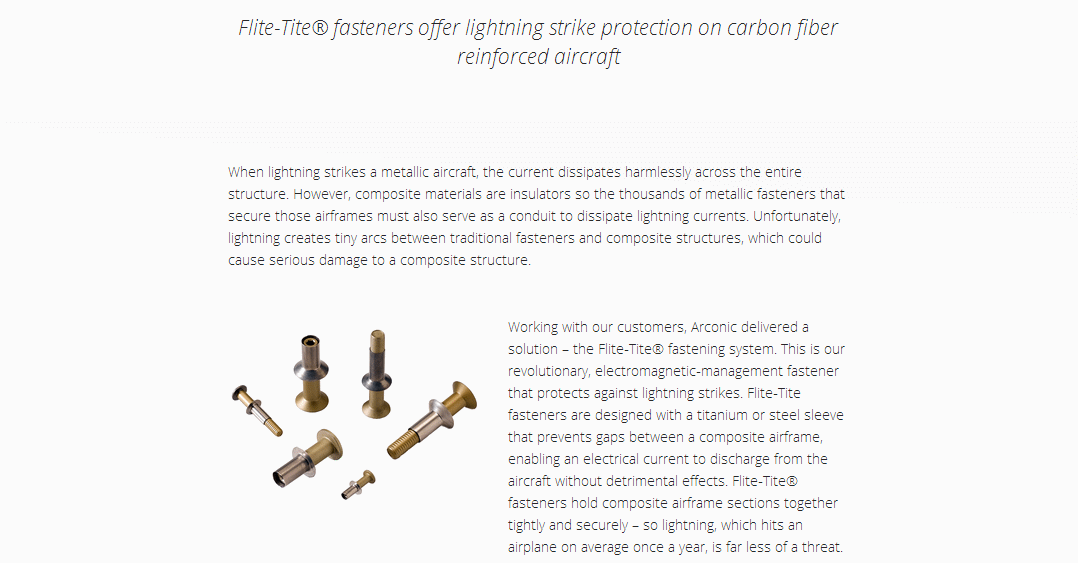
produces and sells fastening systems and seamless rolled rings;
investment castings, including airfoils and forged jet engine
components; and extruded, machined, and formed aircraft parts for
aerospace (commercial and defense), industrial, commercial
transportation, and power generation end markets. It also offers various
forged, extruded, and machined metal products for the oil and gas,
automotive, and land and sea defense end markets. The Global Rolled
Products segment produces and sells aluminum sheets and plates for the
aerospace, automotive, commercial transportation, packaging, building
and construction, and industrial products end markets; and aseptic foils
for the packaging end market. The Transportation and Construction
Solutions segment provides integrated aluminum structural systems,
architectural extrusions, and forged aluminum commercial vehicle wheels,
which are used primarily in the commercial transportation and
nonresidential building and construction end markets. It also produces
aluminum products for the industrial products end market. Arconic Inc.
sells its products directly to customers, as well as through
distributors. The company was founded in 1888 and is based in New York,
New York.

Last Trade:  28.91                           52-Week Range:  29.55 -  15.63
Employees: 43,000                            Avg.Volume:   3,167,328 Shares

Corporate Governance:
Pllar scores are Audit: 1; Board: 3; Shareholder Rights: 3; Compensation: 10.
         (A lower number means less governance risk.)

EPS:  0.81    Dividend Amount: $ 0.08          Yield:  0.27%
             Ex-Dividend Date: Nov 6, 2019     Payout Ratio:  20.25

Key Statistics:

    Trailing P/E:  35.59              Forward P/E (est.):  12.07
                                           Target Price:  30.67

Qrtly Stock Price Growth (yoy):  43.97%               Beta:   2.03
Qrtly S&P Index   Growth (yoy):   1.00%        Short Ratio:   2.62%
    Qrtly Revenue Growth (yoy):  52.00%         Shares Out:  433390000
   Qrtly Earnings Growth (yoy): -41.00%

          Book Value:  10.69                    Debt/Equity: 140.28%
    Price/Book Value:   2.71        Operating Profit Margin:  10.43%
         Price/Sales:   0.88                  Profit Margin:   2.66%
         Market Cap:  12,542,000,000       Return on Equity:   7.52%
    Enterprise Value:  17,900,000,000      Return on Assets:   5.19%

    Operating Cash Flow:        217,000
         Free Cash Flow:       -997,000


Annual Income Statement:                          (All numbers in thousands)
  Period Ending                             12/31/2018  12/31/2017  12/31/2016

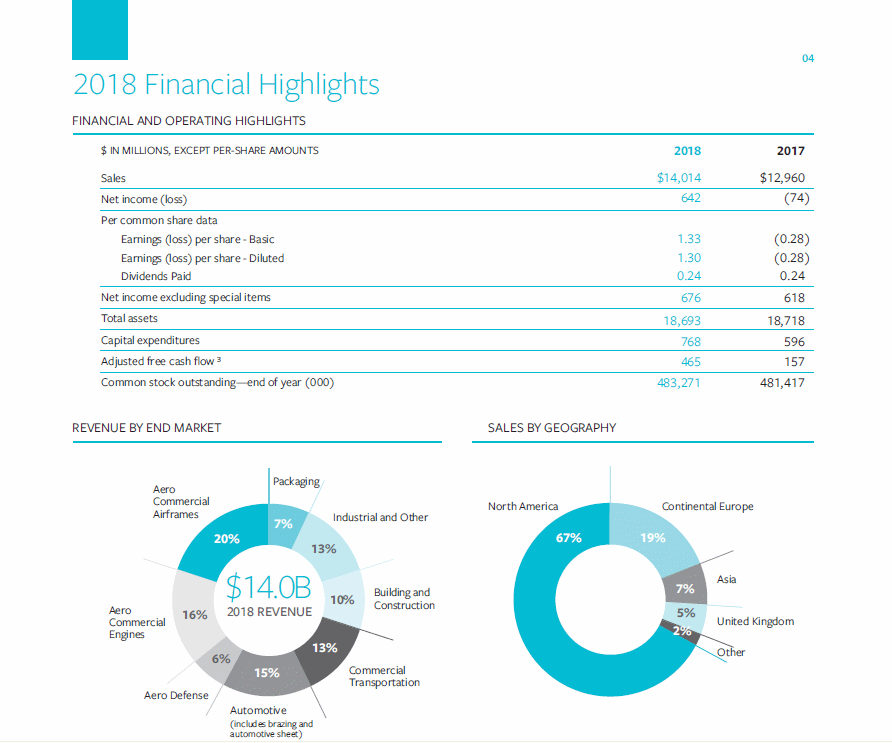
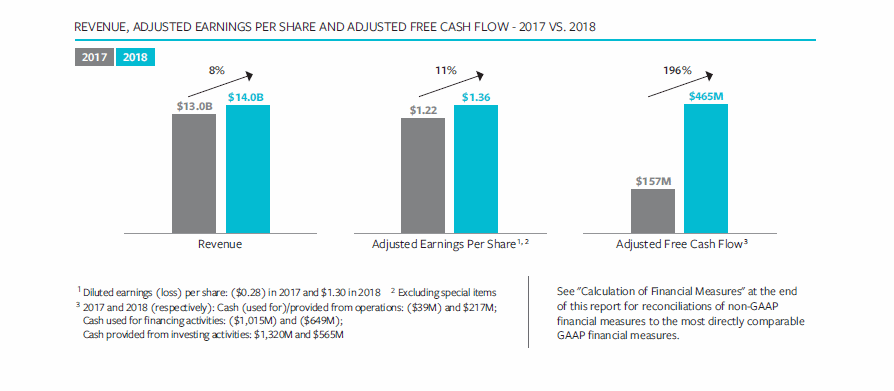
  Total Revenue                             14,014,000  12,960,000  12,394,000
  Cost of Revenue                           11,397,000  10,357,000   9,811,000
  Gross Profit                               2,617,000   2,603,000   2,583,000

Operating Expenses:
  Research & Development                       103,000     111,000     132,000
  Selling, General & Administrative            604,000     731,000     942,000
  Total Operating Expenses                   1,283,000   1,393,000   1,609,000

Operating Income or Loss                     1,334,000   1,210,000     974,000

Income from Continuing Operations:
  Total Other Income/Expenses Net              -88,000    -244,000     -77,000
  Interest Expense                             378,000     496,000     499,000
  Income Before Taxes                          868,000     470,000     414,000
  Income Tax Expense                           226,000     544,000   1,476,000

Net Income from Continuing Op.s                642,000     -74,000  -1,062,000

Non-recurring Events:
  Extraordinary Items                                0           0    -121,000
  Net Income                                   642,000     -74,000    -941,000

Net Income Avail to Common Shares              642,000     -74,000  -1,010,000


Annual Cash Flow Statement:                   (All numbers in thousands)
  Period Ending                         12/31/2018    12/31/2017    12/31/2016

  Net Income                               642,000       -74,000    -1,062,000

Operating Activities:
  Depreciation                             576,000             0             0
  Changes in Accounts Recv'bls          -1,142,000      -124,000      -238,000
  Changes in Liabilities                  -551,000       105,000      -255,000
  Changes in Inventories                   -74,000      -192,000       -29,000
  Changes in other Oper'g Acts          -1,306,000      -926,000    -1,102,000

Total Cash Flow f Operations               217,000       701,000       870,000

Investing Activities:
  Capital Exenditures                     -768,000      -596,000    -1,125,000
  Investments                                    0             0        10,000
  Other Cash Flows fr Investing          1,324,000       248,000       722,000

Total Cash Flows from Investing            565,000       540,000      -165,000

Financing Activities:
  Dividends Paid                          -119,000      -162,000      -228,000
  Sale of Purchase of Stock                      0             0             0
  Other Cash Flows fr Financing            -19,000       -31,000       722,000

Total Cash Flows from Financing           -649,000      -963,000      -754,000

Change in Cash & Cash Equiv.               129,000       287,000       -56,000


Annual Balance Sheets:                              (All Numbers in Thousands)
  Period Ending                          12/31/2018    12/31/2017    12/31/2016
Current Assets:
  Cash & Cash Equivalents                 2,150,000     1,863,000     1,362,000
  Short Term Investments                          0             0             0
  Net Receivables                         1,035,000       974,000       960,000
  Inventory                               2,480,000     2,253,000     2,284,000
  Other Current Assets                            0             0     2,556,000
  Total Current Assets                    6,378,000     5,892,000     7,953,000

  Long-Term Investments                  11,986,000    11,572,000    11,568,000
  Property, Plant & Equipt                5,594,000     5,499,000     5,425,000
  Goodwill                                4,535,000     5,148,000     5,249,000
  Intangible Assets                         987,000       988,000     1,104,000
  Other Assets                              481,000       155,000    15,245,000

Total Assets                             18,718,000    20,038,000    36,477,000

Current Liabilities:
  Accounts Payable                        1,839,000     1,744,000     1,510,000
  Current Portion LT Debt                   124,000       153,000       170,000
  Other Current Liabilities                 349,000       329,000     2,977,000
  Total Current Liabilities               2,824,000     2,749,000      5,211,000

  Long Term Debt                          6,806,000     8,044,000     8,786,000
  Other Liabilities                         759,000       240,000       290,000

Total Liabilities                        13,794,000    14,897,000    22,346,000

Stockholder Equity:
  Common Stock                              536,000       496,000     1,449,000
  Retained Earnings                      -1,248,000    -1,027,000     8,834,000
  Capital Surplus                        -2,644,000    -2,568,000    -5,431,000
  Total Stockholder Equity                4,910,000     5,115,000    12,046,000


Arconic Inc. (ARNC)                         [Indices near +3.0, near zero,
                                            or < zero bear special attention.]
P/E Ratio Tests:
P/E Ratio < 28?            0.7867          P/E Ratio > 5?             1.0000
P/E Ratio Vs Growth Rate: -3.0000          Forward P/E Ratio < 28?    2.3198
Price/Sales Ratio < 2.3?   2.6136          Inventory/Sales < 5%?      0.2825
Sales < $1 Billion?        0.0714          Operating Margin < 7.5%?   0.7191

Balance Sheet Tests:
Debt/Equity < 0.40?        0.2851          Long-Term Debt Service:    0.7235
LTD Being Reduced?         3.0000          Short-Term Debt Service:   0.0000
Current Ratio > 2?         1.1292          Working Capital >= 1.5?    0.6730
Leverage Ratio < 20%?      0.1874          Debt/Assets < 1?           2.7502
Quick Ratio > 1?           3.0000          Inventory Turnover > 1?    1.9330
Share Equity Increase:     1.3845          Market Cap.< 1.5 Billion?  0.1196
                                           Intangibles < 3% Assets?   0.1017
Income Tests:
Profit Margin < 7.5%?      0.3547          EPS Annual Growth > 10%?  -0.0115
Dividend Yield > 2.0%?     3.0000          EPS 3-yr Growth > 15?     -0.2360
Enterprise Value/Revenue   0.8953          EPS Growth Consistent?     2.0000
Enterprise Value/EBITDA:   3.0000          Collection < 45 days?      1.6693
EPS Qrtly Growth > 10%?   -0.0024          Gross Pft/Cur. LTD > 1?    3.0000
                                           Borrowing Int. Rate < 6%?  1.0803
Stock Performance Tests:
Volatility > 25%?          1.8843          % Held by Insiders < 5%?   3.0000
Beta > 1.25?               1.6240          % Held by Institut. < 50?  0.5524
50 Da MA > 200 Da MA?      0.2044          % Held by Institut. > 30?  3.0000
52-Wk Change vs. S&P 500:  0.8456          Short Ratio > 5?           0.5240
Price/Book Value < 3?      3.0000          Short % of Float > 20?     0.1210
Return on Assets > 17%?    0.3053          Average Volume > 100,000?  3.0000

Cash Flow Tests:
Oper. C.F. > Lever'd C.F: -0.2177          Positive Free Cash Flow?  -1.0000
Positive Oper. Cash Flow?  3.0000          Price to C.F.Ratio < 14?:  1.5974
                                           Cash Flow / Assets > 10%?  0.7645

ARNC   Arconic Inc.                        Overall Zenith Index:      1.1670
Financial Statements |
ARCONIC INC (ARNC) INCOME STATEMENT Fiscal year ends in December. USD in thousan 2014-12 2015-12 2016-12 2017-12 2018-12 TTM Revenue 12,542,000 12,413,000 12,394,000 12,960,000 14,014,000 14,263,000 Cost of revenue 10,349,000 10,104,000 9,811,000 10,357,000 11,397,000 11,402,000 Gross profit 2,193,000 2,309,000 2,583,000 2,603,000 2,617,000 2,861,000 Operating expenses Research and development 123,000 169,000 132,000 111,000 103,000 81,000 Sales, General and administrative 770,000 765,000 942,000 731,000 695,000 754,000 Restructuring, merger and acquisition 95,000 89,000 45,000 53,000 1,000 611,000 Other operating expenses 341,000 419,000 490,000 498,000 575,000 -55,000 Total operating expenses 1,329,000 1,442,000 1,609,000 1,393,000 1,374,000 1,391,000 Operating income 864,000 867,000 974,000 1,210,000 1,243,000 1,470,000 Interest Expense 442,000 473,000 499,000 496,000 378,000 343,000 Other income (expense) -309,000 -211,000 -61,000 -244,000 3,000 -630,000 Income before taxes 113,000 183,000 414,000 470,000 868,000 497,000 Provision for income taxes 174,000 339,000 1,476,000 544,000 226,000 118,000 Net income from continuing operations -61,000 -156,000 -1,062,000 -74,000 642,000 379,000 Net income from discontinuing ops 238,000 -41,000 184,000 0 0 0 Other 91,000 -125,000 -63,000 0 0 0 Net income 268,000 -322,000 -941,000 -74,000 642,000 379,000 Preferred dividend 21,000 69,000 69,000 53,000 2,000 2,000 Net income available to common shareholders 247,000 -391,000 -1,010,000 -127,000 640,000 377,000 Earnings per share Basic 0.56 -0.89 -2.31 -0.28 1.33 0.81 Diluted 0.56 -0.89 -2.31 -0.28 1.30 0.79 Weighted average shares outstanding Basic 438,000 438,000 438,000 451,000 483,000 459,000 Diluted 443,000 443,000 438,000 451,000 503,000 467,000 ____________________________________________________________________________________________________________________________________________ ARCONIC INC (ARNC) BALANCE SHEET Fiscal year ends in December. USD in thousan 2014-12 2015-12 2016-12 2017-12 2018-12 Assets Current assets Cash Total cash 0 1,362,000 1,863,000 2,150,000 2,277,000 Receivables 0 960,000 974,000 1,035,000 1,047,000 Inventories 0 2,284,000 2,253,000 2,480,000 2,492,000 Prepaid expenses 0 397,000 325,000 374,000 314,000 Other current assets 0 2,950,000 477,000 339,000 451,000 Total current assets 0 7,953,000 5,892,000 6,378,000 6,581,000 Non-current assets Property, plant and equipment Gross property, plant and equipment 0 11,568,000 11,572,000 11,986,000 12,473,000 Accumulated Depreciation 0 -6,143,000 -6,073,000 -6,392,000 -6,769,000 Net property, plant and equipment 0 5,425,000 5,499,000 5,594,000 5,704,000 Equity and other investments 0 193,000 1,122,000 0 0 Goodwill 0 5,249,000 5,148,000 4,535,000 4,500,000 Intangible assets 0 1,104,000 988,000 987,000 919,000 Deferred income taxes 0 1,308,000 1,234,000 743,000 573,000 Other long-term assets 0 15,245,000 155,000 481,000 416,000 Total non-current assets 0 28,524,000 14,146,000 12,340,000 12,112,000 Total assets 0 36,477,000 20,038,000 18,718,000 18,693,000 Liabilities and stockholders' equity Liabilities Current liabilities Short-term debt 0 41,000 40,000 38,000 434,000 Accounts payable 0 1,510,000 1,744,000 1,839,000 2,129,000 Taxes payable 0 103,000 85,000 75,000 118,000 Accrued liabilities 0 170,000 153,000 124,000 113,000 Other current liabilities 0 3,387,000 727,000 748,000 726,000 Total current liabilities 0 5,211,000 2,749,000 2,824,000 3,520,000 Non-current liabilities Long-term debt 0 8,786,000 8,044,000 6,806,000 5,896,000 Pensions and other benefits 0 3,079,000 3,450,000 3,623,000 3,148,000 Minority interest 0 2,085,000 26,000 14,000 12,000 Other long-term liabilities 0 5,270,000 654,000 541,000 544,000 Total non-current liabilities 0 19,220,000 12,174,000 10,984,000 9,600,000 Total liabilities 0 24,431,000 14,923,000 13,808,000 13,120,000 Stockholders' equity Preferred stock 0 58,000 58,000 55,000 55,000 Common stock 0 1,391,000 438,000 481,000 483,000 Additional paid-in capital 0 10,019,000 8,214,000 8,266,000 8,319,000 Retained earnings 0 8,834,000 -1,027,000 -1,248,000 -358,000 Treasury stock 0 -2,825,000 0 0 0 Accumulated other comprehensive income 0 -5,431,000 -2,568,000 -2,644,000 -2,926,000 Total stockholders' equity 0 12,046,000 5,115,000 4,910,000 5,573,000 Total liabilities and stockholders' equity 0 36,477,000 20,038,000 18,718,000 18,693,000 ____________________________________________________________________________________________________________________________________________ ARCONIC INC (ARNC) Statement of CASH FLOW Fiscal year ends in December. USD in thousan 2014-12 2015-12 2016-12 2017-12 2018-12 TTM Cash Flows From Operating Activities Net income 177,000 -197,000 -878,000 -74,000 642,000 379,000 Depreciation & amortization 1,372,000 1,280,000 1,132,000 551,000 576,000 556,000 Investment/asset impairment charges 0 25,000 0 719,000 0 0 Deferred income taxes -35,000 34,000 1,125,000 434,000 31,000 -100,000 Stock based compensation 87,000 92,000 86,000 67,000 50,000 51,000 Change in working capital -1,632,000 -1,375,000 -1,102,000 -926,000 -1,306,000 -1,334,000 Inventory -355,000 -64,000 -29,000 -192,000 -74,000 18,000 Prepaid expenses -25,000 46,000 -76,000 11,000 -1,000 19,000 Accounts payable 256,000 -90,000 232,000 62,000 339,000 -37,000 Accrued liabilities -451,000 -437,000 -394,000 -116,000 -190,000 -184,000 Income taxes payable 7,000 25,000 93,000 -23,000 104,000 133,000 Other working capital -1,064,000 -855,000 -928,000 -668,000 -1,484,000 -1,283,000 Other non-cash items 1,705,000 1,723,000 507,000 -70,000 224,000 774,000 Net cash provided by operating activities 1,674,000 1,582,000 870,000 701,000 217,000 326,000 Cash Flows From Investing Activities Investments in property, plant, and equipmen -1,219,000 -1,180,000 -1,125,000 -596,000 -768,000 -686,000 Acquisitions, net -2,385,000 97,000 10,000 0 0 0 Purchases of investments -195,000 -134,000 -52,000 -2,000 0 0 Sales/Maturities of investments 57,000 40,000 280,000 890,000 9,000 47,000 Other investing activities 282,000 117,000 722,000 248,000 1,324,000 1,281,000 Net cash used for investing activities -3,460,000 -1,060,000 -165,000 540,000 565,000 642,000 Cash Flows From Financing Activities Debt issued 2,878,000 1,901,000 1,962,000 816,000 600,000 450,000 Debt repayment -1,723,000 -2,030,000 -2,734,000 -1,634,000 -1,120,000 -454,000 Preferred stock issued 1,211,000 0 0 0 0 0 Excess tax benefit from stock based compe 9,000 9,000 0 0 0 0 Dividend paid -161,000 -223,000 -228,000 -162,000 -119,000 -78,000 Other financing activities 36,000 -98,000 246,000 17,000 -10,000 -1,102,000 Net cash provided by (used for) financing 2,250,000 -441,000 -754,000 -963,000 -649,000 -1,184,000 Effect of exchange rate changes -24,000 -39,000 -7,000 9,000 -4,000 -2,000 Net change in cash 440,000 42,000 -56,000 287,000 129,000 -218,000 Cash at beginning of period 1,437,000 1,877,000 1,919,000 1,863,000 2,153,000 1,542,000 Cash at end of period 1,877,000 1,919,000 1,863,000 2,150,000 2,282,000 1,324,000 Free Cash Flow Operating cash flow 1,674,000 1,582,000 870,000 701,000 217,000 326,000 Capital expenditure -1,219,000 -1,180,000 -1,125,000 -596,000 -768,000 -686,000 Free cash flow 455,000 402,000 -255,000 105,000 -551,000 -360,000 ____________________________________________________________________________________________________________________________________________
Average to Current P/E Ratios |
              (ARNC)     Arconic Inc.

                               2014    2015    2016    2017    2018

          Annual Earnings:     0.00   -0.93   -2.31   -0.28    1.29
Average Price During Year:    25.08   19.16   25.96   22.34

                P/E Ratio:   250.78   20.60   11.24   79.79    0.00

 Average 5-Year P/E Ratio  =  72.48
             Current Price =  28.97

Previous 5 Quarter Earnings:   0.32    0.44    0.39   -0.27    0.21

          Current Annualized (Last Four Quarters) Earnings =   0.33
                                                           ________
                                 Average PE / Current PE =     0.83
                                                           --------

                                      ...a number above 1.00 is good
                                                1.00 or below is bad
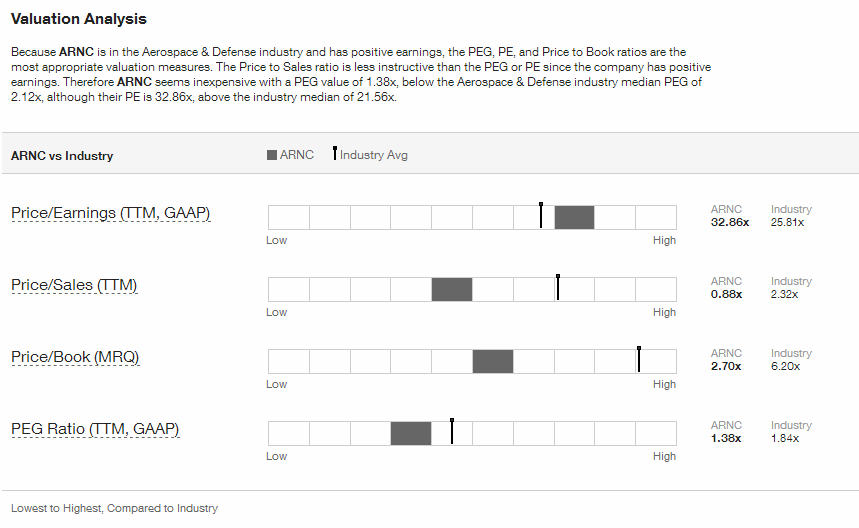
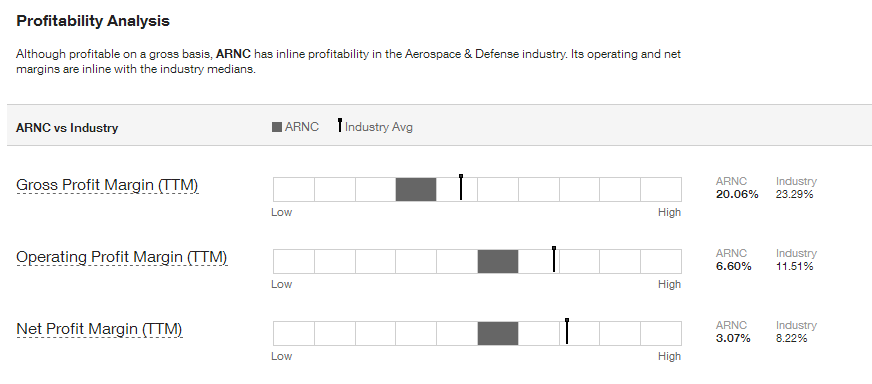
Financial Ratios |
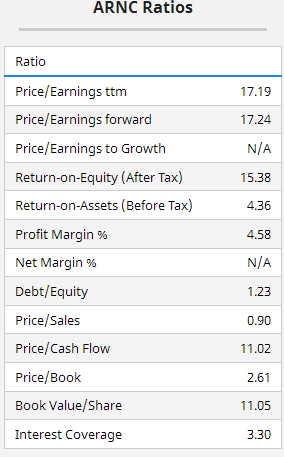
. . . . . . . . . . . . Lowest to Highest, Compared to Industry
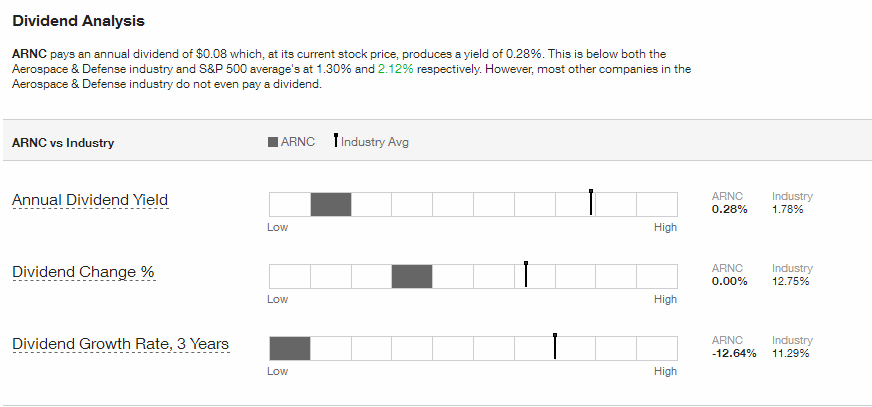
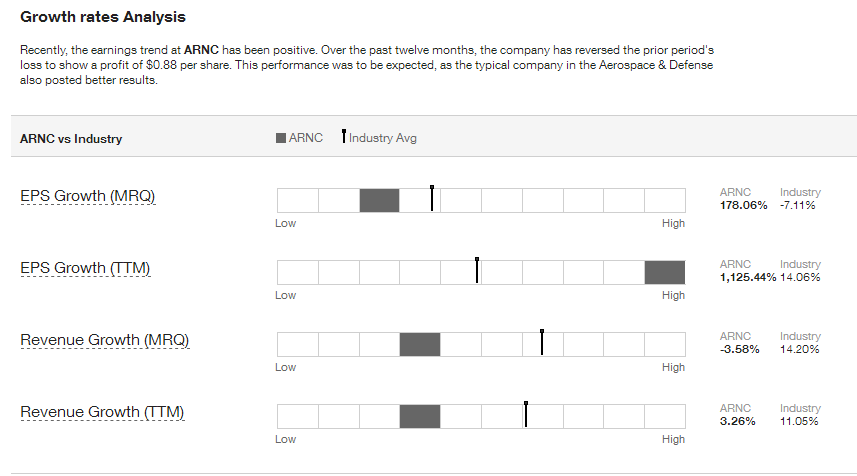
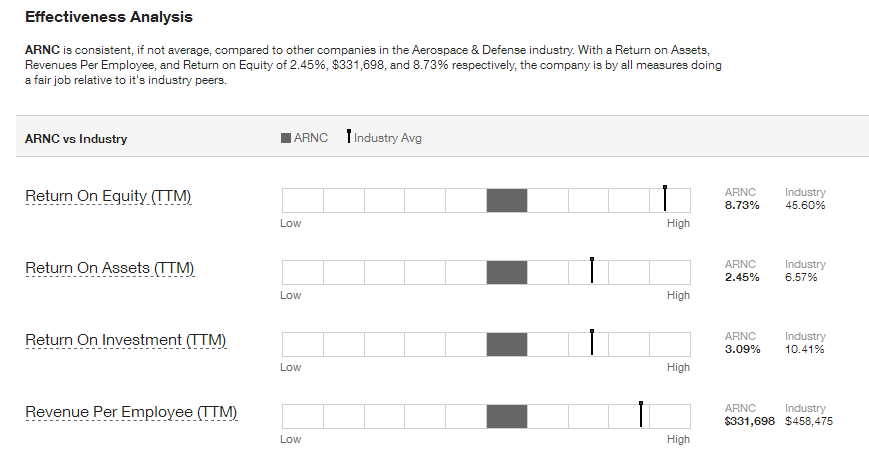
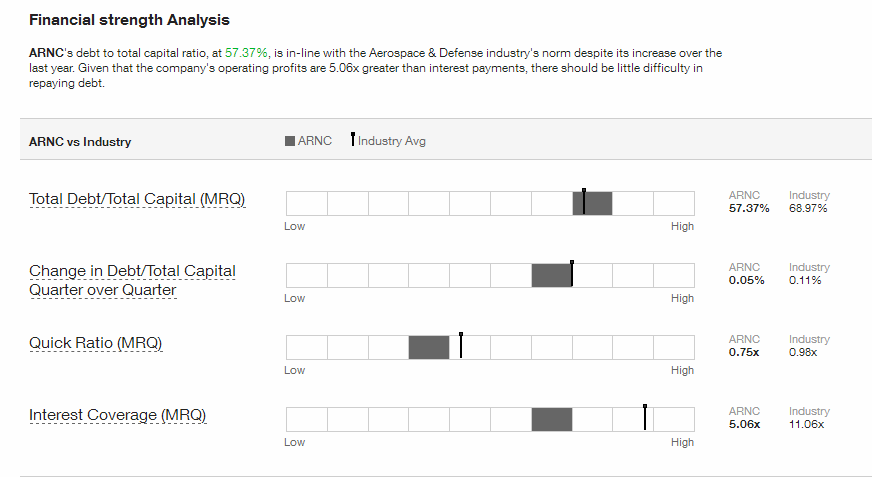
Intrinsic Value (DCF) |
Intrinsic Value by Discounted Cash Flow Method:

Fair Value Estimator |
Fair Value Estimate:

Projected Earnings |

Research Reports |
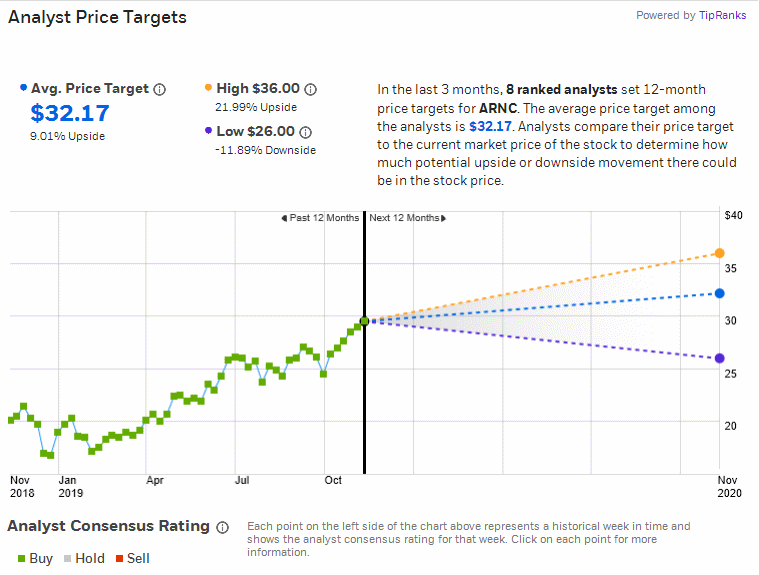
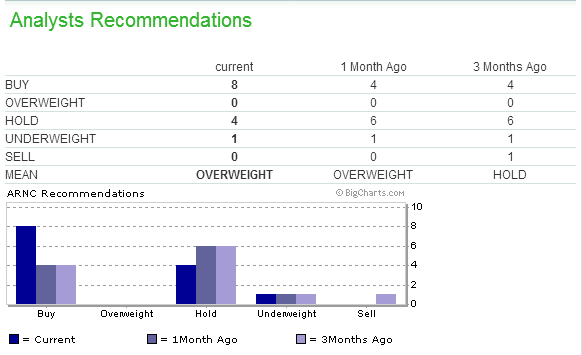
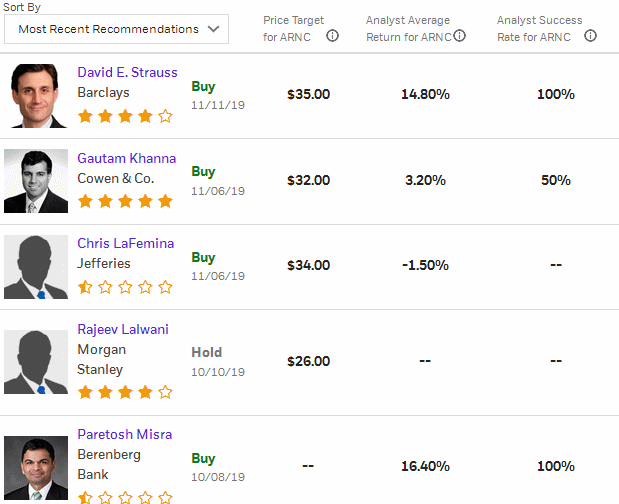
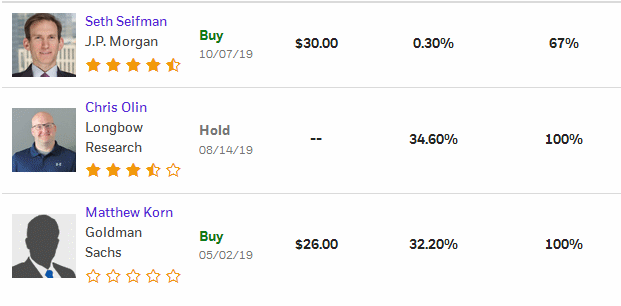
Analysts' Opinions |

Insider Activity |
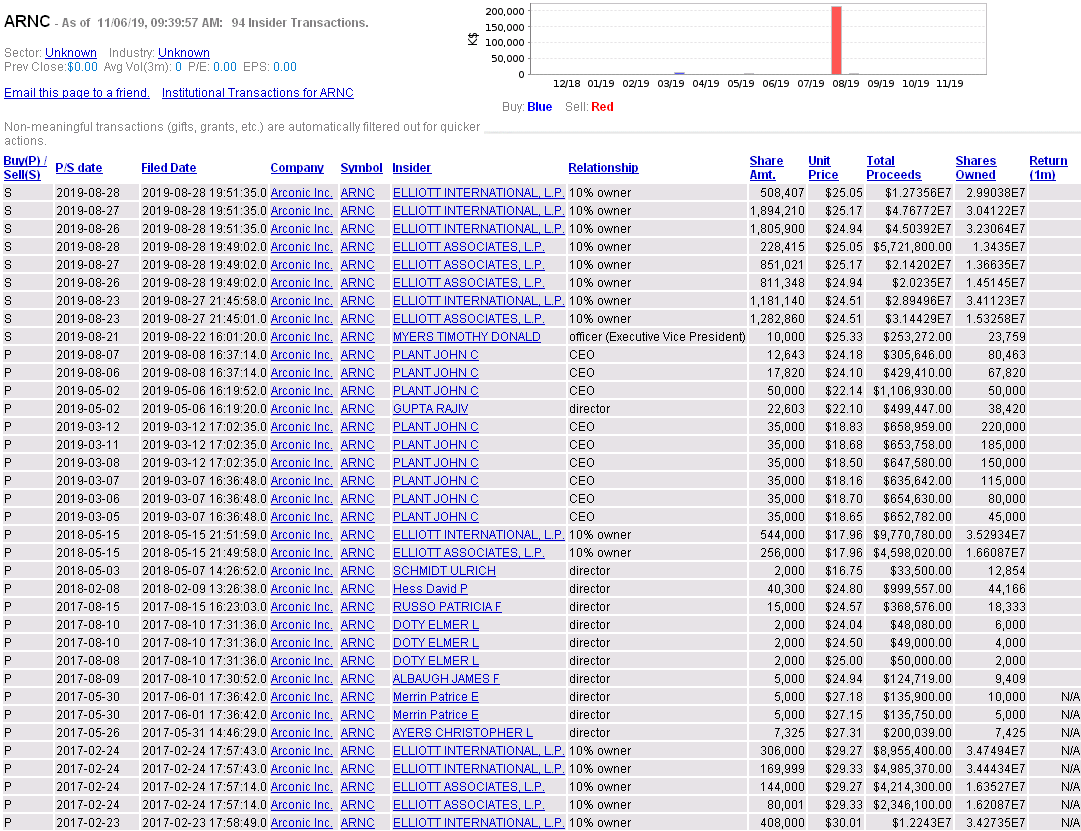

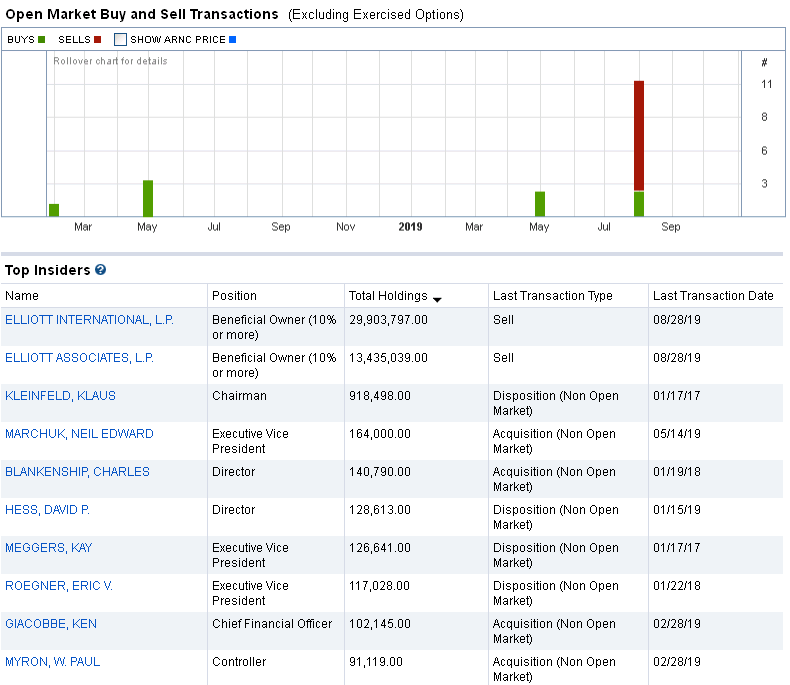
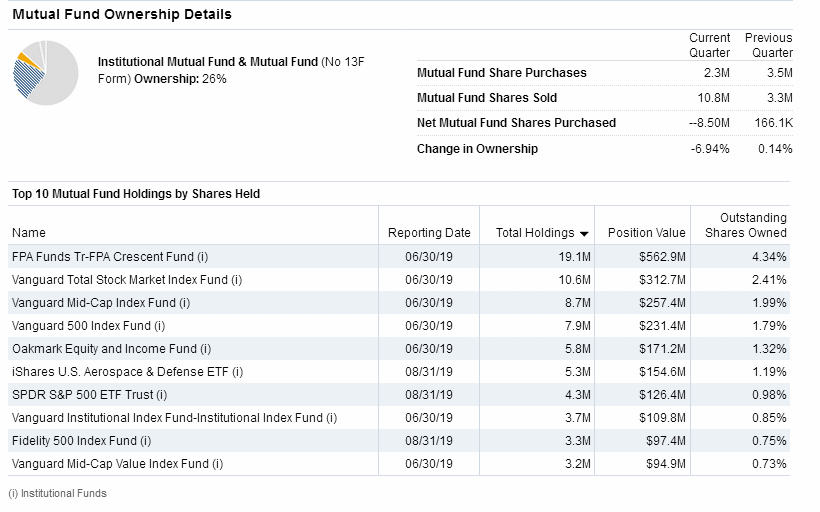
Institutional Activity |
Institutional Ownership:
Sentiment |
Zenith uses the "sentiment" score above or below 50 to award a positive or negative point in the Decision Matrix.
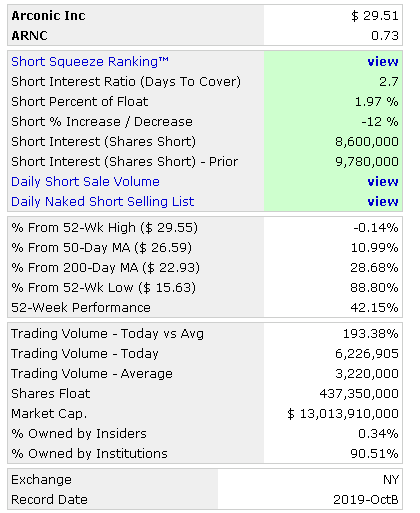
Short Interest Ratio |
As the short interest rises as a percentage of average daily share volume (Days to Cover), this is considered a measure of negative sentiment. Similarly, a decrease in that percentage is considered positive sentiment.

Standard & Poor's |
Management's Discussion of Results of Operations Excerpts |
Channeling Potential |
The summary below includes a value for `Degree,' which refers on a
scale of 1 to 10 the range of a channel in the period under consi-
deration compared to the total range of price movement. It also looks
for the last closing price to be within the channel, otherwise zeroed.
The `Index' is the `Degree' weighted for volatility.  Generally, the
the higher the index, the more suitable is the stock for trading as
a `rolling stock' between channel high and low points.

Results for ARCONIC INC.:
Symbol? ARNC
Total Months Available:  68
       Months in Cycle?   4

Months Covered by Periods:  12

Period 1           Period 2          Period 3
   H1      L1        H2      L2        H3      L3
  21.74   15.63     26.40   18.43     29.55   23.15

RANGE   =  29.55  TO   15.63            Close =  28.91
CHANNEL =  23.15  TO   21.74           Degree =   1
Volatility =   4.88%                    Index =   0
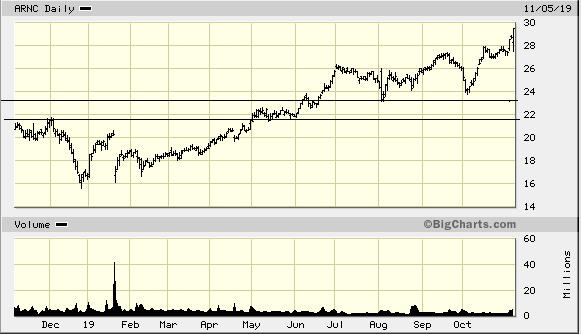
MACD Histogram Divergence |
The theory is that connecting the two most recent peaks or valleys of the MACD histogram will signal the direction of the next major move.
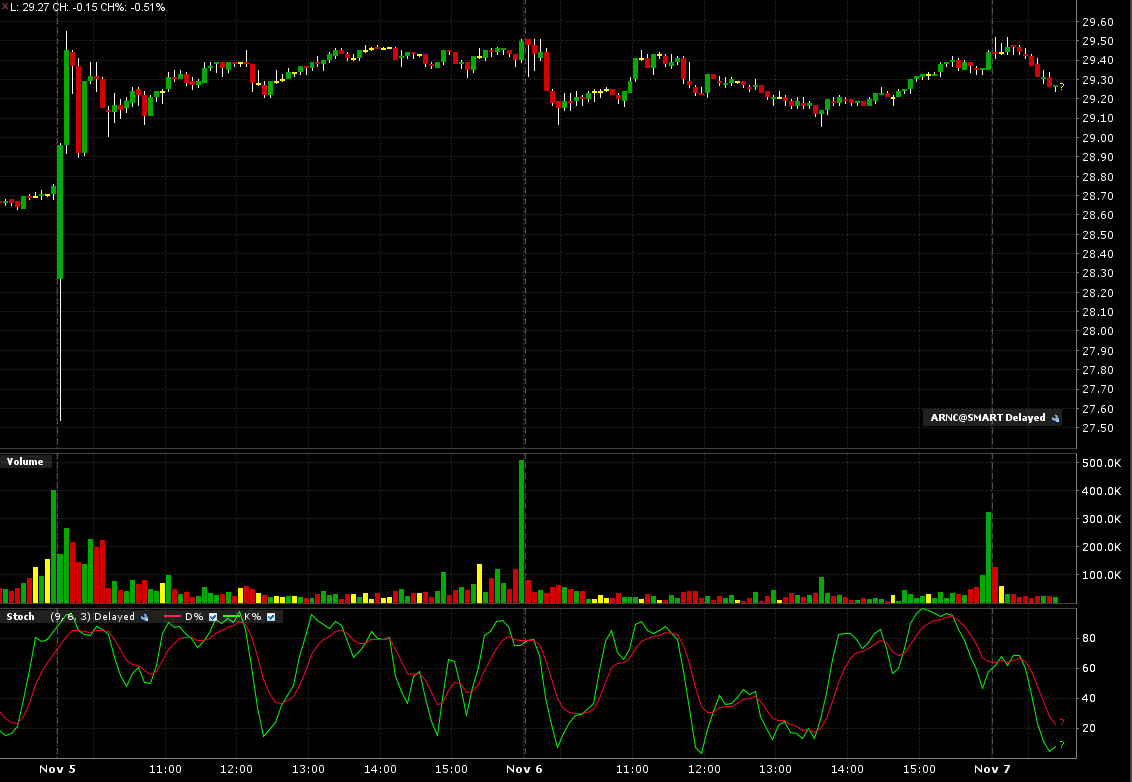
Intraday Chart |
2 Days:
Val Idea |
2 out of 12 favorable, (negative opinion.)
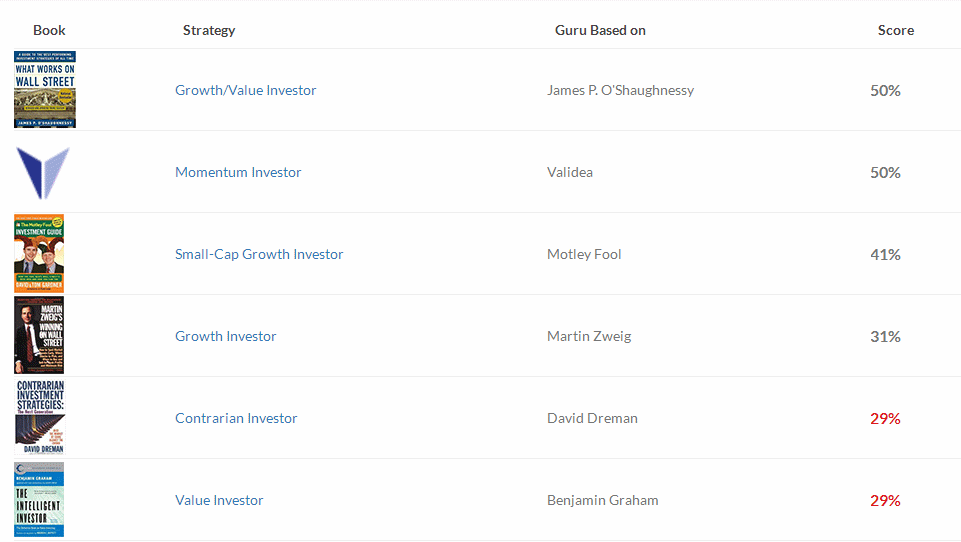
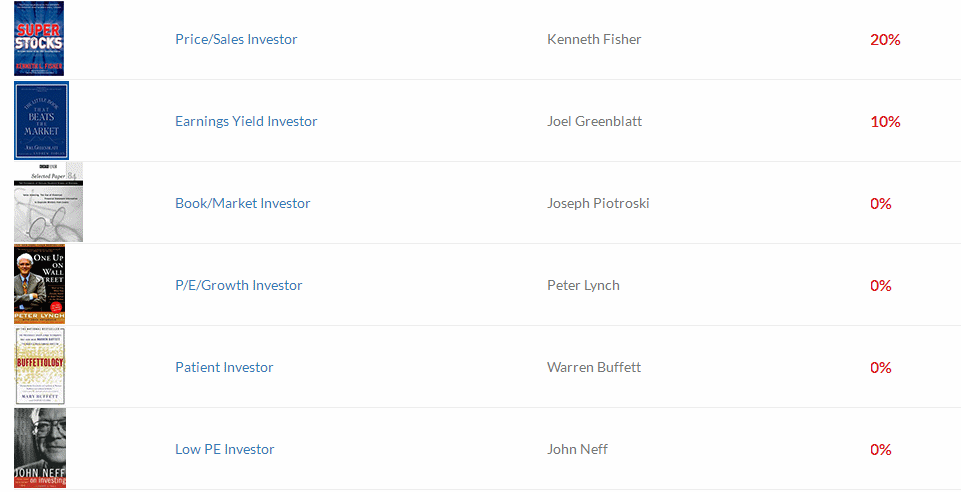
Stock Consultant |
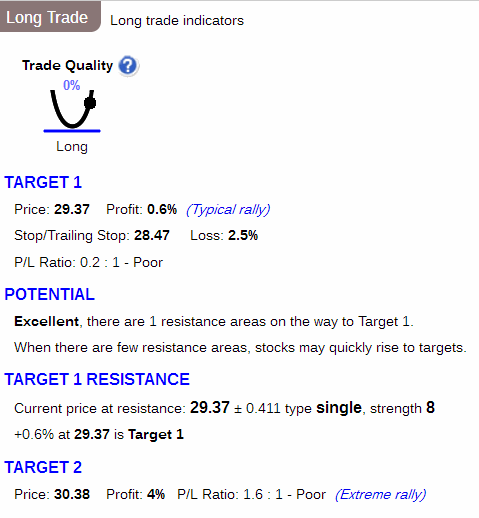
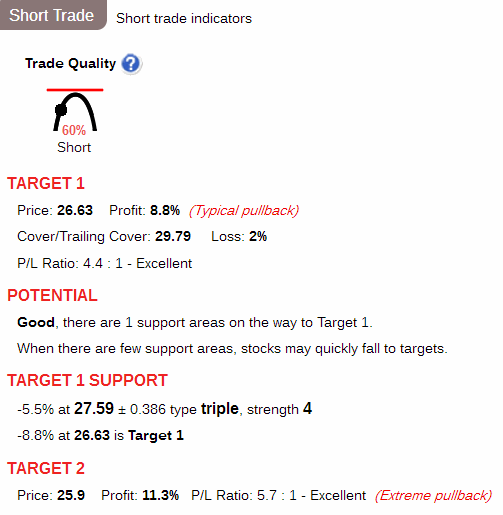
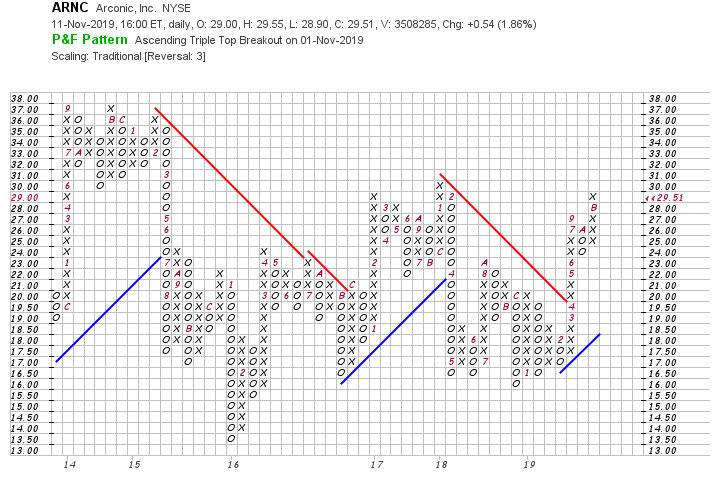
Point & Figure Chart |
Wall Street Analyzer |
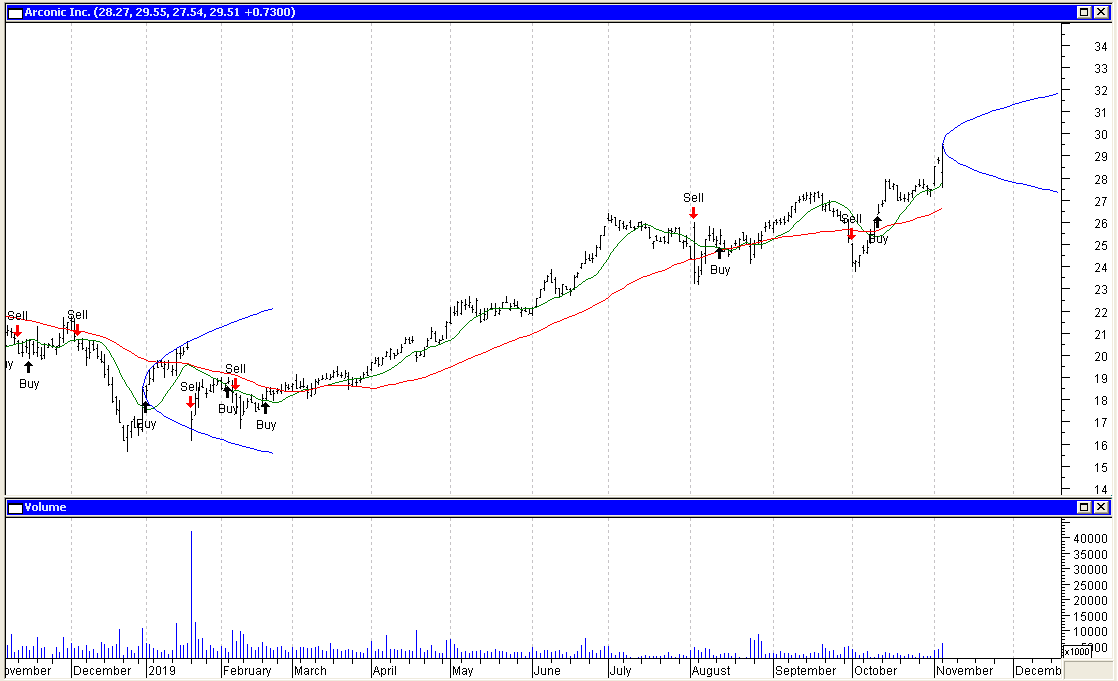
Marketspace Chart |
Time Series Forecast |
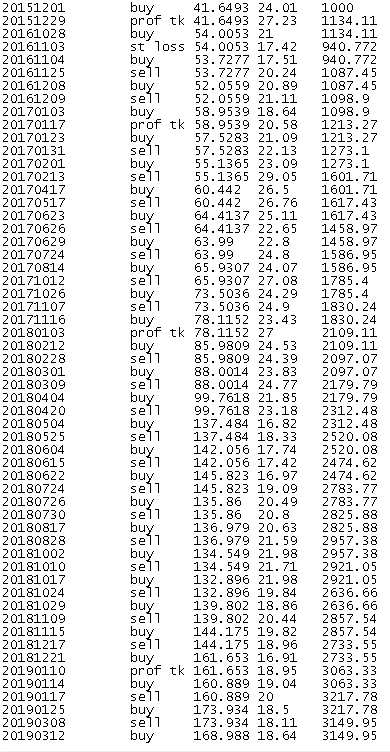
Neural Network Prediction |
"Neurostock" can only track long trades. Therefore its performance, as tracked by itself on stocks which are consistently falling, may not appear as good as it could if each "sell" signal were a "short sale."

![]()

Ultimate Trading Systems |
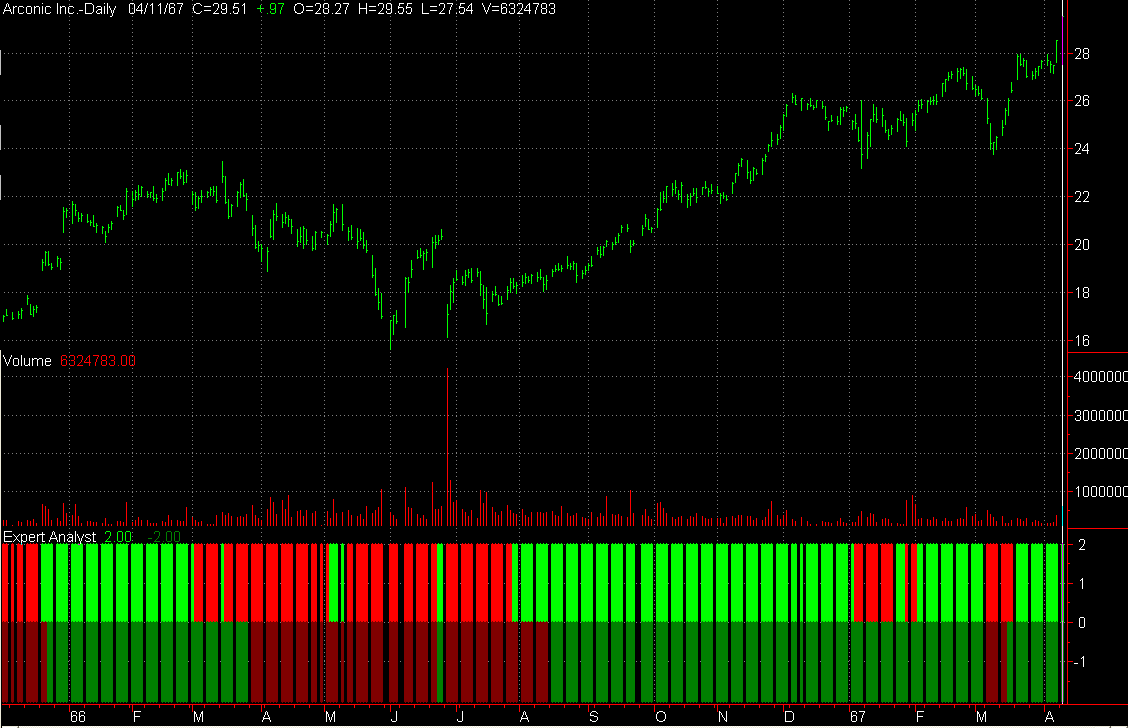
2 out of 3 of the ultimate systems favor an upmove.
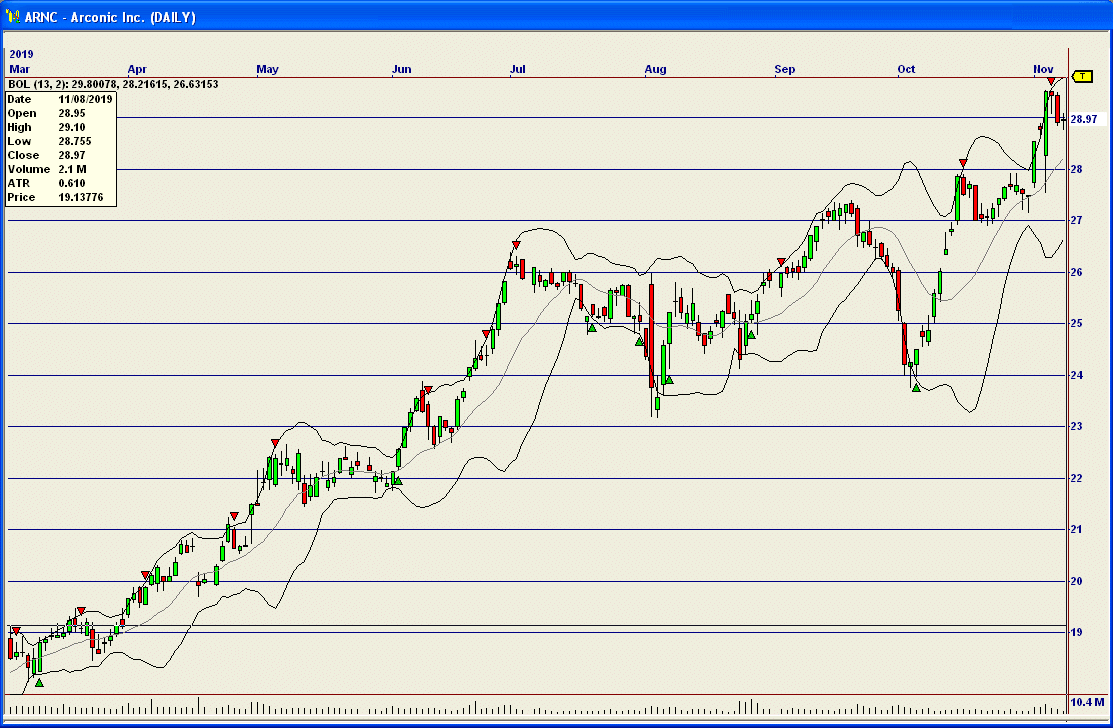
System Below:
Short term outlook: Positive: Bright Green, Negative: Bright Red
Long term outlook: Postive: Dark Green, Negative: Dark Red.

Recommendation |
| Factors | Weighted Points |
|---|---|
| News | + 1 |
| Comparison | + 1 |
| Industry | + 1 |
| Bond Issue | 0 |
| Zenith Index | - 1 |
| Non-GAAP vs. GAAP Earnings | - 1 |
| Cash Flow | - 1 |
| Average to Current P/E | - 1 |
| Ratios | + 1 |
| Intrinsic Value DCF | 0 |
| Fair Value Estimator | - 1 |
| Projected Earnings | + 1 |
| Research Reports | + 1 |
| Analysts | + 1 |
| Executive Perquisites | - 1 |
| Insider Activity | - 1 |
| Institutional Activity | - 1 |
| Management Reporting | + 1 |
| Short Interest | + 1 |
| Sentiment | + 1 |
| Standard & Poor's | - 1 |
| MACD Histogram Divergence | + 1 |
| Val Idea | - 1 |
| Stock Consultant | - 1 |
| Point & Figure | + 1 |
| Wall Street Analyzer | + 1 |
| Marketspace Chart | + 1 |
| Time Series Chart | - 1 |
| Neural Network | - 1 |
| Stock Options | + 1 |
| Ultimate Trading Systems | + 1 |
| Total | + 3 |
Place 1,020 shares of Arconic Inc. (ARNC) on the Active List.